Oct 18, 2016

Warm October? You Ain't Seen Nuthin' Yet!

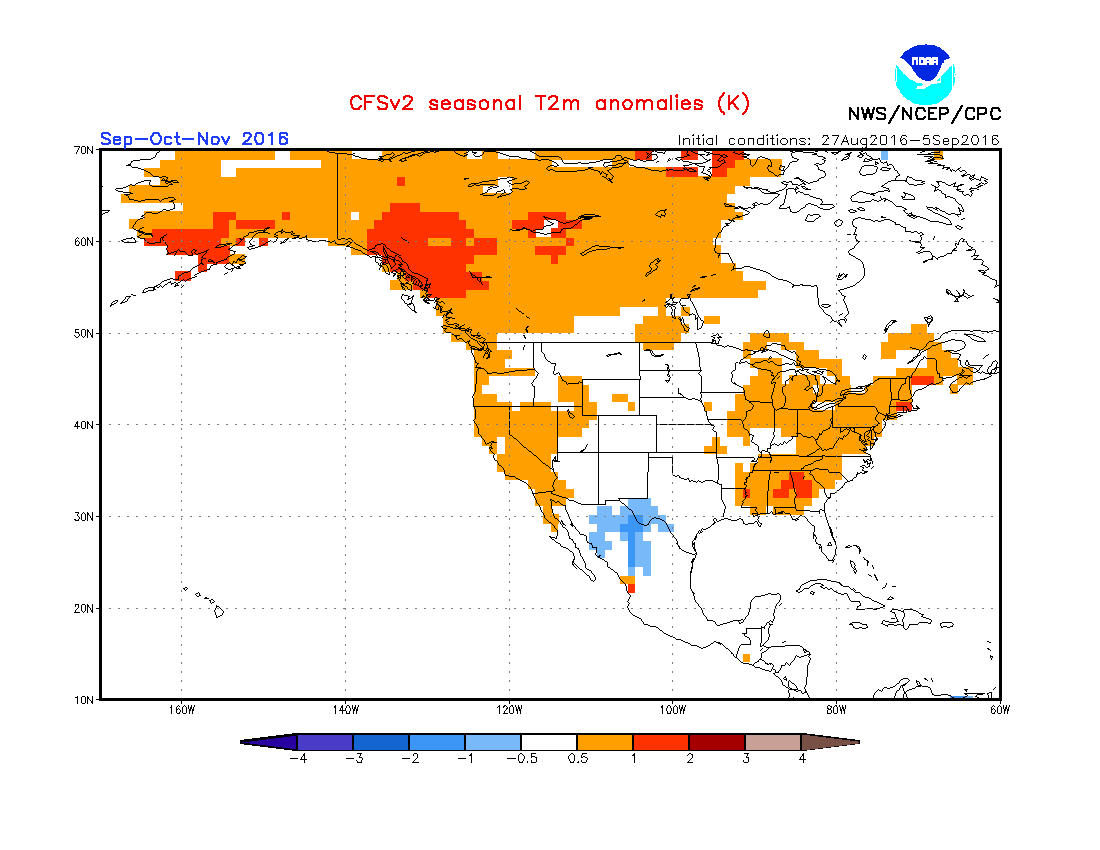
This October of  2016 has been one of the nicer ones thus far but then again; that is not unusual for October in these parts. In addition, the chances of a nicer fall (and projected in the brief fall outlook), is tipped in its favor during La Nina.

Let's look at October's data thus far: 

STATION:   DETROIT MI PRELIMINARY LOCAL CLIMATOLOGICAL DATA (F-6)
 MONTH:     OCTOBER
YEAR:      2016
LATITUDE:   42 13 N
LONGITUDE:  83 20 W
 
TEMPERATURE IN F:       :PCPN:    SNOW:  WIND      :SUNSHINE: SKY     :PK WND
======================================================================
1   2   3   4   5  6A  6B    7    8   9   10  11  12  13   14  15   16   17  18
12Z  AVG MX 2MIN
DY MAX MIN AVG DEP HDD CDD  WTR  SN DP SPD SPD DIR MIN PSB S-S WX SPD DR
======================================================================
1   69  56  63   5   2   0 0.29  0.0    0  5.8 14 180   M    M  10 138    17 170
2   69  52  61   3   4   0 0.02  0.0    0  4.5 12 290   M    M   6 18     15 270
3   66  53  60   3   5   0 0.00  0.0    0  3.3  8 230   M    M   6 128    11 260
4   74  52  63   6   2   0 0.00  0.0    0  5.1 14 140   M    M   4 128    20 170
5   76  61  69  13   0   4    T  0.0    0  8.4 16 130   M    M   7        22 130
6   79  61  70  14   0   5 0.00  0.0    0  5.2 14 170   M    M   5 18     18 130
7   77  57  67  11   0   2    T  0.0    0  7.4 20 300   M    M   4 18     25 300
8   61  43  52  -3  13   0 0.00  0.0    0 10.0 20 290   M    M   2        26 270
9   62  40  51  -4  14   0 0.00  0.0    0  6.2 15  10   M    M   3        19  10
10 60  39  50  -4  15   0 0.00  0.0    0  4.2 12 140   M    M   2 18     16 170
11 67  48  58   4   7   0 0.00  0.0    0  4.2 13 170   M    M   8 18     16 130
12 78  51  65  11   0   0 0.18  0.0    0 11.4 25 210   M    M   7 18     33 210
13 58  43  51  -2  14   0    T  0.0    0  7.5 20 320   M    M   5        28 320
14 59  39  49  -4  16   0 0.00  0.0    0  3.8 13 130   M    M   2 18     16 160
15 73  42  58   5   7   0 0.00  0.0    0  7.9 20 210   M    M   6 18     24 210
16 69  63  66  14   0   1 0.12  0.0    0 11.2 21 230   M    M   9 18     27 220
17 81  63  72  20   0   7 0.00  0.0    0 13.7 28 210   M    M   7 1      35 220
======================================================================
SM 1178  863        99  19  0.61     0.0 119.8          M       93
======================================================================
AV 69.3 50.8                               7.0 FASTST   M    M   5    MAX(MPH)
MISC ---->  # 28 210               # 35  220
======================================================= 
PRELIMINARY LOCAL CLIMATOLOGICAL DATA (WS FORM: F-6) , PAGE 2
                                          STATION:  DETROIT MI
                                          MONTH:    OCTOBER
                                          YEAR:     2016
                                          LATITUDE:   42 13 N
                                          LONGITUDE:  83 20 W 
[TEMPERATURE DATA]      [PRECIPITATION DATA]        
AVERAGE MONTHLY: 60.0     TOTAL FOR MONTH:   0.61   
DPTR FM NORMAL:   5.1         DPTR FM NORMAL:   -0.79   
HIGHEST:    81 ON 17                 GRTST 24HR  0.52 ON 30- 1      
LOWEST:     39 ON 14,10                            

With an average temperature right at 60 (above) for better than half of the month, Detroit is averaging a solid five /5.1/ degrees above normal. This is of course, is taking into account the first half of the month's normals - which by the averages, are normally the warmer half. Taking a look at October's normals below, you can see by the 18th, we normally have a HIGH around 60 - not the average /52/. Also, one can see that the records this time of year are in the lower to mid 80s, which we have been flirting with the past day or two (17,18th) but they remain intact.

October - Detroit Records 1874 - Present


October Normals
(1980-2010)
Maximum Minimum Average Daily
Temperature
Precipitation
Date Max Min Avg Record
High
Lowest
Max
Highest
Min
Record
Low
Highest Lowest Greatest Date
1 68 48 58.0 88/1897 46/1920 66/2002 31/1947 76/2002 39/1899 1.55/1945 1
2 67 48 58.0 86/1971 46/1974 66/1927 29/1974 75/1927 38/1974 2.00/1925 2
3 67 48 57.0 89/1953 46/1888 68/2005 24/1974 77/1898 38/1974 3.29/1954 3
4 66 47 57.0 89/1951 45/1980 68/1884 32/1989 77/1951 39/1935 1.06/2000 4
5 66 47 56.0 88/1951 46/1892 67/1941 31/1965 77/1922 41/1935 2.10/1919 5
6 65 46 56.0 91/1963 45/1889 68/1900 30/1935 77/2007 40/1935 2.20/1959 6
7 65 46 56.0 92/1963 44/1896 68/2007 29/1935 79/2007 40/1889 1.50/1951 7
8 65 46 55.0 90/2007 43/1915 68/2007 25/1889 79/2007 39/1895 1.02/1967 8
9 64 45 55.0 86/1949 44/1915 66/1879 28/1989 75/1949 39/1895 1.43/1950 9
10 64 45 54.0 84/1949 42/1906 67/1879 29/1972 75/1949 36/1906 1.03/1932 10
11 63 45 54.0 86/1928 42/1906 65/1879 25/1906 73/1928 34/1906 3.27/1949 11
12 63 44 54.0 84/1995 41/1909 65/1879 26/1875 74/1879 35/1875 1.25/1901 12
13 63 44 53.0 83/1975 40/1909 62/1879 26/1977 70/1930 36/1909 1.57/1983 13
14 62 44 53.0 83/1989 42/1937 59/2014 27/1937 71/1975 35/1937 1.78/2003 14
15 62 43 53.0 86/1897 39/1876 66/1897 24/1876 76/1897 32/1876 1.03/1967 15
16 62 43 52.0 85/1938 37/1875 64/1928 26/1977 71/1958 34/1875 1.92/2001 16
17 61 43 52.0 85/1938 41/1952 67/1879 23/1977 72/1968 37/1952 1.70/1967 17
18 61 43 52.0 84/1963 37/1880 63/1947 24/1976 71/1963 34/1972 1.54/1937 18
19 60 42 51.0 85/1953 35/1930 61/1963 22/1972 71/1953 32/1930 2.02/1985 19
20 60 42 51.0 80/1920 36/1895 62/1920 19/1972 71/1920 32/1974 1.09/1918 20
21 60 42 51.0 81/2007 39/1925 64/1979 17/1974 71/1979 33/1895 0.96/1965 21
22 59 41 50.0 81/1920 40/1997 62/1951 25/1967 71/1979 34/1997 1.98/1929 22
23 59 41 50.0 83/1963 40/1937 59/2012 22/1969 71/1963 33/1969 2.08/1957 23
24 59 41 50.0 81/1963 40/1880 61/1991 22/1981 69/2012 32/1981 1.07/2000 24
25 58 41 49.0 82/1963 38/1887 63/1991 24/1981 72/1963 32/1887 1.09/1991 25
26 58 40 49.0 83/1963 40/1980 61/1991 22/1887 71/1963 32/1887 1.29/1920 26
27 57 40 49.0 78/1927 38/1997 58/1947 22/1976 67/1984 31/1976 1.48/1981 27
28 57 40 48.0 78/1927 35/1925 55/1964 21/1976 64/1927 31/1925 1.13/2015 28
29 57 40 48.0 77/1999 32/1925 64/1946 22/1980 70/1946 28/1925 0.74/1875 29
30 56 39 48.0 76/1999 35/1925 63/1946 20/1980 69/1946 31/1925 1.29/1900 30
31 56 39 48.0 79/1950 34/1917 60/1974 21/1988 70/1950 29/1917 1.59/2013 31

Normal High: 61.6

Normal HDD: Month: 397

Normal Monthly Precip: 2.52
Normal Low : 43.3 Normal HDD Season: 501 Normal Yearly Precip: 28.22
Normal Mean: 52.4 Normal CDD: Month: 8 Ave Snow this Month : 0.1
Normal CDD Season: 803 Ave Snow for the Season: 0.1

Precip: Greatest Monthly Total: 7.80/1954

Snow: Greatest Monthly Total: 2.9/1980
Precip: Least Monthly Total: 0.30/1892 Snow: Least Monthly Total: 0.0/na


Looking at our top 20 warmest (and coldest Octobers) listing for Detroit below, you can see there have been several nice Octobers when looking at its attained temperature averages for the month. Many in the top five were able to hold near the average we have at this time but for the entire month. Looking back at October's spring counter-part April, April is generally a "lousier" month over October (average of 49.2 vs October's 52.4 for a start) across the Great Lakes and Southeast Lower Michigan. Therefore, if you are planning a spring or fall vacation across the region, October wins hands-down for this and many more reasons. Again, it's generally warmer, nature's full color display peaks and there is especially no comparison between the first half of April to the first half of October. October is also generally a drier month when compared to April and has been again, this year thus far with only six tenths /.61"/ recorded thus far. Also, 1.3" of snow fell during the first half of April 2016 versus none this first half of October. In addition; many times measurable snow is the norm during the first half of April (especially across the northern half of the Lakes) versus the rare or infrequent event during the first half of October most regions.

Top 20 Coldest/Warmest Octobers in Southeast Lower Michigan

Rank Detroit Area* Flint Bishop** Saginaw Area***
Coldest Warmest Coldest Warmest Coldest Warmest
Temp Year Temp Year Temp Year Temp Year Temp Year Temp Year
1 44.5 1925 62.7 1963 42.5 1925 59.4 1947 40.6 1925 58.5 1963
2 44.9 1917 60.3 1947 44.3 1980 58.2 1963 42.1 1917 58.2 1947
3 45.3 1895 60.0 1900 44.5 1952 57.6 1971 43.7 1972 58.1 1971
4 45.8 1876 59.5 1920 44.7 1981 57.3 2007 43.9 1988 57.5 1920
5 46.0 1988 59.5 1879 44.8 1988 55.9 1924 44.1 1952 56.8 2007
6 46.3 1980 59.1 2007 45.2 1987 55.7 1946 44.6 1980 55.7 1931
7 46.4 1875 58.5 1971 46.0 2006 55.7 1938 44.7 1981 55.2 1956
8 46.5 1987 58.2 1946 46.1 1964 55.6 1949 45.6 1987 55.0 1973
9 47.0 1889 57.6 1882 46.2 1972 55.3 1973 46.1 2006 54.6 1914
10 47.0 1888 57.5 1956 46.8 1976 55.1 1956 46.1 2002 54.3 1946
11 47.3 1972 57.5 1931 47.3 1993 55.1 1931 46.4 1976 54.2 1938
12 47.3 1909 57.4 1949 47.3 1957 54.4 1950 46.5 1977 54.1 1927
13 47.3 1976 57.4 1924 47.4 2009 54.0 1984 46.9 1926 54.1 1924
14 47.3 1907 57.0 1881 47.6 2002 53.8 2015 47.1 1992 53.8 1949
15 47.5 1981 56.8 1953 47.6 1966 53.7 1953 47.2 1964 53.5 1975
16 47.6 1896 56.7 1927 47.7 2008 53.6 1975 47.5 1945 53.5 1970
17 47.9 1977 56.6 1914 47.9 1945 53.6 1928 47.5 1943 53.5 1928
18 48.0 1887 56.5 1919 48.0 1997 53.5 2000 47.7 2009 53.4 1961
19 48.1 1952 56.4 1950 48.0 1937 53.5 1927 47.8 1993 53.3 1953
20 48.6 1880 56.3 1961 48.1 1992 53.1 1934 47.8 1978 53.1 1955
* Detroit Area temperature records date back to January 1874.

** Flint Bishop temperature records date back to January 1921.

*** Saginaw Area temperature records date back to January 1912.


Scanning the five driest October's on record at Detroit, one sees the driest occurred back relatively recently - back 2005. The average temperature of 55.2 was still close to 3 degrees above normal and another relatively nice October.

 Top 20 Wettest/Driest Octobers in Southeast Lower Michigan

 
Rank Detroit Area* Flint Bishop** Saginaw Area***
Wettest Driest Wettest Driest Wettest Driest
Total Year Total Year Total Year Total Year Total Year Total Year
1 7.80 1954 0.13 2005 6.59 2001 0.13 1923 7.78 1954 0.18 1952
2 6.76 2001 0.30 1892 5.52 1941 0.33 2005 5.57 1990 0.28 1956
3 6.52 1881 0.47 1924 4.72 1921 0.33 1944 5.33 1962 0.38 1924
4 5.67 1890 0.50 1964 4.21 1954 0.38 1956 5.29 1951 0.46 1975
5 5.50 1949 0.51 1963 4.20 1929 0.57 1982 5.29 1941 0.48 1982

Some of this data bares out my title of this piece but nothing like the warmest October month (1963) along with it being the 5th driest - now that was a beautiful October and we were beginning El Nino that fall, not La Nina (that occurred the following fall /1964/. Take a look at the DET LCD (Detroit City Arpt) for the month, where the official record was taken at the time. Take note of the short but hot spell that took place the 7th-8th with temps in the lower 90s! Then again, during a much longer 12-day stretch of much above normal temperatures that commenced during our present time-period /16th/ and ran through the 27th. Many days reached temperatures into the lower to mid 80s! In comparison, this October thus far we've had one.

In all; during the glorious month of October of '63, Detroit recorded two 90+ degree days and ten 80 degree or better days. And of those high temperatures /12 days/; seven still remain records! Not to be be outdone, on the rainfall side, just a half inch /.51"/ fell the entire month, over two inches /-2.12/ below the normal at the time.


http://www1.ncdc.noaa.gov/pub/orders/IPS/IPS-7B772218-BB4A-4A2B-8EDC-21926BB3DFD6.pdf

And looking out ahead for the remainder of October, while the month should average above normal I see nothing like what happened in 1963 - what an October month, for sure!

Making weather fun while we all learn,
Bill Deedler - SEMI_WeatherHistorian


Oct 3, 2016

JUST WHAT IS INDIAN SUMMER AND DID INDIANS REALLY HAVE ANYTHING TO DO WITH IT?

Originally written 20 years ago in the Autumn of 1996; my Indian Summer article remains one of the more popular of my articles written. And, still to this day, I receive comments on it and Indian Summer types of weather over many parts of the globe.

JUST WHAT IS INDIAN SUMMER AND DID INDIANS REALLY HAVE ANYTHING TO DO WITH IT?

Written by: William R. Deedler, Weather Historian
(originally written in the Autumn of 1996)

An early American writer described Indian Summer well when he wrote, "The air is perfectly quiescent and all is stillness, as if Nature, after her exertions during the Summer, were now at rest." This passage belongs to the writer John Bradbury and was written nearly an "eternity" ago, back in 1817. But this passage is as relevant today as it was way back then. The term "Indian Summer" dates back to the 18th century in the United States. It can be defined as "any spell of warm, quiet, hazy weather that may occur in October or even early November." Basically, autumn is a transition season as the thunderstorms and severe weather of the summer give way to a tamer, calmer weather period before the turbulence of the winter commences.

The term "Indian Summer" is generally associated with a period of considerably above normal temperatures, accompanied by dry and hazy conditions ushered in on a south or southwesterly breeze. Several references make note of the fact that a true Indian Summer can not occur until there has been a killing frost/freeze. Since frost and freezing temperatures generally work their way south through the fall, this would give credence to the possibility of several Indian Summers occurring in a fall, especially across the northern areas where frost/freezes usually come early.

While almost exclusively thought of as an autumnal event, I was surprised to read that Indian Summers have been given credit for warm spells as late as December and January (but then, just where does that leave the "January Thaw" phenomenon?). Another topic of debate about Indian Summer has been "location, location". Evidently, some writers have made reference to it as native only to New England, while others have stated it happens over most of the United States, even along the Pacific coast. Probably the most common or accepted view on location for an Indian Summer would be from the Mid-Atlantic states north into New England, and then west across the Ohio Valley, Great Lakes, Midwest and Great Plains States. In other words, locations that generally have a winter on the horizon! But then, what about the king of winter weather in the United States, Alaska? Do they have an "Indian Summer", or something similar? Some places in Alaska are lucky to have a "summer", let alone an Indian Summer! One would certainly have to throw out the notion of it usually happening in October or November, when, winter generally has already taken an aggressive foothold on much of the state. What about other locations that come to mind, The Rocky Mountain States and parts of Canada, particularity in the east and south? Note: If anyone reading this has any information on Indian Summers in those areas questioned, or just thoughts on Indian Summers drop me a note or comment. (Editors note: Over the years while at the NWS and after, I've received several fascinating notes from all over the world on how common and widespread "Indian Summers" were with each having its own specific local or regional definition).

A typical weather map that reflects Indian Summer weather involves a large area of high pressure along or just off the East Coast. Occasionally, it will be this same high pressure that produced the frost/freeze conditions only a few nights before, as it moved out of Canada across the Plains, Midwest and Great Lakes and then finally, to the East Coast. Much warmer temperatures, from the deep South and Southwest, are then pulled north on southerly breezes resulting from the clockwise rotation of wind around the high pressure. It is characteristic for these conditions to last for at least a few days to well over a week and there may be several cases before winter sets in. Such a mild spell is usually broken when a strong low pressure system and attending cold front pushes across the region. This dramatic change results from a sharp shift in the upper winds or "jet stream" from the south or southwest to northwest or north. Of course, there can be some modifications to the above weather map scenario, but for simplicity and common occurrence sake, this is the general weather map.

Now we come to the origin of the term itself, "Indian Summer". Over the years, there has been a considerable amount of interest given to this topic in literature. Probably one of the most intensive studies occurred way back around the turn of the century. A paper by Albert Matthews, written in 1902, made an exhaustive study of the historical usage of the term. Evidently, the credit for the first usage of the term was mistakenly given to a man by the name of Major Ebenezer Denny, who used it in his "Journal", dated October 13th, 1794. The journal was kept at a town called Le Boeuf, which was near the present day city of Erie, Pennsylvania. Matthews however, uncovered an earlier usage of the term in 1778 by a Frenchman called St. John de Crevecoeur. It appeared in a letter Crevecoeur wrote dated "German-flats, 17 Janvier, 1778." The following is a translation of a portion of the letter:
"Sometimes the rain is followed by an interval of calm and warmth which is called the Indian Summer; its characteristics are a tranquil atmosphere and general smokiness. Up to this epoch the approaches of winter are doubtful; it arrives about the middle of November, although snows and brief freezes often occur long before that date."
Since the writer says, "it is called the Indian Summer", obviously one could argue that term would have had to been used before him and became popular, but by whom, an earlier explorer or possibly an Indian tribe?

Now, after looking at all of this, the question you might ask yourself is, "Does the term 'Indian Summer' really have anything to do with Indians?" Again, there is host of possibilities, read on...

One explanation of the term "Indian Summer" might be that the early native Indians chose that time of year as their hunting season. This seems reasonable seeing the fall months are still considered the main hunting season for several animals. Also, the mild and hazy weather encourages the animals out, and the haziness of the air gives the hunter the advantage to sneak up on its prey without being detected. Taking this idea one step further, Indians at that time were known to have set fires to prairie grass, underbrush and woods to accentuate the hazy, smokey conditions. But Albert Matthews pointed out that the Indians also did this at other times of the year. Other possibilities include; the Indians made use of the dry, hazy weather to attack the whites before the hard winter set in; that this was the season of the Indian harvest; or, that the predominant southwest winds that accompanied the Indian Summer period were regarded by the Indians as a favor or "blessing" from a "god" in the desert Southwest. Another idea, of a more prejudicial origin, was that possibly the earliest English immigrants equated Indian Summer to "fools" Summer, given the reliability of the resulting weather. Finally, another hypothesis, not at all in the American Indian "camp" of theories, was put forward by an author by the name of H. E. Ware, who noted that ships at that time traversing the Indian Ocean loaded up their cargo the most during the "Indian Summer", or fair weather season. Several ships actually had an "I.S." on their hull at the load level thought safe during the Indian Summer.

In any event, there are several theories or possibilities of the explanation and origin of the term "Indian Summer", yet no one theory has actually been proven. Given the fact it has been centuries since the term first appeared, it will probably rest with its originators. All in all, even with the variety of opinions on this weather (or seasonal) phenomenon, the most popular belief of Indian Summer is as follows...It is an abnormally warm and dry weather period, varying in length, that comes in the autumn time of the year, usually in October or November, and only after the first killing frost/freeze. There may be several occurrences of Indian Summer in a fall season or none at all.

Since Indian Summers are fairly common, it would be interesting to find out if there is any correlation between the years that had no Indian Summer (in a particular area) and the type of winter weather that followed. Oh well, possibly another time and another article but enjoy the Indian Summer while its around, because one thing is for certain, it never lasts!

Making weather fun while we all learn,
Bill Deedler -SEMI_WeatherHistorian


Sep 19, 2016

Sunday, September 25th - the 75TH Anniversary of One the More Unusual and Intense Weather Phenomenas Ever to Hit the Great Lakes

 Hurricanes in Michigan??? Along with...Hurroncane!


Originally written September 1999 & Updated September 2004/2012/2013 (and now with more reanalysis information, 2016).

This upcoming Sunday is the 75th anniversary of one of the most unusual and intense wind storms ever to hit Southeast Lower Michigan. Well over seven decades ago on September 25th, 1941; the remnants of a tropical storm hit the region. This storm was not that usual being in that the remnants of tropical systems do occasionally make it up to the Great Lakes region. But, the coming together of all the meteorological components made for this Astonishing Storm of September 25th, 1941

At first glance, when one reads that headline, one might say, "What? Hurricanes here in the Great Lakes?? No way!" Of course you'd be right, no actual hurricane has ever been observed in Michigan under the true definition of a hurricane. The definition of a hurricane, according to the Glossary of Weather and Climate edited by Ira W. Geer, is as follows: "A severe tropical cyclone with maximum 1-minute sustained surface wind speed greater than 64 knots (74 mph) in the North Atlantic Ocean, Caribbean Sea, Gulf of Mexico and the Eastern North Pacific off the west coast of Mexico to the International Dateline. West of the Dateline they are known as typhoons." Furthermore, the definition of a tropical cyclone is as follows: "A generic term for a non-frontal synoptic-scale cyclone originating over the tropical or subtropical waters with organized convection and a definite cyclonic surface wind circulation." Clearly, neither definition applies in the Great Lakes area, although remnants of hurricanes that have become extra-tropical (loses its tropical characteristics) occasionally do make their way into the Great Lakes region.

Scanning over 80 years (since 1921) worth of hurricane track data suggests that remnants of a hurricane or tropical storm make their way into the Great Lakes region on an average of twice a decade, especially the southern Great Lakes area (see Table-1). Also, in the majority of instances, by the time they visit this region they have diminished to an area of rain with maybe some squally winds. There have been a few instances, along the way, however, that do bear mentioning, and ONE STORM in particular that screams for attention!

TABLE - 1

REMNANTS OF TROPICAL STORMS THAT HAVE AFFECTED THE GREAT LAKES AND SOUTHEAST LOWER MICHIGAN (SINCE 1921)
DATE (Storm's life cycle)
DETROIT RAINFALL/DATES (Inches)
MAXIMUM WIND (mph)

10/16-19 1923
.55 - 10/18
SE - 22

7/20-8/2 1926
1.11 - 8/1
E - 25

8/27-9/3 1932
2.95 - 9/3-4
NE - 21

9/10-22 1938
.23 - 9/21-22
SW - 20

9/16-25 1941
Trace - 9/25
SW - 52 *

9/1-6 1948
.82 - 9/6-8
N - 25

9/27-10/6 1949
1.30 - 10/6-7
SW - 21
Connie -
8/1-8/14 1955
.69 - 8/13-14
W - 20
TD ** -
6/22-6/28 1960
.31 - 6/28
SW - 23
Carla -
9/3-9/15 1961
.13 - 6/14
W - 29
Candy -
6/22-26 1968
2.55 - 6/24-26
NE - 30
Hugo -
9/10-24 1989
Trace - 9/22-23
NW - 38
Opal -
9/27-10/6 1995
1.41 - 10/5-6
N - 38
Fran -
8/23-9/8 1996
.99 - 9/7
NW - 25
Isabel -
9/6-9/19 2003
0.25 - 9/18-19 #
W - 33
      Ike - 9/1-9/15 2008                                 3.78 - 9/13-14                                        N - 43

* denotes officially at Detroit City Airport, but gusts were clocked up to 75 mph across the Metro Detroit area.
** TD - Tropical Storm
# Up to 2.50" reported along the St. Clair River

>>Note; Hurricane Sandy's path /2012/ did not pass over/near Southeast Lower Michigan<<

First off, under the "mention" category in 1932 (well before hurricanes were named), a hurricane that developed in the Caribbean on August 27th, tracked northwest into the Gulf of Mexico, then generally north, across Alabama, eastern Arkansas, southeast Missouri, into southern Illinois and then from there, headed northeast across Indiana into Southeast Lower Michigan. The storm approached Southeast Lower Michigan late on September 3rd. A light to moderate northeast wind proceeded the storm on the 2nd and 3rd averaging around 11 mph with gusts into the lower 20s, hardly anything noteworthy wind-wise. The storm did however, pass right over Detroit, causing the barometric pressure to fall from around 30.20 inches early on the 2nd to around 29.60 late on the 3rd. Rain began to fall lightly but steadily early in the morning on the 3rd, but from mid afternoon into the evening, moderate to heavy rain fell and by midnight, over two and a half (2.55) inches was dumped on the Detroit area. Close to an additional half inch or so of rain was added to that on the 4th for a total of nearly three inches.

Another "mentionable" was odd from the start because of its timing, occurring very early in the season during late June of 1968 (only one other June system was found since 1921 to have affected the Great Lakes: the weak remnants of a tropical storm that moved from the Gulf of Mexico to near Chicago, June 22-28th, 1960). On June 22, 1968, Tropical Storm Candy formed off the coast of eastern Mexico and then headed north into southeast Texas, just north of Corpus Christi. She then weakened, headed north-northeast through eastern Texas and Oklahoma, central Missouri and Illinois, then she pivoted on a more easterly track across northern Indiana into extreme northwest Ohio, over Toledo. Candy began to influence Southeast Lower Michigan's weather on the morning of the 25th. A nearly steady rain, interspersed with a few thunderstorms, continued through the day and evening, depositing nearly two and a quarter (2.17) inches. More scattered, lighter showers fell on the 26th, adding another .38 to give a grand total of 2.55. Through it all, an east to northeast wind blew averaging 10 to 14 mph with gusts into the 20 to 30 mph range.

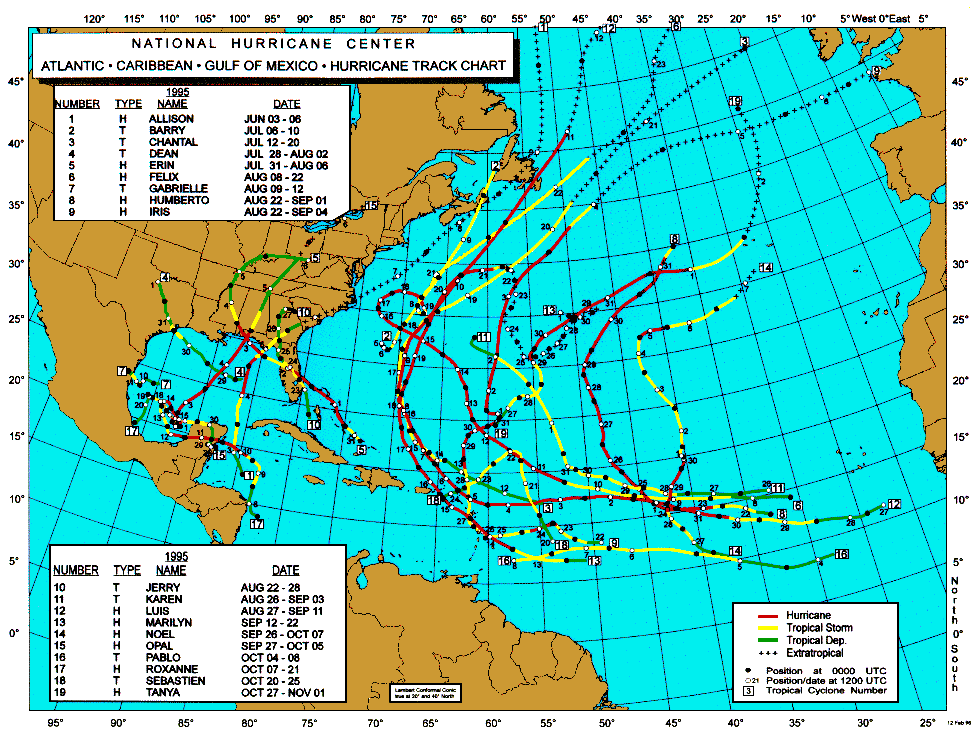
A more recent storm (and last under the mentionable category) was fairly impressive as it wound its way north out of the Gulf of Mexico, through Alabama, Tennessee, Kentucky and into Northern Ohio. She was known as Hurricane Opal and had a 10-day life span from September 27th to October 6th, 1995. On the evening of Oct 5th at 8pm, the remnants of Opal were located over the eastern Great Lakes. What was left of the "eye", or center of the storm, was well indicated on the NWS Doppler radar in White Lake (DTX). The radar showed the "eye" over Sandusky, Ohio moving north out over western Lake Erie. Light to moderate rain, with isolated areas of heavy rain, extended from Southeast Lower Michigan east across Southwest Ontario and Northeast Ohio. Spotty light rain first made an appearance in Southeast Lower Michigan earlier in the day, during the forenoon hours. During the afternoon, steadier rainfall developed with the heaviest rain (.54) falling between 5pm and 7pm. The rain ended just after midnight with a total of 1.41 inches falling from the storm. With the approach of the storm on the 5th, a generally north wind picked up and averaged over 15 mph with gusts up into the 30s (peak wind gust was 38 mph)

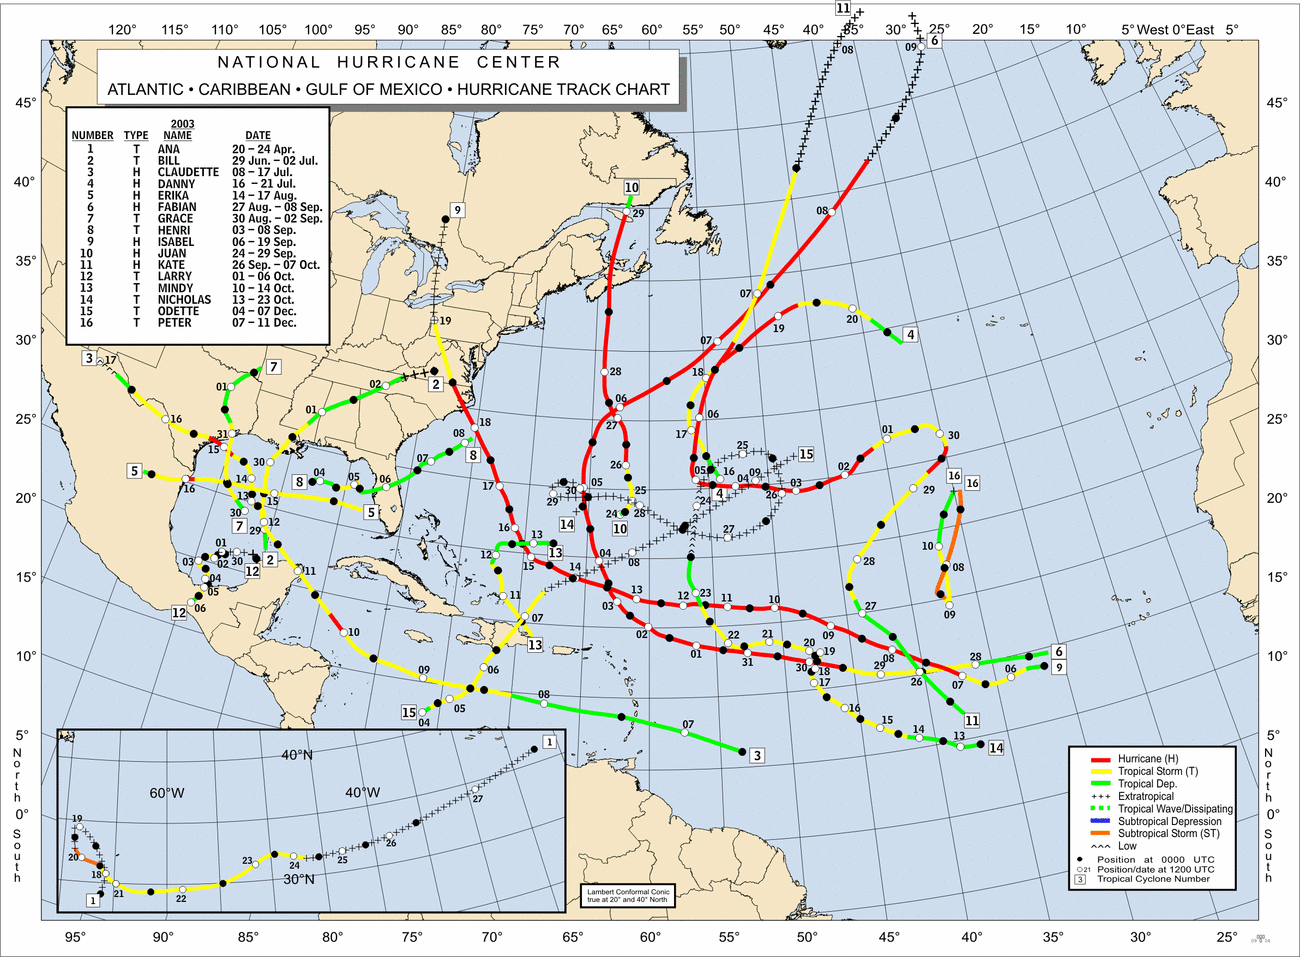
One of the more recent Hurricane remnants to affect the area was Isabel, which moved quickly through the Eastern Great Lakes on September 18-19th, 2003. Rainfall from the system was quite variable ranging from just a trace over far western areas of Southeast Michigan, to as much as 2 1/2 inches at local spots along the St. Clair River. In 2008, remnants of Hurricane Ike brought very heavy rains to the region along with strong winds and a brief F2 over western Wayne County.

The Astonishing Storm of September 25th, 1941

Earlier, I mentioned "one storm that screams for attention", but maybe "howls" would be more appropriate. Before researching this project, I expected to find the above case scenarios, but not the following...

  Recently /2013 changes/ the Hurricane Research Division /HRD/ did a reanalysis of the hurricane and its associated track and wind speeds. *Note the asterisks in the following storm account are adjusted for those changes. (Thanks to Hoosier, moderator of American Weather for the heads up on the reanalysis)
   
* The storm made landfall in Texas as a category 3

* After moving onshore and through its entire remaining path, the storm was upgraded by maintaining tropical force winds as she evolved from a tropical storm to extra-tropical.. Also note the shifted, slightly westward track depicted over upper Ohio Valley and Lower Great Lakes in Indiana and Michigan.

Comparing the two tracks;

Original


  Reanalyzed


A tropical storm (#2 on original analysis map & #17-under 19-21, unseen on reanalyzed) formed in mid September over the Gulf of Mexico on September 17th, 1941. As it formed it meandered over the Gulf, making a loop in its track, well south of New Orleans. By this time it was a hurricane, intensifying briefly to a category #3 storm (111-130 mph wind) offshore as it took aim on eastern Texas. The hurricane made landfall late on the 23rd near Freeport, Texas with an estimated wind of a category #3* (111-130 mph), extremely high tides of nearly 11 feet and a barometer reading of 28.31 inches (959 MB). Further to the northeast, a ship just offshore of Texas City recorded a lowest pressure of 28.66 inches and winds of 83 mph. Other wind gusts were estimated near 100 mph at several locations near the hurricane's center along the Texas Gulf Coast. The hurricane quickly weakened to a category #1 (74-95 mph) as it made landfall and by the time the storm pushed on north to Houston, wind gusts had already dropped to 75 mph. Four lives were lost from the storm in Texas and property damage was estimated at $6.5 million (1941 dollars).

The storm continued to roar on its northward path through Texas and by 7 am on the 24th, it was located near the city of Tyler, over extreme northeast Texas. From this point on, the storm's last 36 hours or so really grabs ones interest for peculiarity as it tracked through the Mississippi Valley and on into the Great Lakes. From 7AM on the 24th to 7am the 25th, the storm shot northeast from Tyler to near Battle Creek, Michigan, covering close to 1000 miles in 24 hours! Thus, the forward movement of the remnants of the hurricane averaged 40 to 45 mph as it approached Southern Lower Michigan. As the storm tracked into the Great Lakes, it merged with a fairly strong cold front that pushed across the upper Midwest into the Lakes. The combination of the strong push of cool fall air, strong upper level dynamics and the remnants of the hurricane created quite a storm (not unlike the more common intense late fall cyclones that are seen in the Great Lakes). In addition, the track and speed of our "hurricane" brings to mind that of the "Panhandle Low" type of low pressure system in the winter (more information). While the speed of the system was fairly quick, it's not uncommon for hurricanes to accelerate northeast as they become extra-tropical and get "picked up" by the mid-latitude upper winds or jet stream. Yet, what was really unusual and noteworthy was the surface wind that accompanied the storm as it moved through the Great Lakes. By the time hurricanes make it this far north, they usually have blown themselves out, at least to the extent that surface winds are only gusting to, at best, 30 or 40 mph. Note the following, taken from the Detroit weather records on September 25th, 1941:

Windstorm: An intense tropical cyclone moving up from the Gulf thru eastern Texas (causing great damage in Texas), along the Missip. Valley and thence Newd across Ill & Mich, passing W & NW of Detroit with gale force winds and gusts to 65 mph from 10:18 AM - 2:30 PM & gusts to 75 mph 12:30 PM - 2:00 PM (see envelope back of book for newspaper clippings).

Most of the above noted news clippings show widespread wind damage to trees and power lines that would be commonplace in severe thunderstorms or a derecho. A derecho is a widespread windstorm consisting of a complex of thunderstorms that develop into a long-lived squall line. But there also were some unusual or freakish happenings (as the Detroit Free Press deemed them) as well. The following is taken September 26th, 1941, the day after, from the Detroit Free Press about the storm:

"River goes dry"

There were many freakish effects of the wind, including baring of the
Detroit River "middle grounds" off Belle Isle when water was backed into Lake St. Clair. The southwest gale literally blew the water out of The Detroit River, reducing its level by three feet, and leaving hundreds of pleasure craft high and dry on the muddy bottom. Several yachts broke their mooring or were heeled over at the Detroit Yacht Club. Another odd effect was the noticeable swaying of Downtown skyscrapers as the full force of the gale struck. Office employees who left tall downtown skyscrapers, were later reassured by engineers.

The Free Press goes on to say that "shortly after noon, the wind blew steadily at 56 miles an hour, but a times gusts reached hurricane velocity of 75 miles an hour." Dozens of people were injured by falling glass from windows blown out or debris tossed by the wind. One woman was literally blown into a fire hydrant, suffering a possible skull fracture. Other reports of scattered damage to homes and businesses across the region were mentioned in the article. In addition, the fierce wind churned up giant waves on the Lakes, including Lake Huron into the St. Clair River where two barges were blown ashore from of the shipping channel, even after dropping their heaviest anchors. In Southeast Lower Michigan, Storm Warnings were posted on Lakes Huron, Erie and St Clair at 10:30, the morning of the 25th. Downed telephone lines caused a disruption of service and communication across the Great Lakes and elsewhere. The "dying" hurricane left a trail of damage from Texas clear up into the Great Lakes and Canada. The wind of the storm was equated to an intense fall low pressure system that hit the area on November 29th, 1919 in which the wind blew 67 mph in Detroit and to the "Black Friday" storm in November of 1913.

The fact that the remnants of the hurricane, after weakening and becoming extra-tropical, traveled over a thousand miles, while sustaining an impressive amount of wind itself was very noteworthy. This, and the important addition of a relatively strong polar front traveling southeast at the same time across the Midwest, made for quite the enhancement and gave the additional punch and life to the storm's "tropical" characteristics. The surface map for the morning of the 25th is available (first and second map, below) and  depict quite nicely our extra-tropical storm racing northeast. This, combined with a rather potent cold front pushing southeast out of the Midwest, wrapped-up into the storm of tropical origins! This type of strong interaction is more likely observed on the East Coast. I inverted and then, enlarged the shading so the data could be seen better (click on all maps).


Being it was 1941, no upper air data/maps are available from the original time but a reanalysis of the day shows some interesting items (click on all maps). Note the strong (for the time of year) 500H /18kft/ trough digging into the upper Midwest. The 500H anomaly map below that map, depicts this nicely - the potency, depth and generally out of character of the trough for late September- very well. The last two maps are the Meridional (north/south) average wind at 500H and 850H /5kft/. Note the max-cores (depicted in meters/sec) over the eastern Lakes that is shown and the large upper trough over the Midwest at these levels in the 24 hour average (remembering that this is a reanalysis for the entire 24hour period - and thus, the average).


As the storm moved into Southern Lower Michigan, its center tracked northeast across Battle Creek, Lansing, Saginaw and then out over Lake Huron and into Ontario. Judging by the lowest pressure readings at Detroit (29.25 inches) and Flint (29.17 inches), where the wind gusted to 69 mph, its central pressure was estimated to around 29.10 inches (about 985 MB). Quite impressive for the remnants of a "dying" hurricane in the Great Lakes in September. In fact, this is the second lowest pressure reading ever recorded in Detroit during the month of September (the first being 29.21 inches on Sep 29th, 1966, during the passage of an intense early fall low pressure system).

One can only make a random guess as to the chances of another hurricane-force wind storm, from remnants of an actual hurricane, hitting the Great Lakes again. Since it was the only one of its kind in the record books at Detroit since records began in 1870, it may take several 100 years before another similar storm affects the region!

Hurroncane

One final, extremely interesting "hurricane" that affected the Great Lakes must be mentioned to make this article complete. While this storm was not from remnants of a tropical system, its development over Lake Huron had many uncanny likenesses to tropical systems...

The first likeness was its timing, forming over the Great Lakes right at the height of the typical hurricane season, September 11-15th, 1996. What started as a typical core-cold 500 MB low pressure system evolved into a warm-core system as it settled over the relatively warm waters of the Great Lakes, in particular, Lake Huron. The low pressure system actually had moved past Lake Huron but then retrograded, or was "drawn back", to the relatively warm waters of Lake Huron. (Similar to the tropics, the Great Lakes usually reach their warmest water temperatures late August into mid September.) The storm then deepened and intensified at the lower levels of the atmosphere compared to aloft, typical of a warm-core low. It is believed that the warm waters of Lake Huron and associated low level instability over the lake were, to a large extent, the major contributing factors in this storm's evolution. The storm went on to form a broad cyclonic circulation, including the "spiral bands and eye", typically seen in hurricanes! At one point, the cyclone produced tropical storm force winds (39 - 73 mph) and some of the spiral bands even had rainfall exceeding 10 cm (better than four inches), causing some flooding.

On satellite, the storm looked very much like the classic hurricane picture:


This "Hurroncane" reached its maximum intensity during the day on September 14th, when a central pressure of 29.34 inches (993 MB) was recorded in the late morning by a Lake Huron buoy that fortunately was positioned, at one point, in the "eye". By 2 PM, that "eye" measured close to 20 miles across and had a ring of tall convective clouds surrounding it, strongly resembling that of an "eye wall". The convective showers encircled the "eye" well out over 300 miles. As the "eye" moved to the southwest (retrograded), over the aforementioned buoy, the surface wind backed from west at close to 35 mph to the southeast, and then diminished to near 10 mph. After, the "eye" continued to track to the southwest, away from the buoy, and the surface wind backed further to the northeast, and briefly attained tropical storm force. A similar scenario but with varying wind speeds, would also be expected at the ocean's surface if a tropical system retrograded from northeast to the southwest overhead. In addition, the air temperature rose from 13°C (55°F) in the spiral shower bands, to near 18°C (64°F), which was also the lake temperature, in the clearing above the "eye". The storm weakened overnight as the lake temperature dropped 5°C (9°F). The lower water temperature helped greatly in weakening the storm as a result of the lower latent heat supply.

For additional information on hurricanes, check in with the
National Hurricane Center.

Background on "Hurroncane" was provided by a paper entitled "Hurricane Huron" by Mr. Todd Miner of Pennsylvania State University along with Dr. Peter Sousounis, Dr. Greg Mann and Mr. James Wallman of the University of Michigan.


Making weather fun while we all learn,
Bill Deedler - SEMI_WeatherHistorian


Sep 7, 2016

Hot and Sultry Summer Leads the Pack at Detroit While Being Fickle With Rainfall Across The Region! Also, A Peek into the Autumn

The Summer of 2016 goes down as the hottest in Metro Detroit's history; third hottest at Flint and 12th hottest at Saginaw. At the NWS White Lake office; Summer of '16 didn't beat any of the hotter summers in the 20 year record. Why the variance? I get to that down further under "Digging Below the Surface". But let's first look at where the three climate stations placed along with the NWS in White Lake, which has records back to 1995 (with first full year 1996, 20 years).

Detroit's summer average of 74.9 just eked-out a new record hottest summer. Looking at the data this was primarily because of the warmer overnight lows rather than the high temperatures or number of 90 degree days (record 39 as opposed to this summer's 21 as of 9/6/16). The warmer overnight lows were mainly due to the higher dew points and humidity along with the heat island affect when compared to drier summers. As an example; the Summer of 1988 is a prime candidate of a hot, miserable but dry summer. The dominant air masses were drier than this past summer and thus, lower dew points and therefore lower overnight lows. Though there were 39 days the thermometer reached 90 degrees of higher in 1988 - and five of those 100 or higher; the summer temperature average still was lower than this summer. Not because of the average high temperatures but because of the cooler overnight lows. In addition; at that time, there was just the beginnings of a heat island development at DTW (I worked at DTW most of the period between 1974-1996). The dominant air masses were generally drier than this past summer and thus, lower dew points and subsequent overnight lows.

Update
Detroit talled up 21 days of 90 degrees or higher during the summer months. Another was added on 9/6//16  for a total of 22 for the warm season thus far. Flint reached 33 days of 90 degrees or better in the summer; while Saginaw had the lowest of 8 (however, again here one was added 9/6/16 for a total of 9 for the warm season).

SUMMER 2016 STATISTICS FOR SOUTHEAST LOWER MICHIGAN


*Top warmest back thru 1996 not available for White Lake therefore; an estimate compared to recent warmest years in Southeast Lower Michigan.

*DTX   Summer ave temp   Year
    1-             70.5               2005
    2-             70.3               2010
    3-             69.5               2011
    4-             69.2               2012
    5-             68.6               2016 


From NWS DTX


DIGGING BELOW THE SURFACE 

As usual the Detroit statistics are skewed upward due to the heat island influence and is especially noted with overnight temperatures - and logically so. While at NWS White Lake; we did an in-house study of the heat island change at Detroit Metro Arpt.several years back and an estimated 2-3 degree overnight low increase was noted when you compared DTW's older non-influenced heat island climate with its present day. Daily high temperatures departures compared to the early data, averaged less than lows at about 1/2 to 1 degree above. This even becomes more pronounced with a prevailing wind off the Detroit city and near suburban area  (generally North-East-Southeast) and especially during the colder winter months. This continues to influence ongoing norms with normal data from 1980-2010. It is estimated that the heat island began to influence Detroit's normal's during the 1980s (a fellow co-worker did a paper on the change back in the late 80s or 90s). It was not surprising with this summer's heat that Detroit's temperature average would be skewed up some by the urban heat island - but what about Flint?


Taking all the data /including DTX/ into account gives an average temperature for Southeast Lower Michigan of 72.3. Since there is no normal for DTX, we'll stick with the three climate station average; which actually raises the Southeast Lower Michigan average to 73.5 compared with the normal average 69.8 or 3.7 above normal. As you can't miss in the data; there is quite a large variance and discrepancy between Detroit's & Saginaw's  departures relating to Flint's. Both Detroit's and Saginaw's departure average are in line - about 3.0 degrees - above normal whereas Flint's is a huge 5.2 above. Also, consider Saginaw only ranked in at 12 warmest and looking at DTX's data, White Lake never even placed in the top 4 warmest going back the past 16 years- it placed 5th by my estimate above. Both stations are closer to Flint but there are other coops near FNT arprt to compare.

All three climate stations have placed in the top 20 warmest summers since 2000, several times. As far as I know there is little if any heat island out at Flint Bishop arprt - and certainly not one that would account for a 2.0 + degree higher departure than Detroit - even with its heat island, and Saginaw. Saginaw airport /MBS/ is located at Freeland, far from downtown Saginaw, so a heat island there should be negligible. In fact, when the in-house study was done at.DTX, Flint averages changed little since the airport began /1942/; negating any heat island up until the time of the study and Saginaw's actually fell a bit. I assume that could be because the Saginaw station may have been moved from downtown Saginaw to Freeland, out in the country.

Comparing the number of 90 degree days each station reported is even more telling.
Detroit reported  21 days during the summer. Detroit's normal is around 10 -12 /10.3 - being listed in the latest LCD/. Saginaw reported 8 in the summer /normal is 6/ while Flint reported a whopping 33 /normal is 6.3/! Twelve more 90 days that Detroit and that's even with its established heat island and 25 more 90 degree days than Saginaw! It is my understanding; DTX knows of the questionable Flint ASOS site temperature issue and is working on the problem.


The following are area maps for the upper Midwest and Great Lakes; therefore they are smoothed and may not reflect the actual data reported at a particular location.

Rainfall

While mom nature was very generous with the heat, she was more fickle with the rainfall. Most areas saw normal to below normal rainfall but there were still notable areas of normal to above. Areas on the map below that are yellow and green received normal to below normal rainfall. In addition, areas in the yellow to beige received normal to locally above normal. 


The map below shows the areas of above, below and normal rainfall departures. There were some "stripes" of above normal rainfall extending from the Saginaw Valley (including Saginaw) into the Thumb Region, across the far northern suburbs of Detroit and along the eastern areas of metro Detroit and extending into its northeast suburbs. Some isolated areas received upwards of 2 - 4"+ above normal.

The majority of the region received normal to below normal rainfall. Most notable was around much of the remainder of extreme Southeast Lower Michigan (including DTW), portions of \Detroit's west and immediate north suburbs and up across much of Genesse (including FNT) and eastern Shiawassee County.
And, just like the above normal departures, some areas measured 2 - 4"+ below normal.  


Departures


This is the rainfall for the month of August for the entire country. Note the heavier rains that fell in Southern Lower Michigan into Northern Indiana. Of course the most notable rainfall that caused all the flooding in and around Louisiana can be seen with the bulls-eye of 20"+


OUTLOOK FOR SOUTHEAST LOWER MICHIGAN THIS FALL

Since the ENSO temps are just slightly below normal indicating a neutral to weak La Nina; I would suspect little if any effect on our fall. Other more typical hemispheric patterns should govern our autumn. In any event; weak La Nina falls generally are rather pleasant across Southeast Lower Michigan but with killing frosts and freezes still coming at their normal or average times - mid to late October. Precipitation generally is normal to below. Here are the latest computer generated Outlooks for the country.


 Model continues a weak La Nina to almost neutral which would have almost negligible effects on the fall.

 Later in September; will look at the Updated Summer Outlook  and the actual Summer statistics


 Making weather fun while we all learn, 
Bill Deedler -SEMI_WeatherHistorian

Sep 1, 2016

Hot and Sultry Summer Over Southeast Lower Michigan Leads the Pack in Metro Detroit While Being Fickle With Rainfall

It was a hot and sultry summer across Southeast Lower Michigan while Mother Nature was Fickle and very variable with rainfall!

*Detroit placed in at first place for hottest summer at an average of /74.9/, while Flint checked in at 3rd hottest /73.8/ and Saginaw at a distant 12th /71.8/.

*Because of a wet August; no climate location ended up on the driest summer list. Detroit had 8.49" /-1.40"/...Flint 7.32" /-2.25"/ while Saginaw received much more at 11.08" /+2.21"/ and actually placed in at the 17th wettest Summer.

*All summer data is preliminary

We'll look at the Summer of '16 and I'll dig deeper into this summer's weather stats in my Summer Review and compare to my original/updated Summer Outlook coming up soon in early September. In addition; what does the Autumn look like?

Previous September Flood Story

30th Anniversary of the Great 1986 Flood in Southeast Lower Michigan

It seems you can't look at weather headlines across the US without seeing notable flooding this past year and especially this summer somewhere - with portions of the deep south hit hard. Think it can never happen here; think again! It's been 30 years since a major flood hit much of Central and East-Central Lower Michigan into the Thumb on September 10-12th, 1986. While the Detroit Metro area was not hit hard like the other regions mentioned above and below, September of  '86 was very wet across the entire area with it still remaining the wettest September on record.

Let's take a look back at that Great Flood of 86, one of the earliest articles I originally wrote while employed by the NWS - DTX...

September, being somewhat of a transition month between summer and fall, generally brings a taming of the summer heat and thunderstorms. Normal rainfall amounts drop off from the summer maximum and the weather, more often than not, goes into more of a tranquil period before the fall storms begin to rage. But this was not the case on September 10-12th, 1986 in Central Lower Michigan into the "Thumb Region" of Southeast Lower Michigan.

The September 1986 Michigan Flooding was the worst flood disaster in 50 years and would not be exceeded until the August 2014 Metro Detroit Flood. Total damage was estimated between $400 and $500 million, which is between $850 million and $1 billion in 2014 dollars . The August 2014 Metro Detroit Flood would eventually exceed the dollar damage with up to $1.8 billion in flood damage. Of that total, around $120 million ($260 million in 2014 dollars) was crop damage, since the flood came near harvest time. The entire flood area covered generally a 60 mile wide band across the central portion of Lower Michigan. The central axis of the flood area extended from north of Muskegon, near Rothbury, east across all of Central Lower Michigan to near Port Sanilac, in Southeast Lower Michigan's "Thumb Region". Some major cities in Southeast Lower Michigan affected by the flood included Saginaw, Bay City and Midland. It is interesting to note that the city of Flint actually experienced more severe flooding in September 1985 than it did in September 1986.

Several estimates about the likelihood of such a flood like the one in 1986 were tossed about such as a "100 year flood" or a "500 year flood". But to the people of the flood stricken area it is known as "The Flood"! A number of rain events plagued this area through September but the main one occurred September 10-12th, 1986. The flooding rains were triggered by a nearly stationary front which, like the flood area itself, stretched east-west across Central Lower Michigan. Warm, moisture-laden air from the Gulf of Mexico (enhanced by a moisture plume from remnants of a tropical system over the Eastern Pacific), streamed north and east out of the Midwest, across the stationary front into Central Lower Michigan. To the north, cooler, drier air remained entrenched over Upper Michigan. The upper wind pattern across the Great Lakes was conducive in holding the surface front nearly in place, resulting only in a slow drift to the north through the entire period. This in turn, caused any available moisture pushing north across the front to be wrung out and dumped persistently over the same general area.

An extensive area of heavy rain and severe thunderstorms with torrential rains developed just north of the front and extended west from Michigan into Wisconsin. As the moisture from the south overran the front and fell as heavy rain over Central Lower Michigan, it also traversed the same area from west to east during the two day period. This process of precipitation developing and repeatedly moving over the same area is known all too well by meteorologists and hydrologists as "train-echoing". This was the primary mechanism for the persistent heavy rainfall during this particular flood event.

The rain began late Tuesday night, September 9th, over West-Central Lower Michigan and steadily moved east across Central Lower Michigan and into the "Thumb Region" of Southeast Lower Michigan overnight. Rainfall during the September 10-12th period over Central Lower Michigan averaged an incredible 6 to 12 inches, with even isolated reports of up to 14 inches. Much of this deluge fell in a 12 hour period on the 11th. The table below has the rainfall amounts for selected observation points across Southeast Lower Michigan. The September 1986 rainfall ranks as the wettest month on record for Saginaw, the 3rd wettest month for Flint and the 11th wettest month for Detroit

City
Rainfall from Sept. 10th to 12th 1986
Rainfall for September 1986
Midland 11.78 18.35
MBS 10.09 16.16
Saginaw 10.50 16.06
Essexville 10.67 15.86
Caro 11.51 18.16
Millington 10.15 16.24
Cass City 10.97 16.96
Sebewaing 9.71 15.15
Bad Axe 8.48 13.39
Harbor Beach 8.24 14.17
Sandusky 8.75 15.27
Owosso 3.25 10.26
FNT 3.42 10.86
Lapeer 4.24 9.78
Yale 5.81 12.60
Port Huron 2.84 10.26
Pontiac 1.49 6.43
DTW 1.16 7.52

The heaviest band of rain over Southeast Lower Michigan for the two day period extended from the Alma area, east across Saginaw into Vassar. As a result of these monsoon-like rains, several rivers surged over their banks and established record heights (see table below).

River
Flood Stage
Crest  (date)
(old) Record  (date)
Tittabawassee
(Midland)
24
33.89  (9/13/1986)
29.70   (3/28/1916)
Saginaw
(Saginaw)
17
*24.16   (9/15/1986)
*24.90   (3/30/1904)
Pine
(Alma)
8
12.82   (9/12/1986)
10.81   (3/13/1948)
Cass
(Vassar)
14
24.82   (9/12/1986)
20.80   (3/30/1948)
Cass
(Frankenmuth)
17
27.52   (9/12/1986)
22.83   (3/6/1976)
*  Saginaw River at Saginaw did not establish a new record height

The Cass River at Vassar with a flood stage of 14 feet rose to an unprecedented (and almost unbelievable) 24.82 feet, or better than 10 feet above flood stage! This level of nearly 25 feet is even more astonishing, when you consider the normal height of the river is about 4.5 feet. Likewise, the Cass River at Frankenmuth rose to around 10 feet above its flood stage with a 27.52 feet reading (flood stage is 17 feet).

Like many locations in and near rivers and drainage areas, the flooding in the town of Vassar was a nightmare! It was definitely one of the hardest hit areas with all the downtown businesses and about 50 homes being flooded. The flood waters reached to the intersection of Main and Huron St. on the northwest side of the Cass River and extended to the intersection of Huron and East St. on the southeast side. The river rose so quickly and forcefully, that some people barely had enough time to get out. Several people awoke in Vassar to find their streets and cars covered in rushing water as the raging river surrounded their homes and businesses. But further downriver on the Cass, at Frankenmuth, vigorous sand bagging on top of permanent levees protected the downtown area from any serious flooding.

Several people lost their lives either directly or indirectly due to the flood. Looking through newspaper articles and related storm reports, at least 10 people died. The body of a hunter was found on the bank of the Muskegon River, a woman who drove her car off a flooded road into the Cass river, two children playing near flooded streams were swept away, two more people drowned while in boats, falling overboard; and another  two men were electrocuted while using sump pumps in flooded rooms. Sadly, the flood also took its toll on human life in another, devastating way. Two farmers, after seeing all their crops under water, committed suicide. Close to 100 people were injured in the flood.

Across Central Lower Michigan, 22 counties were declared disaster areas. This encompassed nearly 14,000 square miles and where 1.8 million people lived.  Even though damage was estimated between $400 to $500 million (1986 dollars), it hard to put a dollar figure on the huge amount of personal items these people lost and also, the emotional scars some still carry with them. To give an idea the volume of water that fell over Saginaw River basin, it was estimated by the state hydrologist (at that time) that if that water could be drained into Lake St. Clair, it would raise its level 10 feet!  The Bay City Times, in retrospect, summed up "The Flood" well by telling their readers to just scan the "D" listings in the dictionary, "It’s all there, Downpours, Drenching, Devastation and Disaster"!

Two key elements that contribute to flash flooding are rainfall intensity and duration. Other factors that play important roles include soil conditions, topography and ground cover. Flash floods cause more deaths each year in the United States than lightning, tornadoes or hurricanes! In the 30 year period ending 2015, averages of 82 people are killed from flooding. Lightning claims 48 lives per year, tornadoes 70, and hurricanes 46.

From the NWS DTX:

The National Weather service issues Flash Flood and Flood Warnings when flash flooding or flooding is occurring or imminent. Remember the following when you are in a flood situation...

  
Making weather fun while we all learn, 
Bill Deedler -SEMI_WeatherHistorian

Jul 10, 2016

Summer Outlook Update: On the Warmer Side But With Wide-Ranging Rainfalls


Dedicated to Beloved Family Member: Mac: 9/14/98-6/26/16

In my initial Summer Outlook for Southeast Lower Michigan I discussed the changeable, roller coaster type of summer temperatures pattern expected; resulting in temperatures averaging a degree or two above or below normal, depending on the dominant trend. The overall pattern I expected has materialized with the warmer side seemingly winning out.

 From the original Outlook:

"Our best analogues this past winter, 1982-83 and 1997-98 contained normal summer temperatures averaging very close to 72; just a few tenths different from each other. Likewise; I look for the summer to continue to display the more roller-coaster type of temperature pattern (not unlike seen this spring and also dominated, the Spring of '83) with sometimes significantly above, below and everything in-between but ultimately resulting in the normal or typical summer. 
Summarizing: I look for temperatures to average 1 - 2 degrees of the summer norms across Southeast Lower Michigan."

Temperature Update:

Considering prevailing trends thus far this summer; instead of temperatures averaging one or two degrees above or below the norms, I now expect temperatures to average one to three degrees above the norms with warmer than average weather winning out. No other change in the pattern is expected with active, roller-coaster type of pattern earlier to continue to hold.

 
Along with the temperature pattern; it appears the stormier side discussed in previous analogues may be finally becoming more prevalent as the summer moves on and the pattern to the south drifts northward. However; to predict where these convective rains will rule is exceedingly challenging this summer especially since it appears in just short distances vast differences of rainfall have already occurred recently. While this is typical of summer rains anyway, there will likely be even more variable total rainfall because of the exceedingly dry conditions that prevailed in most areas up until this July.

From Original Outlook:

In conclusion: Look for rainfall to average normal to above across the southern half of Southeast Lower Michigan and normal to below across the northern half.

Rainfall Update 

Prevailing and expected pattern the rest of the summer dictates rainfall to contain wide ranging totals due to a drier June into early July. Even if more typical normal or even above normal rains occur; overall rainfall will generally range from below normal to around normal. This was the pattern I was looking for over the northern half of the region in the original Outlook. There may be even some pockets of above normal due to heavy dumping convective rains.


Again narrowing and tightening-up the original summer outlook some; look for the summer to average up to a couple of degrees warmer than normal with below to normal rainfall prevailing across most areas with pockets of above normal.

Enjoy the remainder of the summer!
 

Making weather fun while we all learn,
Bill Deedler -SEMI_WeatherHistorian