![]()
I headlined the Summer Outlook with; Will Variable Spring Weather Lead to a Variable Summer? This has been pretty much the case with the first half (yes officially, the meteorological summer is half way over mid July in spite of Labor Day weekend). Hot with a few notable cool spells, locally damaging storms, heavy flooding rains all intertwined with beautiful, pleasant summer weather.
Summer analogues were quite mixed with rainfalls with dry, wet and one or two near normal rains. Which is why I went exactly what they had: below normal, above normal or normal...depending on location, location, location. Storm and frontal patterns have settled in the lower Great Lakes as air masses vie for dominance. Storm tracks and associated severe weather were a bit slow to materialize but made up for the delay as June unfolded.
After months of below normal precipitation, the dryness of the first half the year was alleviated to a large extent by the heavy rains and storms in June. As discussed; rains for the growing season were later than gardeners and farmers would have liked but their arrival was still very important for the growing season. Many areas got too much of a good thing with rainfalls of 4-6+" of rains by the end of the month and areas of flooding. Average or normal rains for June generally run 3-4", give or take a little. And; as they say; a picture (or two) is worth a thousand words....

Yes, I know it's pretty tiny to read...for us needing coke-bottles>>>
Monthly Totals


Many areas hit with tropical-like rains 25th-27th
Sorry this map doesn't have cities & towns but counties are visible along with close approximations of Junes entire rainfall. It's not surprising to see why some of the newsworthy issues came up across the metro Detroit region; west along the I-94 corridor and northward to I-96 (Jefferies) / M14 region to west into and around Ann Arbor late in the month. Very heavy, tropical like rains deluged that region along a stationary front and low pressure area interacting with a tropical-like air mass. Rainfall totals with 6" to in excess of 8" were reported just in a 3 day period (see the DTX write-up here of the flooding and severe weather with a tornado touch down at Port Austin). This system was mainly responsible for the high rainfall totals of June across much of the region with some locations receiving in excess of ten inches. The very heavy rain areas only increased in size west over South-central and Southwest Lower Michigan.
Rainfall totals for June are smoothed in the first map below, with the second map showing much of the area receiving up to 200-300% of June's normal rainfall total on the Midwest Climate Center maps.


All three meteorological city rainfalls made it into the the top 20 wettest Junes. And; if you look a little longer - you'll see each location has had FIVE Junes thus far; making the wettest Junes list since the turn of the century. Still a little longer scan and you'll note a number of dry Junes have also placed since 2000, three at Detroit and Flint and two at Saginaw. This also reflects the variability found in the analogues but with a notable lean toward wetter. Typical summer rains tend to be feast or famine more so due to the nature of convective rains. | | | ||||||||||||||||||||||||||||||||||||
| Rank | Detroit Area* | Flint Bishop** | Saginaw Area*** | |||||||||||||||||||||||||||||||||||
| Wettest | Driest | Wettest | Driest | Wettest | Driest | |||||||||||||||||||||||||||||||||
| Total | Year | Total | Year | Total | Year | Total | Year | Total | Year | Total | Year | |||||||||||||||||||||||||||
| 1 | 8.31 | 1892 | 0.55 | 1895 | 6.57 | 2009 | 0.63 | 1988 | 10.76 | 2017 | 0.61 | 1988 | ||||||||||||||||||||||||||
| 2 | 7.04 | 1987 | 0.94 | 2011 | 6.52 | 1994 | 0.67 | 2016 | 6.92 | 1996 | 0.64 | 1952 | ||||||||||||||||||||||||||
| 3 | 6.97 | 1902 | 0.97 | 1988 | 6.40 | 2021 | 0.72 | 1995 | 5.82 | 1928 | 0.76 | 1912 | ||||||||||||||||||||||||||
| 4 | 6.97 | 1896 | 1.01 | 1959 | 5.87 | 1949 | 0.79 | 1933 | 5.65 | 2008 | 1.03 | 1927 | ||||||||||||||||||||||||||
| 5 | 6.58 | 1960 | 1.04 | 1984 | 5.58 | 1943 | 0.83 | 2012 | 5.15 | 1967 | 1.19 | 1956 | ||||||||||||||||||||||||||
| 6 | 6.42 | 1980 | 1.06 | 1952 | 5.48 | 2019 | 0.90 | 1952 | 5.09 | 1935 | 1.23 | 1925 | ||||||||||||||||||||||||||
| 7 | 6.32 | 1903 | 1.07 | 2002 | 5.46 | 2015 | 0.92 | 1984 | 5.05 | 2021 | 1.38 | 1918 | ||||||||||||||||||||||||||
| 8 | 6.05 | 1993 | 1.08 | 1904 | 5.40 | 1968 | 1.14 | 1959 | 4.93 | 1917 | 1.39 | 1964 | ||||||||||||||||||||||||||
| 9 | 6.01 | 2013 | 1.19 | 1933 | 5.37 | 1928 | 1.19 | 1932 | 4.92 | 1994 | 1.48 | 1959 | ||||||||||||||||||||||||||
| 10 | 5.90 | 1881 | 1.30 | 2016 | 5.36 | 1967 | 1.25 | 1998 | 4.83 | 1987 | 1.50 | 1991 | ||||||||||||||||||||||||||
| 11 | 5.75 | 1986 | 1.31 | 2012 | 5.31 | 1962 | 1.37 | 1925 | 4.75 | 1915 | 1.53 | 1990 | ||||||||||||||||||||||||||
| 12 | 5.49 | 1920 | 1.35 | 1932 | 5.23 | 1993 | 1.48 | 2002 | 4.71 | 1976 | 1.53 | 1923 | ||||||||||||||||||||||||||
| 13 | 5.46 | 1999 | 1.39 | 1934 | 5.13 | 1986 | 1.54 | 1985 | 4.67 | 1954 | 1.55 | 1997 | ||||||||||||||||||||||||||
| 14 | 5.42 | 2010 | 1.42 | 1913 | 4.90 | 1989 | 1.57 | 1997 | 4.62 | 1948 | 1.57 | 1929 | ||||||||||||||||||||||||||
| 15 | 5.32 | 2015 | 1.46 | 1922 | 4.82 | 1948 | 1.57 | 1934 | 4.56 | 2011 | 1.62 | 1941 | ||||||||||||||||||||||||||
| 16 | 5.27 | 2009 | 1.47 | 1910 | 4.70 | 1977 | 1.60 | 1987 | 4.49 | 2010 | 1.65 | 2006 | ||||||||||||||||||||||||||
| 17 | 5.24 | 1906 | 1.48 | 1911 | 4.68 | 1975 | 1.62 | 1923 | 4.41 | 1943 | 1.70 | 1934 | ||||||||||||||||||||||||||
| 18 | 5.16 | 2021 | 1.51 | 1876 | 4.56 | 1940 | 1.66 | 1978 | 4.37 | 1945 | 1.73 | 1966 | ||||||||||||||||||||||||||
| 19 | 5.15 | 1898 | 1.55 | 1995 | 4.51 | 2013 | 1.66 | 1922 | 4.22 | 1939 | 1.75 | 1963 | ||||||||||||||||||||||||||
| 20 | 4.99 | 1968 | 1.61 | 1956 | 4.44 | 1945 | 1.77 | 1927 | 4.21 | 1940 | 1.77 | 2016 | ||||||||||||||||||||||||||
* Detroit Area precipitation records date back to November 1874.
** Flint Bishop precipitation records date back to January 1921.
*** Saginaw Area precipitation records date back to January 1912.
JUNE TEMPS
June's average temperatures were warm and sultry; warm enough to place in the top 20 warmest Junes at all three locations (Detroit, Flint and Saginaw. Even though warm; that's a bit misleading as the month was also blessed with intermittent, refreshing short cool breaks as the upper jet occasionally shifted to the north as upper lows over eastern Canada pushed cooler air masses into the Lakes Region. Here too; note the number of warmer Junes since 2000; Six at Detroit, four at Flint and five at Saginaw. Curiously; no colder Junes have made the lists since 2000 - except Flint with two. The Flint temperature observations are least affected by urban heat as compared to Detroit.
| Top 20 Coldest/Warmest Junes in Southeast Lower Michigan | ||||||||||||
| Rank | Detroit Area* | Flint Bishop** | Saginaw Area*** | |||||||||
| Coldest | Warmest | Coldest | Warmest | Coldest | Warmest | |||||||
| Temp | Year | Temp | Year | Temp | Year | Temp | Year | Temp | Year | Temp | Year | |
| 1 | 62.8 | 1985 | 74.6 | 1933 | 60.1 | 1969 | 75.0 | 1933 | 60.6 | 1982 | 73.8 | 1933 |
| 2 | 62.8 | 1903 | 74.1 | 2005 | 60.9 | 1958 | 74.9 | 1934 | 61.0 | 1926 | 73.5 | 1919 |
| 3 | 63.1 | 1915 | 74.0 | 1919 | 61.5 | 1980 | 72.1 | 1949 | 61.5 | 1915 | 72.3 | 1971 |
| 4 | 63.4 | 1928 | 73.3 | 1949 | 62.5 | 1985 | 71.7 | 1925 | 61.8 | 1958 | 72.3 | 1934 |
| 5 | 63.4 | 1926 | 73.2 | 1934 | 62.5 | 1972 | 71.5 | 1921 | 61.9 | 1917 | 71.7 | 2005 |
| 6 | 63.4 | 1916 | 72.8 | 2021 | 62.9 | 1982 | 71.4 | 2020 | 62.1 | 1980 | 71.1 | 2021 |
| 7 | 63.6 | 1927 | 72.8 | 1943 | 63.1 | 1977 | 71.3 | 1943 | 62.1 | 1916 | 70.5 | 1976 |
| 8 | 63.7 | 1980 | 72.7 | 1952 | 63.3 | 1960 | 71.2 | 2005 | 62.3 | 1945 | 70.5 | 1931 |
| 9 | 63.7 | 1889 | 72.4 | 1991 | 63.4 | 1928 | 70.3 | 1952 | 62.6 | 1928 | 70.4 | 1949 |
| 10 | 63.8 | 1878 | 72.3 | 2012 | 63.6 | 1945 | 70.3 | 1987 | 62.7 | 1977 | 70.3 | 1967 |
| 11 | 63.9 | 1958 | 72.2 | 1994 | 63.8 | 1927 | 70.3 | 1939 | 62.8 | 1985 | 70.2 | 1932 |
| 12 | 63.9 | 1902 | 71.6 | 1995 | 64.2 | 1992 | 70.1 | 2021 | 63.2 | 1947 | 70.0 | 1995 |
| 13 | 64.1 | 1917 | 71.6 | 1890 | 64.5 | 1947 | 69.8 | 1931 | 63.5 | 1969 | 69.9 | 2007 |
| 14 | 64.2 | 1982 | 71.5 | 2018 | 64.6 | 2003 | 69.8 | 1923 | 63.7 | 1972 | 69.9 | 1923 |
| 15 | 64.2 | 1972 | 71.5 | 1944 | 64.7 | 1961 | 69.7 | 2016 | 63.8 | 1927 | 69.9 | 1930 |
| 16 | 64.4 | 1881 | 71.4 | 2010 | 64.9 | 1986 | 69.7 | 1991 | 64.2 | 1978 | 69.9 | 1921 |
| 17 | 64.6 | 1935 | 71.4 | 1921 | 64.9 | 2009 | 69.6 | 1954 | 64.2 | 1940 | 69.8 | 2012 |
| 18 | 64.6 | 1897 | 71.3 | 2007 | 64.9 | 1974 | 69.6 | 1932 | 64.2 | 1924 | 69.8 | 1987 |
| 19 | 64.7 | 1969 | 71.3 | 1954 | 65.1 | 1978 | 69.5 | 1971 | 64.3 | 1918 | 69.7 | 2014 |
| 20 | 64.8 | 1907 | 71.3 | 1987 | 65.1 | 1948 | 69.5 | 1944 | 64.4 | 1986 | 69.7 | 199 |


What about the rest of the summer? There were a few trends noted in upper air patterns and the analogues in the Outlook possibly reflecting temperature and rainfalls for the rest of the summers.
While I determined the analogues averaged too cool:
From Outlook
Mainly because of the warming the latter quarter of the 20th century into the early 21st century; analogues from earliest periods have been generally discounted or less weighted than the later period analogues. Basically; many of the earlier analogues have been considered too cool for our present warmer period the past several years. However; all analogues are considered for patterns and timing.
Remainder of the summer:
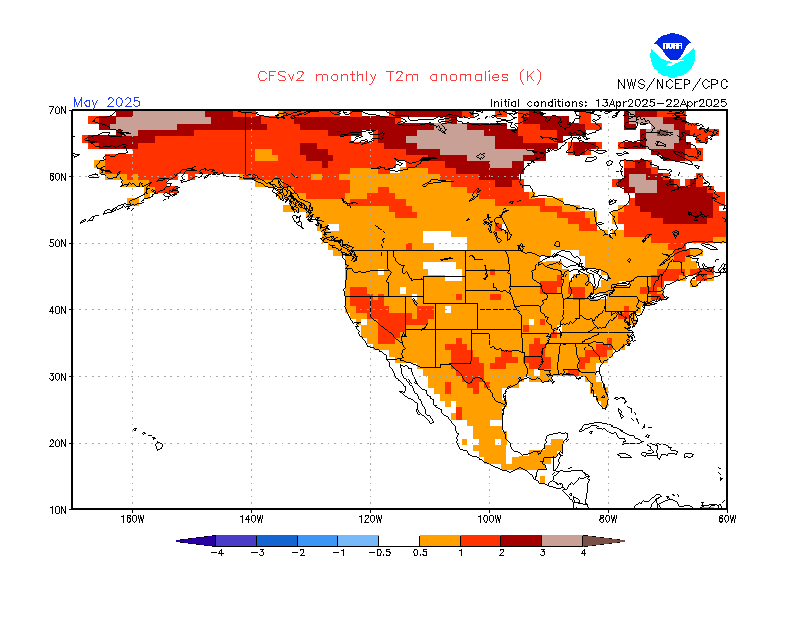
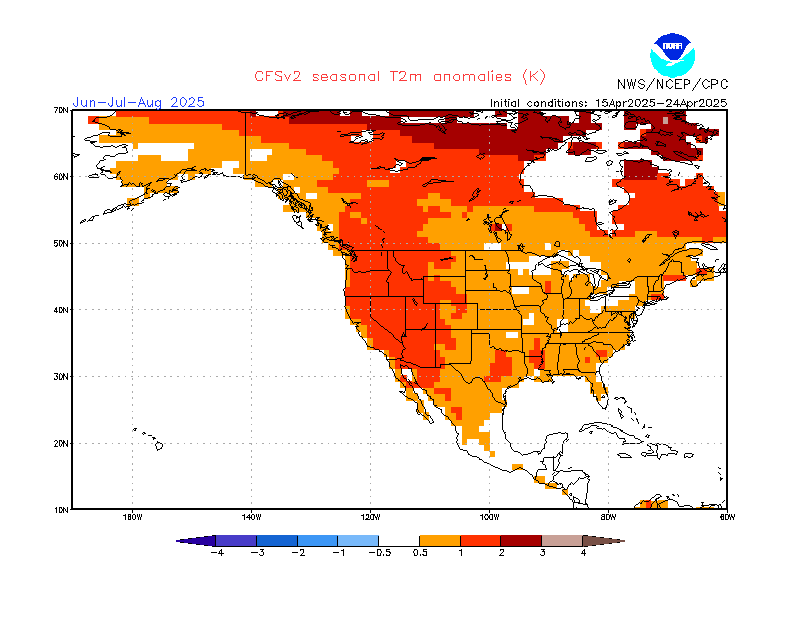
Keeping in the above normal temperature mode for the remainder of the summer along with now; normal to above rainfall. Recent and longer term model patterns do suggest warmer and wetter conditions. However; analogues do suggest a drier month or period anyway is due the second half of the summer. Nearly all analogue summer years had a notable drier period and more likely in the second half of the summer. We'll see.

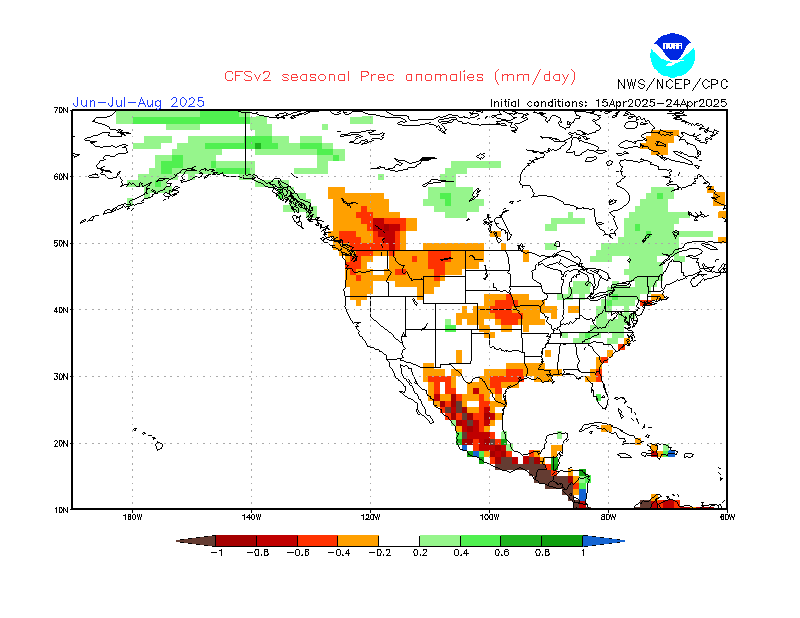
Models:
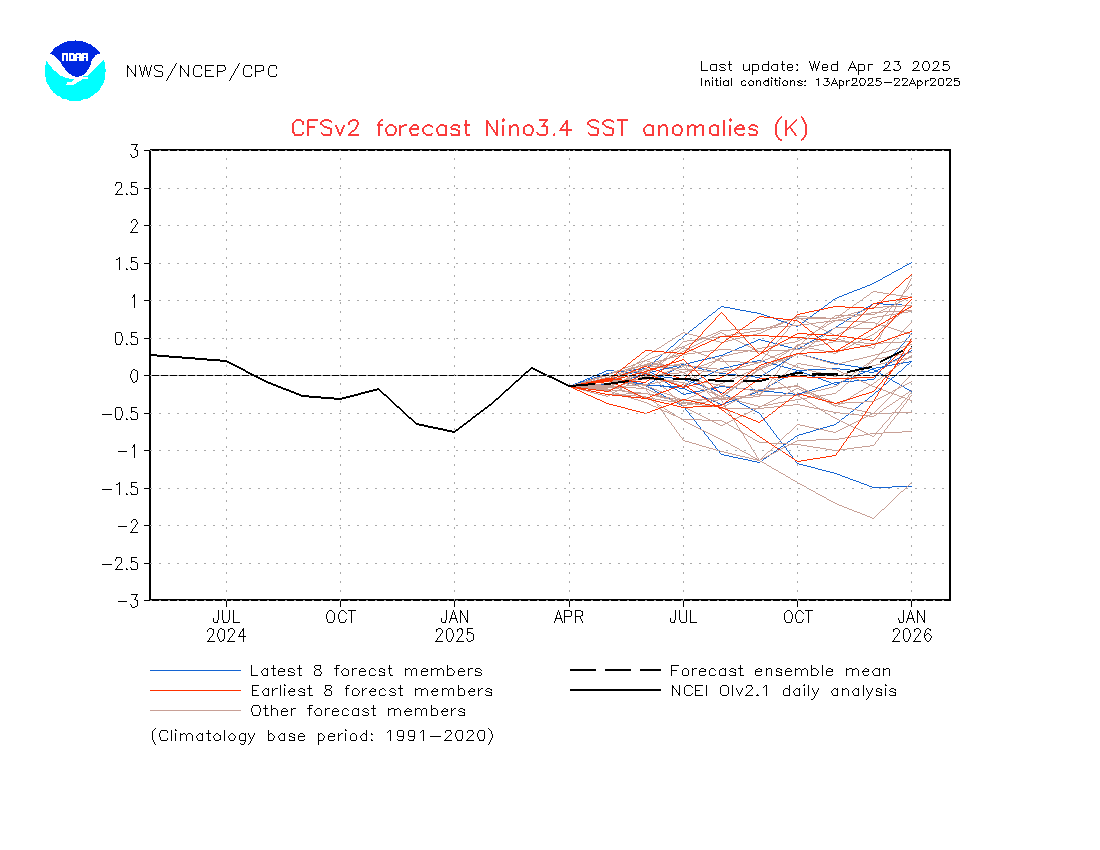
As you can see the CFSv2 displays a "W" type of La Nina(s) from last winter to the up coming autumn into winter 2021-22
TEMPS
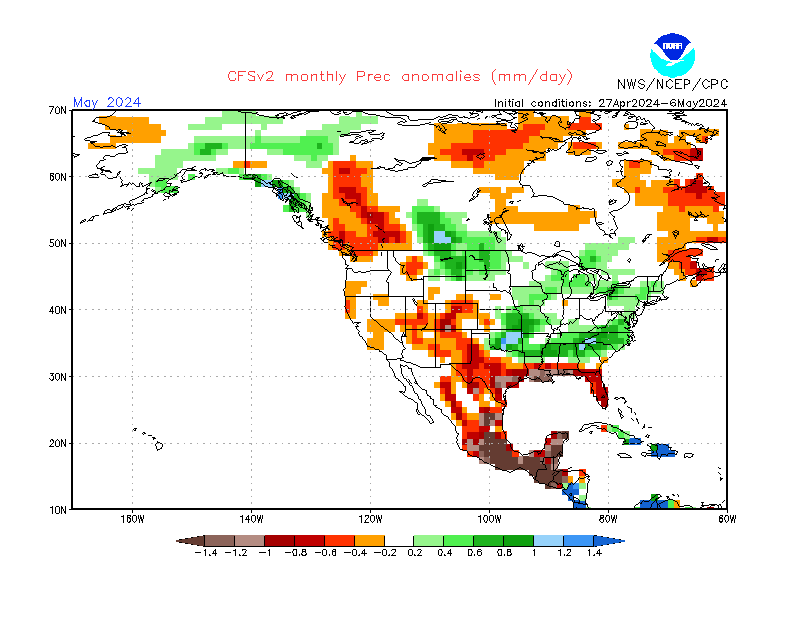
PCPN
It's interesting to note the model catches a non-determinant rainfall forecast for August over Southern Michigan, which is wrapped around with above normal rainfall chances. This loosely reflects the analogue drier periods and is more reflective the natural rhythm of frontal action working northward across the Lakes late summer.
The Outlook for the autumn reflects warmer with lesser precipitation conditions reflective in La Nina falls.
![]()
Taking a trip around the world and interrogating climate models shows a bit lean toward a stronger La Nina for the 2021-22 season. Engaging in that last year, the CFSv2 reflected that view for last year's La Nina.

Milder autumn temperatures are rule across the pond, also.

A drier trend also creeps into the Midwest and continues in parts of the Plains..

Newsworthy weather and other articles will pop-up from time to time on FB and here, on my Weather Historian page. Enjoy the rest of the summer and autumn!