Reflection Back
The inhabitants of Southeast Lower Michigan have experienced one of the nicer, milder winters thus far, especially by way of lack of snow if you are a commuter. Granted there have been a few cases of icy travel but they have been few and far between. Temperatures haven't been bad either with generally, the above normal temperatures of December stretching into the second week of January.
So; what happened to a "good" old fashion cold and snowy winter which
many hoped for this winter? After all; it did look so promising in
November with cold and frequent snows that many were thinking we could
be settling into a long cold winter! Thus far, since December 1st; about a foot below normal snowfall and one of the
most boring extended stretches of weather seen in these parts in some time...there's really been nothing much to write about! Actually, when winter was supposed to really begin - it didn't. The only
real winter weather seen in Southeast Lower Michigan came in November
in regards to both snow and cold.
Generally since the start of climatological winter /Dec/; all of Southeast Lower Michigan is running a foot or so below normal in snowfall. However; the entire seasonal snowfall departure isn't quite as high with the help of November being a snowy month with departures averaging 2-4" across the northern half of Southeast Lower Michigan and worse in the southern half with roughly 7-10" below normal. By the way; a cold and snowy November doesn't necessarily predict that for the winter. Many of the analogues did have below normal temperatures in November along with above normal snows - and the majority of winters were light on the snow.
As of the 10th of January; since the start of the climatological winter /Dec 1st/, temperatures across
Southeast Lower Michigan have averaged in the lower to mid 30s. For
example; Detroit has averaged a relatively mild high of 41 and a low of
28; for a mean of 34.5 through January 10th, 2019. Looking at Flint and
Saginaw reveals similar mild weather with all areas averaging about 5 - 7
degrees above normal thus far.
Average temperature map for Dec 2018
Temperature Departure Dec 1-29, 2018 - entire month N/A.
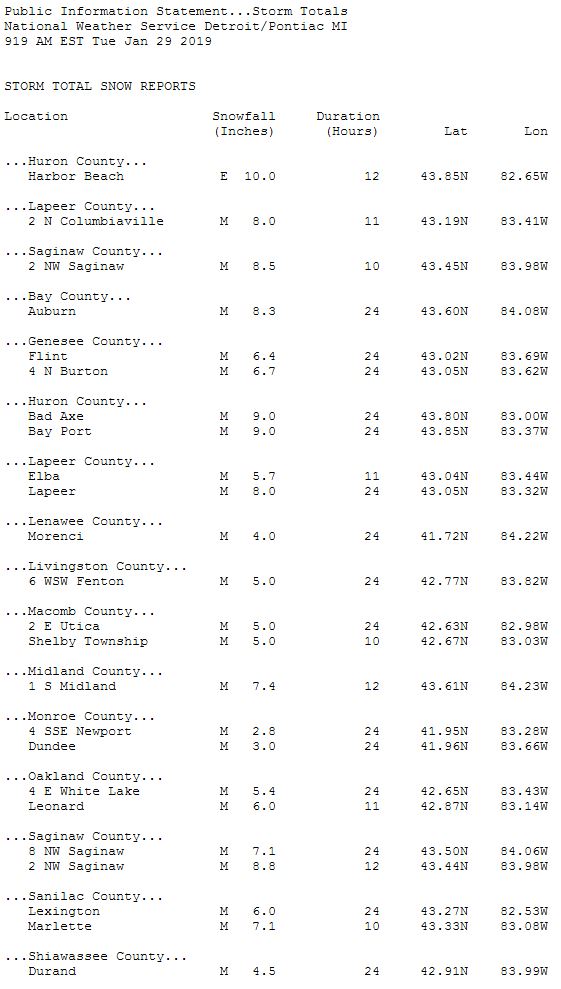
Snowfall thus far this Snow Season thru January 12th of course, has been paltry...
The departure/percent from an average season snowfall really tells the tale...
Present & Future
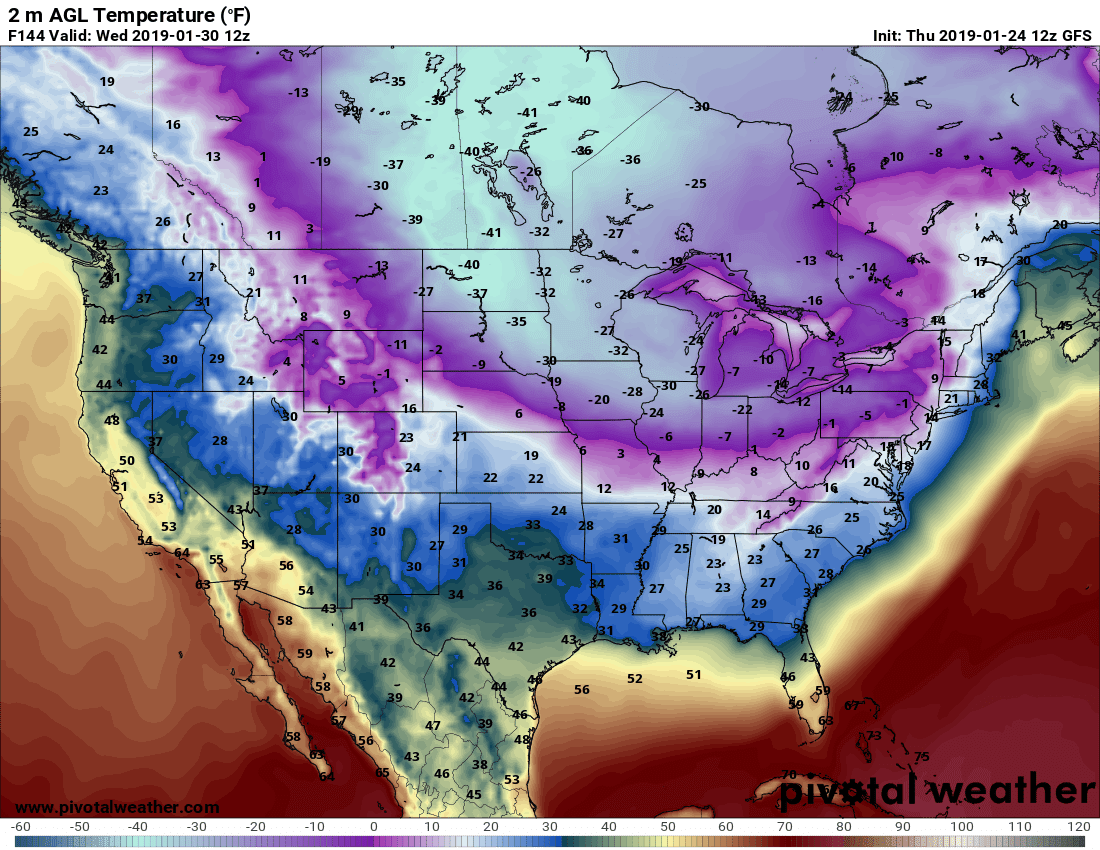
Recently; the weather has turned colder with more typical
temperatures for mid January. Latest GFS/ECMWF guidance continues then the trend
for colder, normal to below normal temperatures dominating into next week ~ will it stay? Even more discerning to snow lovers and those whose livelihood depends on snow ~ will it ever snow enough to save the winter? There may be some help in that area too as latest guidance over the weekend has been projecting an Ohio Valley low bringing Southeast Michigan some snow the beginning of next weekend /18-19/. Stay Tuned, back to the rest of the winter outlook...
Do the Winter Analogues for 2018-19 which projected December the best likelihood (of any winter month) to be on the milder side; revert back to a colder, more normal winter (see Analogue Discussion below)? From the original
Winter Outlook
"Unlike
the other winter months, December had quite a few years with above
normal temperatures. Detroit alone, saw five Decembers where averages
fell in the 30s /norm 30.1/. December of 2006 was one of the warmest
December's on record with 37.4 /6th warmest/. Chances for colder, below
average temperatures increase somewhat as we move into the mid to later
winter on a departure basis".
"Precipitation and Snowfall
Generally
with precipitation (both rain and snow); below average amounts
dominated. However; there were just enough above normal precipitations
and snowfalls to seriously consider - being most occurred in more recent
winters. This fall's rainfall /13.03" thus far/ matches well for the
wet fall that occurred in 1986 /"12.45"/ in Detroit This precipitation
pattern also lines up with our present fall wetter pattern and with our
snowy November. As stated before, half of the Novembers that preceded
the analogue winters were below normal temperatures - or notably cool.
Another item in that same vein of an early start to winter is that all
locations averaged above normal snow in November in the analogues - and
indeed in this November, also".
What about the prediction of the American /CFS.v2/ and Foreign
season models (Jan-Mar)? The Foreign models hold on to the suggestion of a Modoki Winter SST pattern whereas the American models paints a more general El Nino.
The Foreign models continue to promote the likelihood of a colder winter on the whole; whereas the American season model /CFS.v2/ forecasts generally a milder winter with less precipitation. However; it must be noted just recently the CFSv2
monthly climate model has flipped for February to be a colder than average February with near normal precipitation. Therefore; now all aforementioned guidance now agrees for a colder or more normal to below normal temperatures for the rest of the winter. Thus far however; the CFSv.2 and the trend projected by the Analogues have both been the best guidance for the first half of the climatological winter (Dec-Feb).
To be gut-honest; my original Winter Outlook was also looking for the somewhat colder part of the winter also with the call of "normal to below temperatures". However; not so much of the snowy winter part with the majority of the analogues on the low side of the snow spectrum. However: with the trend of the
later analogues of normal to above snow and the ongoing above normal snow in November (when Winter Outlook issued), receiving at least near normal snow would have been a somewhat logical deduction.
Analogue Guidance Discussion
The Detroit analogues did show the best chance for the above normal, warmer month being December. In fact, five averaged comfortably above normal with a mean of 33.7 (Dec 2018 ave'd 34.5). January thru February months did change with the preponderance of months with below normal temperatures - 12 below normal, 6 normal and 6 above. This left us with 5 below normal winters, 5 normal winters and just 2 above and subsequently; the original winter temperature call, normal to below since basically, evenly matched. I will have to say, since we did experience a mild December
and early January thus far; even though the future trend dictates colder the rest of the winter, averaging above normal certainly could happen. In fact, in the two warmest Decembers, 1994 and 2006, the one winter /2006-07/ just squeaked down into the normal category by .1 of a degree @ 28.8 (category of -1 to +1 of norm for departure) while the other/1994-95/ was above normal at 29.6 /+1.1/.
| 🌈 |
| L |
|
|
|
|
|
|
|
|
|
| A | DETROIT | T | E | M | P | S |
| P | C | P | N |
| N | SEASON | DEC | JAN | FEB | WNT AVE | WINTER | AO / SC | SEASON | DEC-FEB | WINTER | QBO |
| A | 1914-15*n | 23.9 | 23.4 | 29.9 | 25.7 | 1 | SC++ | 1914-15* | 7.07 | 1 |
|
| L | 1940-41*n | 32.1 | 26.3 | 25.3 | 27.9 | 1 | SC- | 1940-41* | 4.99 | 1 |
|
| O | 1963-64* | 23.8 | 30.4 | 28.9 | 27.7 | 2 | AO / SC | 1963-64* | 4.15 | 2 | E-/W |
| G | 1968-69** | 28.1 | 23.1 | 28.2 | 26.5 | 2 | AO-/SC-- | 1968-69** | 6.57 | 2 | E-/- |
| U | 1976-77n | 21.5 | 12.8 | 25.2 | 19.8 | 3 | AO-/SC++ | 1976-77 | 3.41 | 3 | W-/E |
| E | 1979-80*n | 31.9 | 24.5 | 22.2 | 26.2 | 4 | AO-+/SC-- | 1979-80** | 4.05 | 4 | E/- |
| S | 1986-87*n | 31.7 | 26.1 | 29.6 | 29.1 | 1 | AO+-/SC+ | 1986-87* | 5.16 | 5 | W-/E- |
| 1994-95 | 35.4 | 28.4 | 24.9 | 29.6 | 2 | AO+/SC- | 1994-95 | 5.75 | 3 | E/W- |
| E | 2002-03*n | 28.7 | 20.5 | 23.1 | 24.1 | 5 | AO-/SC-- | 2002-03* | 2.24 | 6 | W-/E- |
| L | 2004-05** | 29.7 | 24.1 | 28.5 | 27.4 | 3 | AO+-/SC+ | 2004-05** | 9.33 | 1 | W-/E- |
| 2006-07 | 37.4 | 29.6 | 19.4 | 28.8 | 4 | AO+-/SC+ | 2006-07 | 7.49 | 2 | W- |
| N | 2009-10** | 29.2 | 25.1 | 27.9 | 27.4 | 5 | AO-/SC++ | 2009-10** | 5.56 | 4 | E |
| I |
|
|
|
|
|
|
|
|
|
|
|
| N | Ave | 29.5 | 24.4 | 26.1 | 26.7 |
| SC++ | Ave | 5.48 |
| QBO |
| O | NORM 30Y | 30.1 | 25.6 | 28.1 | 27.9 | 100YR - | 26.7 | Norm | 6.44 |
| E-/W- |
| Dep | -0.6 | -1.2 | -2 | -1.2 |
|
| Dep | -0.96 |
|
|
| M |
|
|
|
| -1.2 |
|
|
|
|
|
|
| O | DETROIT | S | N | O | W | F | A | L | L |
| Oct |
| D | SEASON | OCT | NOV | DEC | JAN | FEB | MAR | APR | SEA TOT | SEASON | Sib snow |
| O | 1914-15* | T | 0.7 | 15.1 | 13.1 | 2.2 | 6.5 | T | 37.6 | 1 | * |
| K | 1940-41* | 0 | 9.1 | 4.3 | 6.4 | 4.2 | 2.8 | 0 | 26.8 | 2 | * |
| I | 1963-64* | 0 | T | 10.3 | 6.7 | 5.1 | 9.2 | 1.2 | 32.5 | 3 | * |
| 1968-69** | T | T | 5.9 | 6.3 | 2.3 | 2.3 | 0.3 | 17.1 | 4 | A |
| W | 1976-77 | T | 1.4 | 9.8 | 14.7 | 5 | 12.3 | 0.7 | 43.9 | 1 | WA |
| I | 1979-80** | T | 3.2 | 2.3 | 2.8 | 5.5 | 11.7 | 1.4 | 26.9 | 5 | B |
| N | 1986-87* | T | 3.3 | 6 | 24 | 2 | 13.3 | 1.1 | 49.7 | 1 | B |
| T | 1994-95 | 0 | T | 9.6 | 13.1 | 5.7 | 3.5 | 1.6 | 33.5 | 6 | B |
| E | 2002-03* | 0 | 1.6 | 13.1 | 13.9 | 19.2 | 8.1 | 5 | 60.9 | 2 | B |
| R | 2004-05** | 0 | 0.1 | 12.5 | 26.9 | 12.5 | 7.4 | 4.3/0.1 | 63.8 | 3 | % |
| S | 2006-07 | 0.2 | 0.1 | 2.4 | 6.4 | 14.1 | 5.5 | 1.6 | 30.3 | 7 | A |
| 2009-10** | 0 | 0 | 7.8 | 8.9 | 27 | T | T | 43.7 | 2 | % |
| 2 |
|
|
|
|
|
|
|
|
|
| 2018 |
| 0 | Ave | T | 1.6 | 8.3 | 11.9 | 8.7 | 6.9 | 1.7 | 39.1 |
| % |
| 1 | 30y Norm | 0.1 | 1.4 | 9.7 | 12.5 | 10.4 | 6.9 | 1.7 | 42.7 |
|
|
| 8 | Dep | -0.1 | 0.2 | -1.4 | -0.6 | -1.7 | 0 | 0 | -3.6 |
| Sib Snow |
|
|
|
|
|
| 7 |
|
| 45 | ther | * N/A |
| | | Color | Temps | Degrees |
| Rain | Inches |
| Snow | Inches |
|
|
| Legend: | Below | 1.0> |
| Below | 1.00> |
| Below | <5.0 | n |
|
| 1 |
| Normal | 0.0-1.0 |
| Normal | 0.00-1.00 |
| Normal | >-5.0<5.0 |
|
|
| 9 |
| Above | 1.0> |
| Above | 1.00> |
| Above | >5.0 |
|
|
|
|
|
|
|
|
|
|
|
|
|
|
There's no getting around the snowfall outlook for metro Detroit; it was fairly dismal for snowfall lovers with 7 out of the 12 being below normal (some substantially), 3 above normal and 2 normal. The only 'positive" was that the heavier snowfalls occurred in the later years and do reflect our trend since 2000.
Winters with the best scores with temperature trends thus far seem to be 1940-41; 1979-80; 1994-95 and 2006-07 but it's still early. Unfortunately none of those winters had above normal snow for snowfall enthusiasts around metro Detroit with the highest at 33.5" Though remember, the two winters that had substantially above normal snow were 2002-03 and 2004-05. As of Jan 12th, only 7.4" has fallen at Detroit Metro. Flint and Saginaw have fared better with about double that at 15.8 and 15.0" respectively. Also a similarity to recent trends seen was our extremely wet autumn /13.65" - 2nd wettest/ and the Autumn of 1986 which turned out to be the 6th wettest with 12.45". The snow season for 1986-87 was above normal at 49.7" All three cities however; did contain 7 below normal snow seasons in the analogue study. Snowfall lovers can only hope for a turnaround to at least bring snowfall totals to normal.
Remember though; in the final analysis we are first looking at trends and second, specific amounts in both snowfalls and temperatures.
Rest of the Winter: Normal to Below Temperatures, entire winter Normal temperatures.
Normal to Below snowfall, entire winter Normal to Below.
Next; and speaking of snow...what's all this talk of a possible snowstorm next weekend? I'll be following the guidance and other developments and look into that later this week if necessary.
 Making weather fun while we all
learn,
Making weather fun while we all
learn,
Bill Deedler
- SEMI_WeatherHistorian