What can you say about the Winter of 2019-20 and Spring of 2019; wacky! It came on gangbusters in November with the earliest and most snow in a storm (
heavy snowstorm on Veteran's Day). While there have been a few earlier, heavy snowstorms (closest; Nov 15-16th,1932 with 9.0"; Nov 2-3 in 1966 with 6.0" and in 1951 with 5.6") but none up to November 11-12th have been as high as the 9.2" last autumn. Also; Flint tied for the 3rd biggest November winter storm with 9.0 inches of
snow. The biggest November storm for Flint dumped 13.4 inches on
November 6-7, 1951. Saginaw's snowfall was much less at 4.0" on 11th and not nearly a potential candidate with 11.3" falling back on Nov 2-3, 1966.
Maybe not surprising; exceptionally cold November weather also occurred with the 13th coldest /35.8/ November on record at Detroit, 9th coldest /34.6/ at Flint and 4th coldest /33.3/ at Saginaw.
From the NWS - DTX More on the storm of Nov 11-12th
During the early morning period of November 11th, a surface low
pressure began to develop over the Ohio Valley tied to a stationary
boundary over that region. Snow started to move into SE MI from the
west shortly after 3am with the bulk of the region seeing snow falling
by 4am. The initial part of the storm had 3 distinct heavier snow bands
develop across our region that would begin to collapse together to form
one distinct very heavy band by the noon/early afternoon time-frame. This
band had 1" per hour snowfall rates over the western and northern Metro
areas leading to the high totals seen across Washtenaw, Oakland,
and Macomb counties. It would slowly move and pivot east across Detroit
and the southern Metro area later in the afternoon as the low began to
move east into Pennsylvania. While all this occurred, northerly flow off
of Lake Huron allowed for lake-enhanced snowfall rates over the Thumb,
especially over areas on the northern and eastern shorelines with some
locations seeing over a foot of snow.

In spite of November's aggressive cold and snow introduction to the cold season; the Winter of 2019-20 ended up high on the list as a warmer than normal winter (see top 20 coldest/warmest summers rankings below). Detroit attained 9th warmest winter status since 1874 with a 32.6 degree average. Flint ranked even higher with 5th warmest winter with a 31.5 average and Saginaw made the warmest list at 7th place with a 29.8 average.
Winter Temps and Precipitation Maps
Temps
Precip

Snow Season 2019-20


Top 20 Coldest/Warmest Winters in Southeast Lower Michigan |
| Rank |
Detroit Area* |
Flint Bishop** |
Saginaw Area*** |
| Coldest |
Warmest |
Coldest |
Warmest |
Coldest |
Warmest |
| Temp |
Year |
Temp |
Year |
Temp |
Year |
Temp |
Year |
Temp |
Year |
Temp |
Year |
| 1 |
18.8 |
1903-1904 |
36.9 |
1881-1882 |
16.7 |
1976-1977 |
33.4 |
1931-1932 |
15.7 |
1962-1963 |
33.3 |
1931-1932 |
| 2 |
19.3 |
1874-1875 |
35.7 |
1931-1932 |
17.0 |
1962-1963 |
33.0 |
2015-2016 |
16.5 |
1917-1918 |
31.7 |
2015-2016 |
| 3 |
19.7 |
1976-1977 |
35.2 |
1889-1890 |
17.8 |
1958-1959 |
32.2 |
1982-1983 |
16.6 |
1919-1920 |
30.9 |
1997-1998 |
| 4 |
19.7 |
1917-1918 |
33.8 |
2001-2002 |
18.6 |
1978-1979 |
31.7 |
2001-2002 |
17.5 |
1978-1979 |
30.6 |
2011-2012 |
| 5 |
20.4 |
1962-1963 |
33.8 |
1997-1998 |
19.0 |
2013-2014 |
31.5 |
2019-2020 |
18.0 |
1977-1978 |
30.5 |
2001-2002 |
| 6 |
20.6 |
1977-1978 |
33.5 |
2015-2016 |
19.3 |
1977-1978 |
31.3 |
1997-1998 |
18.2 |
1976-1977 |
30.0 |
1936-1937 |
| 7 |
20.8 |
1919-1920 |
33.0 |
2011-2012 |
19.8 |
1993-1994 |
31.2 |
2011-2012 |
18.2 |
2013-2014 |
29.8 |
2019-2020 |
| 8 |
20.9 |
2013-2014 |
32.9 |
2016-2017 |
19.9 |
1944-1945 |
30.3 |
1932-1933 |
18.2 |
1958-1959 |
29.6 |
1982-1983 |
| 9 |
21.0 |
1935-1936 |
32.6 |
2019-2020 |
20.9 |
1981-1982 |
30.2 |
2016-2017 |
18.7 |
1935-1936 |
29.5 |
1920-1921 |
| 10 |
21.1 |
1892-1893 |
32.5 |
1982-1983 |
21.2 |
1935-1936 |
29.1 |
1952-1953 |
19.0 |
1993-1994 |
29.4 |
2016-2017 |
| 11 |
21.4 |
1904-1905 |
32.5 |
1879-1880 |
21.3 |
1969-1970 |
28.8 |
1936-1937 |
19.2 |
1916-1917 |
29.0 |
1918-1919 |
| 12 |
21.5 |
1978-1979 |
32.3 |
1918-1919 |
21.4 |
1985-1986 |
28.6 |
1948-1949 |
20.0 |
1961-1962 |
28.8 |
1932-1933 |
| 13 |
21.7 |
1880-1881 |
32.2 |
1952-1953 |
21.5 |
1961-1962 |
28.5 |
2012-2013 |
20.1 |
1944-1945 |
28.5 |
2012-2013 |
| 14 |
21.8 |
1911-1912 |
31.6 |
1877-1878 |
21.6 |
2008-2009 |
28.3 |
1930-1931 |
20.2 |
1969-1970 |
28.3 |
1952-1953 |
| 15 |
21.8 |
1878-1879 |
31.3 |
1948-1949 |
21.6 |
1983-1984 |
28.2 |
1991-1992 |
20.3 |
1981-1982 |
28.0 |
1930-1931 |
| 16 |
21.9 |
1981-1982 |
31.2 |
1920-1921 |
21.6 |
1947-1948 |
28.2 |
1949-1950 |
20.7 |
1947-1948 |
27.8 |
1974-1975 |
| 17 |
22.4 |
1969-1970 |
31.1 |
1875-1876 |
22.0 |
2014-2015 |
28.1 |
1974-1975 |
21.2 |
2008-2009 |
27.6 |
1948-1949 |
| 18 |
23.0 |
1958-1959 |
31.0 |
1953-1954 |
22.2 |
2010-2011 |
28.0 |
1953-1954 |
21.3 |
2002-2003 |
27.2 |
1998-1999 |
| 19 |
23.2 |
1876-1877 |
30.8 |
1949-1950 |
22.4 |
1942-1943 |
27.8 |
1998-1999 |
21.4 |
1942-1943 |
27.1 |
1986-1987 |
| 20 |
23.3 |
2014-2015 |
30.7 |
2012-2013 |
22.5 |
2002-2003 |
27.7 |
1986-1987 |
21.6 |
1985-1986 |
27.1 |
1953-1954 |
* Detroit Area temperature records date back to November 1874.
** Flint Bishop temperature records date back to January 1921.
*** Saginaw Area temperature records date back to January 1912. |
Winter 2019-20 Monthly Data
December 2019
Winter took a holiday in December (the actual first winter month) with very mild temperatures and below to well below normal snowfall. December exchanged the Snowiest list to the Snowless list with Detroit 18th warmest with 35.1
degrees and 2.7" snowfall ( just missing 20th snowless at 2.6"). Keep in mind this was less than a degree colder than November's average of 35.8. More notable average temperature placements occurred further north with Flint placing 7th warmest December with 34.2 (as compared to November's 34.6) and 7.0" of snow. Saginaw placed 12th warmest with 32.5 (compared to November's 33.3) and received 5.8" of snow.
January 2020
January brought a mix of both mild January conditions yet normal to slightly above normal snow. Average temperatures ranged in the lower 30s; several degrees above the normals in the lower to mid 20s across Southeast Lower Michigan. Detroit's 32.4 degree average made it the 12th warmest January since records began with close to normal snow falling at 11.0". Flint's 32.0 average temperature placed it significantly further up the scale at the 4th warmest January on record. In addition; Flint's snowfall total of 16.8" pushed it into the January Snowiest List at 20th. Finally; the 30.4 degree reading at Saginaw placed it at 5th warmest with normal snow at 11.0".
Jan 17-18, 2020 storm
Snow quickly moved in during the late evening on Friday, January 17,
2020 as a strong low pressure system moved in from the Midwest and
across the Great Lakes region. This strong system brought numerous
advisories and warnings to the Midwest and Great Lakes. The majority of
the snow fell overnight and into the morning hours on Saturday before
tapering off and transitioning to rain showers and drizzle over some
parts of Southeast Michigan. Snow, rain and sleet were all seen over
the course of the later morning into early Saturday morning. With the
amount of moisture that was available with this system, the
characteristic of this snow was heavy and wet, making shoveling rather
difficult. During the heaviest snow, snowfall rates were 1+ inches per
hour leading to many locations seeing 5 to 7 inches of total snow.
February 2020
Late winter remained generally mild yet with above normal snow. Temperatures averaged 30.1 at Detroit still 2.0 degrees above normal along with slightly above normal snow with 14.1". Flint averaged better than three degrees above normal in February with 28.0/+3.2 but with a hefty 18.8" of snow to boot creating the 12th snowiest February at Flint. Saginaw averaged 26.4 degrees with about normal snow at 10.7"
Feb 26th storm
A low pressure system formed out over the Southern Plains and moved
northeast over the Ohio River Valley bringing snow to Southeast Michigan
on February 26th. This longer duration snow allowed for a Winter
Weather Advisory to be issued, with the main bulk of the snow falling
during the afternoon hours on Wednesday. Snow continued to linger
around through the overnight hours into early Thursday as the
deformation zone (the northeast portion of the low pressure system)
slowly pushed off to the east. Snowfall totals averaged around two to
six inches across much of the area. Lesser snowfall totals were seen up
in the Saginaw/Tri-Cities area, with higher amounts to the south.
November Through March Cold Season
An example of the cold season can be seen with Detroit's average temperatures and departures from November 2019 through March 2020. As you can see it basically wasn't too cold with November through March averaging 34.9 degrees or 2.4 above normal. The sharply colder month of November belied the remainder of the season with every month after; notably above normal.
| Detroit |
Cold
Season Nov - Mar 2019-20 |
|
|
|
|
|
|
|
|
|
|
|
NOV |
DEC |
JAN |
FEB |
MAR |
SEAS |
|
|
|
|
|
|
|
| Ave Temp |
35.8 |
35.1 |
32.4 |
30.1 |
41.2 |
34.9 |
| Depart |
-5.7 |
5.0 |
6.8 |
2.0 |
4.0 |
2.4 |
Winter Analogues fail on projected warmth but perform on erratic expectations along with cold periods in the spring.
"
Temperatures - Normal to Below"
"As with the majority of winters especially ENSO Neutral; look for
temperatures during the 2019-2020 winter to be quite changeable under a
fluctuating jet stream. The ongoing pattern recently experienced this fall was
also telegraphed for the Winter for 2018-19. In fact; the similar cold and snowy weather experienced
last November has even more aggressively repeated this November.
In my research; I’ve found Neutral ENSO patterns in the Pacific generally have
little effect on the weather patterns in the Great lakes and Southeast Lower
Michigan. This winter's analogues are strongly suggesting normal to below
normal temperatures this winter with the clear majority pointing in that
direction".
There were two main problems with the guidance which lead to the analogues and subsequent Outlook.
First and I feel most important; the upper polar low remained pretty much anchored most of the time up over the Arctic circle. This resulted in a very intense, at times near to record intense Polar Vortex contracted over the Arctic circle. This resulted in a +NAO/+AO which typically results in milder winter conditions for the Lakes as prevailing westerlies keep the door on the refrigerator mainly closed.
Second;
the ENSO neutral prediction failed to materialize until just recently in late spring
into early summer. Therefore; strongly aided with the contracted Polar Vortex; the atmosphere continued to behave as though an El Nino
was on-going through the winter.
The two complimenting factors supported an unusually mild winter
placing all three cities in the top 10 record warmest list (noted above in the Top 20 list).
An excellent write-up regarding the Bottled-up Winter 2019-20 Polar Vortex can be found
here. The following discussion by
Mark Vogan explains well the
"A record strong stratospheric polar vortex has brought probably the
coldest Arctic winter in over a decade and so it should be of no
surprise that Arctic sea ice cover has reached a 10-year high with the
greatest coverage since 2010".
The cold/strong vortex has been mirrored from stratosphere down through
the troposphere supporting a strong and persistent +AO/+NAO setup which
hosts low pressure within the polar region and a strong zonal jet stream
running west to east underneath. A strong zonal jet protects the
mid-latitudes from polar air".
Come later spring; the Polar vortex "let loose" so to speak bringing record cold in May to the region (more on May 2020, below).
Spring 2020 Temps and Precipitation Maps
Spring 2020

Why did is get so cold toward the end of spring?
Though the calendar said March (and the climate season announced spring); the weather fell into a more, strong warm/cold pattern with snow right into May. As stated; the unusually deep and record cold Upper Low pressure hovered over the Polar region most of the winter. During the mid-late spring, the Polar Vortex began to disintegrate, break apart and drift south into the Northern Hemisphere especially into North America and Eurasia. This brought the usually cold pockets of air further south into the Great Lakes into the East and occasionally the South mid and especially later spring.
Ironically; March (and spring) actually began on a good note, only to be set back several weeks occasionally in April and especially the first half of early May. March's weather averaged notably above normal in temperatures and notably below in the snowfall. With Detroit's average temperature at 41.2/+4.0 and just 1.8" of snow of the March normal 6.9" brought hopes of an early, sustainable spring.
Unfortunately; the remnants of the Arctic air mass began to surge south into the Great Lakes during April into first half of May. While April leaned toward the cooler side (basically averaging a degree or two below normal) a cool trend is not that uncommon in the Lakes early spring.
May started out warm enough but that was short-lived as most of early-mid May was a completely another story! Remnants of the Arctic air wrapped up in the weakening Polar Vortex over Canada pushed south into the northern U.S. Record breaking cold slammed the Lakes Region and ultimately engulfed a large portion of the country east of the Rockies by the second weekend.
Records were established with record lows at both Detroit and Flint. Detroit's record low of 27 on the 9th was not only a record for the date but the 3rd coldest May temperature ever recorded. The 27 degree reading is shared with another low of 27 on May 7th, 1974. The second coldest temperature in May occurred on May 1st, 1978 with 26. The coldest May temperature ever recorded in Detroit; 25 degrees back on May 10th, 1966.
The staying power of the abnormal May cold in Southeast Lower Michigan was no better represented than at Flint. Flint chalked up THREE CONSECUTIVE record lows for this May. A low of 29 on the 11th, 27 on the 12th and 25 on the 13th. The 27 and 25 degree lows were the coldest so late in May and season. The coldest temperature ever recorded in Flint occurred on the same day as Detroit's - with a 22 degree winter-like reading also on May 10th, 1966.
May 2020 Snow
Snow records were established in a few categories at Detroit; one for amount and the other for stretch of days with snow observed! First off; Detroit recorded a half inch /0.5"/ of snow on the 10th. That 0.5" of snow was the fourth latest day measurable snow was observed. The third latest was on May 13th 1912 with 1.5" and the second and first actually occurred in one snowstorm over two days. These two outstanding records for amount and lateness were; 2.3" of snow fell late on May 21st, 1883 with another 2.7" falling after midnight into the morning of May 22nd, 1883. The snowstorm total of 5.0" was the latest and highest amount of snow in a snow season! The latest snow has ever been observed in Detroit occurred way back on May 31st, 1910 with a trace.
Arguably; a record even harder to break was having snow recorded on several days in a May. That only occurred once, back in 1954 when four days had snowfall that is; until this May when FIVE consecutive snow days were observed May 8th - 12th!
A "heat-wave" of sorts later in the month erased much of cold snap negative monthly departures of 5 to 6 below normal to just a couple of degrees below to even above normal. Detroit's May average temperatures of 57.7 came in 2 degrees below normal (and actually colder than Flint's average; a rare bird indeed). Flint's temperature came in above normal with 58.5 or 1.4 degrees above normal. Saginaw averaged slightly below normal with 58.5 or -0.9.
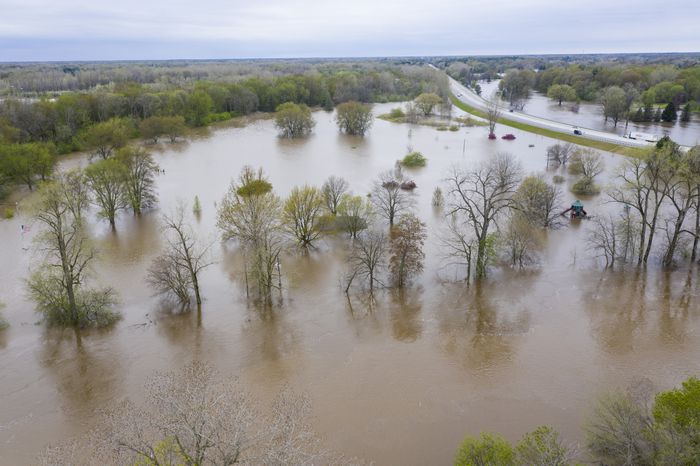
It was a generally wet spring with most areas seeing an inch or two above normal.
Heavy rains brought scattered flooding across Southeast Lower Michigan in May. The most horrendous damage occurred in a
damn failure on May 17-20th in Midland County along the Tittabawassee river after a heavy rain event.
(pics)


Brief Summer Outlook & Analogues will be out shortly.
Making weather fun while we all learn,
Bill Deedler -SEMI_WeatherHistorian


