In the 15 years or so in using specified analogues I researched; more often than not they were helpful in projecting the season outlook. While last winter was a bust; in many of the preceding winters before last winters; the analogues helped in projecting temperatures, snow and overall trends during the winter. This was more the case when there was a decided preference on a certain weather element such a temperature or snowfall being above, below or normal. Will it happen this winter; I certainly hope so but in any event, there are variables to consider.
One of the most important things to consider is timing and subsequent trend in the Outlooks. A good example of that was stated in my Outlook this go around. When mentioning the trend seen in the past in these analogue winters, the trend was for the "first part of the winter to be harder or harsher". Explaining this further; it has been my observation that winters (both temperatures and snowfall) generally unfold in four main ways and two less often ways. 1- First half the worst 2-Second half the worst 3-Early and later winter the worst with break mid winter or 4-Early and late winter relatively tranquil and mild but mid winter rough. The two that are less often are; 1-A rough and cold winter throughout 2- A tranquil and mild winter throughout. It is unusual to get wave after wave of cold or mild air throughout the winter though of course; it does happen. A good example of a recent mild winter was just last winter when the temperatures averaged well above normal and placed the region in at the sixth warmest winter on record at Detroit; fifth warmest at Flint and third warmest at Saginaw. All three cities placed in the top 20 warmest months for December, January and February. The winter of 2001-2002 was similar and I commented I thought last winter was very similar to that of 2001-02. As it turned out; the Winter of 2011-12 placed close to 2001-02 for mild winters along with the strong El Nino winter of 1997-98.
In regard to the above mentioned trends of winter; very rarely do you see these trends distributed nice and neatly in each winter month. On the other side of the coin; trends usually don't come all wrapped up nicely in individual monthly sequences; whether it be colder, warmer; snowier or snow-less than average. Many, many times prevailing trends of the month tend to overlap before or after the month. Meteorological oscillation patterns tend to prevail in a two to three week dominance. Therefore; when we look at composites for monthly sequences during the analogue years they a reflecting only the anomaly for the particular month not the dominant trend. For an example; the first three weeks in December could average below normal but the last week well above normal and thus; wiping out the dominant temperature trend of the month. While at the NWS and writing the Monthly Climatological Summary for Detroit and Flint (which included Saginaw), I saw this conflicting problem many times. I therefore, developed the "headline trend" of the month, which at times, could be completely opposite of the statistical figures. As an example; say the average temperature departure for December was +1.7 degrees. On just that alone; you'd think it had been a relatively mild December. However; digging deeper you find out that the first three weeks of the month averaged below normal and just the last week or so, well above. Therefore the "dominant trend of the month" was actually below normal but was eliminated when the monthly statistical temperature calculated; averaged above. Actually; this happens fairly regularly and I felt it should be addressed simply for the reason that it is more accurate for climate/public purposes and to a lesser extent, the public tends to better remember the dominant trend of the month.
Analogue Temperature/Precipitation Composites
When looking at temperature or precipitation composites for the month, we are looking at the anomaly for the month; meaning whether the month averaged above, below or at/near the statistical "normal" used. This normal used also becomes important because what normal you use can have a notable difference on the outcome. I have been a long-time critic of our /NWS/ 30 year normal process since it is so narrow and short termed regimented. I feel at least a 50 year normal would serve the public better and also would be at least; a little more accurate. However; when looking at alternating cycles of ENSO, NAO, PDO etc etc, a climatologically more inclusive 80 or even 100 year normal is optimal. It has been proven that many of those oscillations follow a gradual 35-45 year cycle from below to above; and then another 35-45 years to below again. Therefore; a complete cycle or "wave length" would take an estimated 80 years or so. Therefore; an all inclusive normal in regards to include the complete wave length of many of these oscillations should be at least 80 years. And ironically; close to the a person's average life time expectancy - also a plus for the public and to use it. It becomes more relevant to the public as they age and relate past climate trends to current. Using 30 year normals would be more relevant for studying more recent trend changes with scientists. Also; like the present, the normals would be revolving or updated every ten years. Therefore; as of 2012, the normals used for temperatures, precipitation and snowfall would come from the years of 1930-2010. Then in 2020-21, the new normals would come from 1940-2020. Ok, ok, ok..enough on my climatological normals soapbox! What do the analogues show for the month of December?
December 2012
Map-1
Temperature Anomaly Composites
Map-2
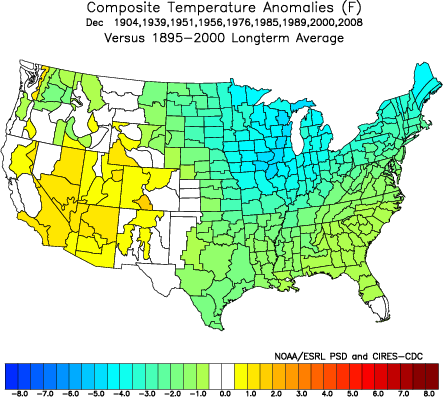
The composites show a colder than normal December on average in the past when using our analogue winters. Remember above when I mentioned the anomaly (departure) is of course, relative to the normal used. Note; the subtle moderating effect (about a degree or so, depending on location) the longer term average has on the anomalies. Basically meaning; our normals now (1980-2010) in map-1 are warmer than the 105 year normals (1895-2000) displayed in map-2. There were some cold, a few brutally, December temperature averages in that lot; 1976 - 21.5...1985 - 22.2...1989 - 18.0 and 2000 - 19.3. Thus, the anomaly is skewed down somewhat and remember in the past I've said the anomaly (departure) sign is more important than the numerical value. Therefore; basically the analogues are portraying a below normal temperature month with December colder than "normal". This also feeds into the thinking that the first half of the season in the past was the harsher.
Precipitation Anomaly Composites
In the past Decembers; the general precipitation for December averaged around normal. If the temperatures verify colder than normal and precipitation is near normal, that would set us up for at least normal to possibly above snowfall. Hmmm...we've certainly been hard pressed to see any decent snows around here lately; so THAT would be a change. The precipitation pattern intimates a subtle storm track around the Gulf states and up into the eastern Ohio Valley/eastern Lakes Region and another in the Plains; through the Upper Midwest and Upper Great Lakes. Another possible track would be up around the Gulf states; then up the East Coast with most of the precipitation well inland.
500 MB Mean Height Composite
500 MB Mean Anomaly Composite
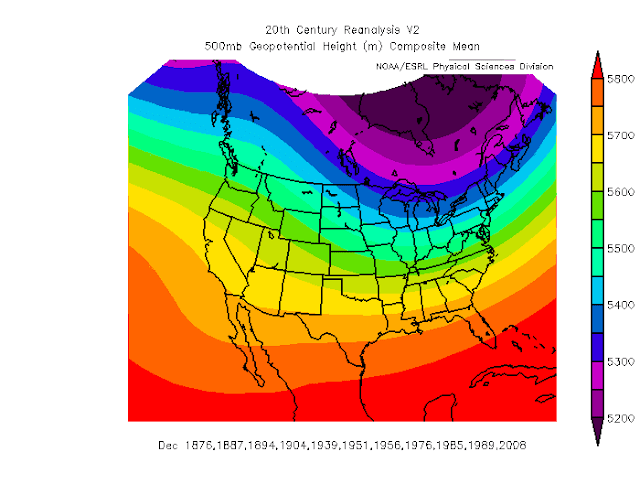
No doubt about what the analogues (mean 500 MB Jet and anomaly) blatantly suggest for the upper flow; ridge in the west and trough in the east. Is this for the whole month? If you read the first part of this blog; you should know the answer. NO! What the analogues are suggesting to me anyway; is that this was the main pattern in many of the previous analogue December's and again; may be our dominant or most notable pattern this December. We shall see!
| Making weather fun while we all learn, Bill Deedler -SEMI_WeatherHistorian | ||||||||||||


