Summer of 2022 is shaping up to be a complex summer; weather-wise as the battle lines between the warm-hot muggy air and the prevailing cooler late spring-like air has only sporadically clashed in the Great Lakes thus far. I anticipate this will change soon like most years with the active part of summer only being pushed back a few weeks. Upper weather features create a strong, active jet with time as heat bubbles over the south and active fronts in the north.
TEMPERATURES
I look for the summer to average around normal or -1.0 to +1.5 degrees of the new 1991-2020 normals in Southeast Lower Michigan. The summer seems to be shaping up to be a more changeable summer than is typical in both temperature ranges and weather patterns. The push of cooler air from Canada should offset most hotter spells from the south.
RAINFALL
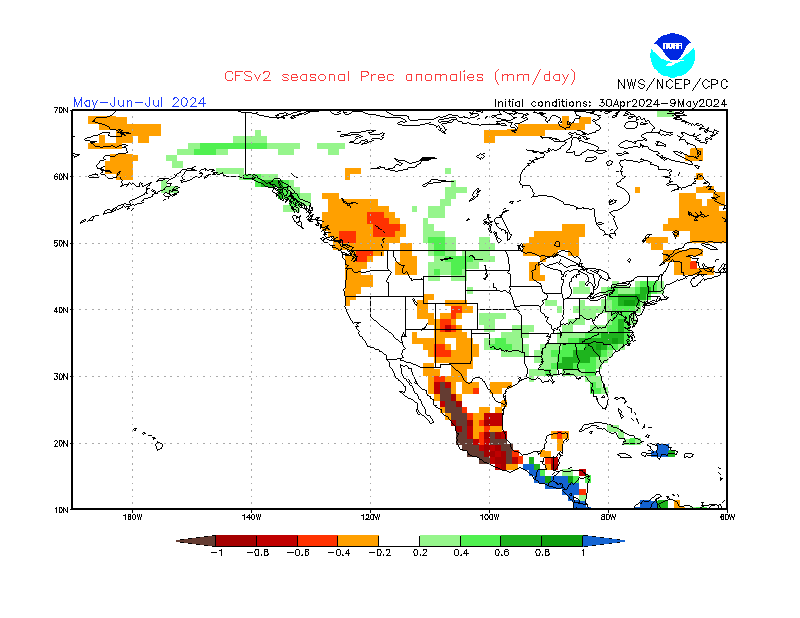
Though analogues display a slightly drier summer when all data is considered; in following the overall recent rainfall patterns, a normal to wetter summer is more likely.
Global ENSO Patterns
Hemispherically speaking; the prevailing La Nina of the past several seasons shows little change through the summer into the autumn. In fact; latest forecast trends continues a weak La Nina into the fall anyway with questionable paths, thereafter. The upcoming winter would be our third La Nina winter if it remains so, an unusual occurrence. This is the very latest ENSO plot of various SST modeling as of June 5th.

Upper Wind/Pressure Height Outlook


PROJECTED UPPER WIND FLOW ACROSS THE COUNTRY FOR THE SUMMER
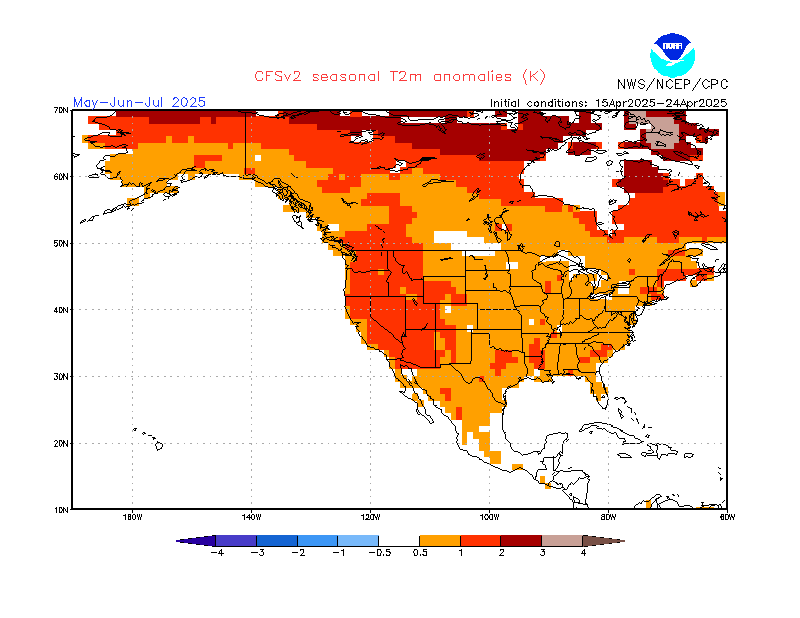
Many times the CFSv2 model displays similar pressure outlooks for the summer with the Upper Low over Eastern Canada and High Pressure ridging from the Midwest west to the Rockies. Their positioning and jet stream will be even more important this summer as there's been more of a dominance of the Upper Low in central-Eastern Canada and just recently; the Upper High ridging in the south and central US. The temperature contrast forecast has been quite notable and erratic for early - mid June on the GFS/CFS at times. For example; one run may be forecasting lows/highs 40s-60s across the Great Lakes mid month; then the next run; 70s to as high as mid 90s to around 100 for the very same area/period. The primary variance is a result of model setting up a rather deep cool trough over Eastern Canada/Great Lakes or a powerful warm-hot ridge over the same region and same time.
With early modeling so erratic even in the short term; a good place to compare it to is the second summer weak La Nina analogues. And maybe not surprising; the analogues recently have some of our recent hottest summers 2012 and 2018 and earlier; some of our coolest summers. 1985, 1917. What to do?

With the older analogues being cooler along with new norms being slightly higher; the analogues are already skewed to cooler side. On the flip-side; the later years have indeed warmed slightly due to climate change and the warming of micro-climate at Detroit Metro Arpt due to urban and local airport expansion - all affecting temperatures since mainly the 1980s. These warming caveats must be considered in forecasting and outlooks at least for the Detroit Metro region.
The analogues since 2000 /4/ are more heavily weighted due to recent changes and patterns. Looking at those four specifically we have: two cool and two warm along with one summer wet, one dry and two around average rainfall - which btw has also risen /.14/ or from 9.89 to 10.03". Therefore; the later years still balance temperature and rainfall out to around the "new normals" - so not much help.😕
Taking all analogues into account spells a cooler than normal summer along with about normal to slightly below rainfall. But again; remember some of those "cooler" summers were actually normal summers at that time since the normals were cooler back then too, confused? Normals are updated every decade to account for recent trends; much like I weighted the last 21 years in my analogues.
Analogue Monthly Trends
Temps
Monthly trends are very mixed but still are worth mentioning. Junes tended to be the coolest relative to normal when all analogues are considered. While all Julys and Augusts means also averaged below normal, using the recent trends /since 2000/ June and July have the best chance to counter that long-term trend by averaging normal to above. So for example; the long term prevailing guidance says a cooler June; while the short term analogue trend says a normal to warmer June😎
Rainfall
What's also interesting on these analogues is the mix of rainfall and when. And also where the median precipitation line falls...just below normal. That may be a hint of "who" dominates; the Upper Canadian Low or the American High Pressure Ridge. Since cooler and drier dominates the analogues entirely; that would suggest the Upper Low is able to help stir cooler, drier high pressures into the country more often than what typically happens.
It also should be noted; the two wettest years contained normal temperatures /1975/ - (which btw was rather stormy- parade of cold fronts). I started to work those mid 70s and I do remember the mid 70s were active, especially 1974, 75 & 76. The other wet year was 2000 and boy was it a wet, cool summer. One of the wettest analogues I can recall with nearly 15" /about 5" above normal/ at DTW. I believe the northern/western burbs received more yet! These summers were active with fronts hanging around and battles of air masses breaking out.
More recent analogues hint at the ridge dominating which brought hot weather but actually less rainfall. If the ridge does dominate more; most of the active weather could be stirred further north across the northern Mississippi Valley, Great Lakes or Canada. Another possibility was the timing of the frontal activity with more fronts passing through Southeast Michigan late overnight into the forenoon hours leading to less rain. The busiest month in Southeast Michigan those hot summers was July in both 2012 and 2018.
CFSv2 Temps Summer 2022
Rainfall Summer 2022
Look for updates and other weather information on FB and here during the summer.
Making weather fun while we all
learn,
Bill Deedler
- SEMI_WeatherHistorian