Well, we sweated through another hot summer across Southeast Lower Michigan with average temperatures in many places almost a duplicate to last summer. What things were similar and what things were different to last summer? Look for my Summer Review and Autumn Outlook after Labor Day during the first week of September. To recap on last summer's weather events go to Summer Review 2010.
Also with hurricane season in full swing, check out the story I did the several tropical systems to hit Southeast Michigan, including the most powerful tropical remnants ever to hit the region.
-WxH_SeMI
Aug 6, 2011
Upper Wind Projections Cool It!>>> Update*
8/13/11 - See update below*
If you are a heat and humidity hater and your air conditioner has become your best friend, it's time to give that friendship (and your wallet) a break. Early indications from extended models for the next couple of weeks are suggesting our friend from Canada (though foe in the winter), the upper low pressure and trough over eastern Canada, is going to exude its influence south into our neck-of-the-woods over the coming days. I noticed the pattern change about a week ago at the edge of model time period, about 12-14 days out. One has to be careful in jumping on the bandwagon of such a change that is so contrary to the recent stubborn and strong ingrained pattern. These abrupt changes tend to show up in model data late in the prevailing season, sort of "rushing in" the season in the wings.
These changes in model trends that show up way out in "la la land" (or as some at the NWS-DTX "affectionately" referred to it as "Deedler-land") more often than not, do eventually happen but their timing can be most problematic. I am a weather "enthusiast" (spelled "n-u-t") about past and future upper air and surface patterns and their correlations. That is, researching and examining past patterns and correlating them to present and future projections. Projected teleconnections can be compared to past patterns for feasibility and accuracy or put it simplicity: Does the overall general forecasted upper air pattern "look right" when compared to past Climatic patterns?
Ok Ok Ok... Back to the future
Upper air projected patterns continue to show a notable change in the upper air flow across the upper Midwest and Great Lakes in the coming few weeks. Basically a lowering of heights aloft and cooling at the surface due to an expansion of the upper low in eastern Canada. This, in turn, would encourage a more dominant west-northwest flow rather than the south-southwest flow seen for several weeks now.
Update*
The first wave of cooler air has brought beautiful weather across the region with highs in the 70s and lows in the 50s. Looking out further shows the second wave of cooler weather coming late in the weekend /21st/. The upper wind flow projections can be seen below on Sat August 20th at 8am EDT. Ahead of this front, look for temperatures to warm back up well into the 80s by mid week. Normal highs this time of year are in the lower 80s.
In my earlier article I stated, "Will this cooler trend prevail through the end of the month? I doubt it but I will say this, more often that not, I've noticed the first fleeting hint of the upcoming autumn season change, surfaces in mid August." This too appears on track as the ridge attempts to build back into the region for a longer stay late in the month. This will bring warmer weather back to the region.
Sat- 8AM 08/20/11

Aug 5, 2011
It's the HEAT! July 2011 goes out in a blaze of heat!
First off, even though I added it as a comment to my July write-up, it bears repeating here if you didn't see it. It was one MISERABLE July for those who hate heat and humidity. Yes, it did turn out to be the hottest July and worse yet, hottest MONTH on record at Detroit! Add the relatively high humidity levels that accompanied the heat and that made it downright miserable much of the time. The only thing worse than July's heat and humidity, will be August's electric bill (and I'm scared of that)!
Take a look the Temperature Departure map across the Midwest for this
July, which is normally the hottest month anyway!

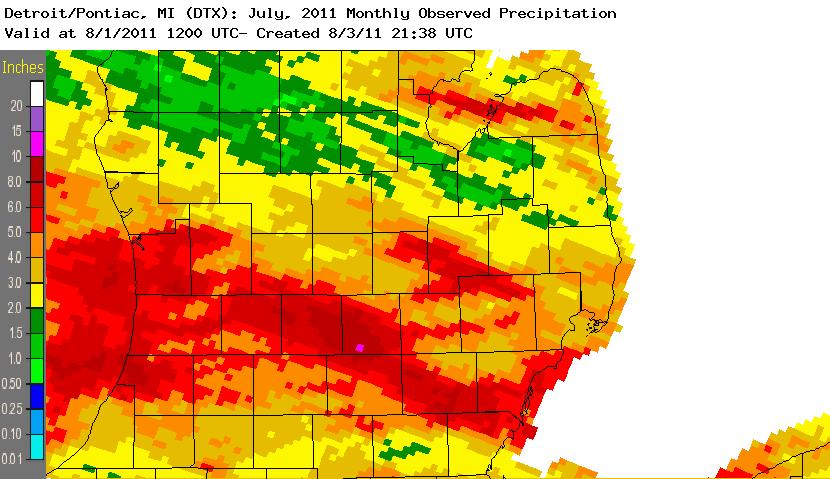
Second, July was also a "precipitation extreme month" with very wet and dry conditions existing in unison. Parts of the area saw less than .50" of rain up until very heavy rains from storms hit the entire region very late in the month. These heavy rains camouflaged (on July's rainfall map) the intense dry spell that engulfed some of the region from late June into late July that led to parched lawns and gardens. Not so at Detroit Metro Airport (Detroit's official climate site) and nearby downriver communities, they got hammered with most of the storm activity through the month. This led to the second wettest July on record at Detroit with 7.66" (second only to 1878 with 8.76"). Curiously, this is not unlike last summer when much of the severe weather and heavy rains also fell south of I-94. The driest areas this July (before the late month heavy rains) extended from northern Washtenaw and Wayne counties, north into Brighton, Saginaw and Flint and eastward into the interior of the Thumb Region.
 A better defined rainfall map >>>>

Recapping the July Stats:
Average temp for Detroit in July 2011 was 79.3 degrees and this makes July 2011 the hottest July and MONTH on record. Also, July had 14 days it reached 90 degrees or better but this was NOT the record for July. That honor belongs to July of 1955 with 17 days of 90 or better. We now have a three-way tie for second place for the number of 90s+ in July with 14 days with July 2011 tying with July of 1977 and 1934. This July we maxed out at 100 degrees on the 21st (let's not forget the 99 on the 2nd). By the way, back in that July of 1977 we had a monthly max of 102 (one of two 100s in the month). That Summer of '77 was preceded by the brutal winter of 1976-77 and the following Winter of 1977-78 was non too pleasant, either.
How did we place in the hottest months across the region?
Detroit July Ave: 79.3 - Hottest July/month on record
Flint July Ave: 76.8 - Third hottest July/month on record
Saginaw July Ave: 76.1 - Fourth hottest July/month on record
Previous top 5 Hottest Months on Record from NWS
Finally, a cooling trend in the offing??? We'll look at what the extended maps are hinting at for the rest of the summer, in a couple of days.
-----------------------------------------------------------------
How the July heat affected the rest of the country
Take a look the Temperature Departure map across the Midwest for this
July, which is normally the hottest month anyway!

Second, July was also a "precipitation extreme month" with very wet and dry conditions existing in unison. Parts of the area saw less than .50" of rain up until very heavy rains from storms hit the entire region very late in the month. These heavy rains camouflaged (on July's rainfall map) the intense dry spell that engulfed some of the region from late June into late July that led to parched lawns and gardens. Not so at Detroit Metro Airport (Detroit's official climate site) and nearby downriver communities, they got hammered with most of the storm activity through the month. This led to the second wettest July on record at Detroit with 7.66" (second only to 1878 with 8.76"). Curiously, this is not unlike last summer when much of the severe weather and heavy rains also fell south of I-94. The driest areas this July (before the late month heavy rains) extended from northern Washtenaw and Wayne counties, north into Brighton, Saginaw and Flint and eastward into the interior of the Thumb Region.

Recapping the July Stats:
Average temp for Detroit in July 2011 was 79.3 degrees and this makes July 2011 the hottest July and MONTH on record. Also, July had 14 days it reached 90 degrees or better but this was NOT the record for July. That honor belongs to July of 1955 with 17 days of 90 or better. We now have a three-way tie for second place for the number of 90s+ in July with 14 days with July 2011 tying with July of 1977 and 1934. This July we maxed out at 100 degrees on the 21st (let's not forget the 99 on the 2nd). By the way, back in that July of 1977 we had a monthly max of 102 (one of two 100s in the month). That Summer of '77 was preceded by the brutal winter of 1976-77 and the following Winter of 1977-78 was non too pleasant, either.
How did we place in the hottest months across the region?
Detroit July Ave: 79.3 - Hottest July/month on record
Flint July Ave: 76.8 - Third hottest July/month on record
Saginaw July Ave: 76.1 - Fourth hottest July/month on record
Previous top 5 Hottest Months on Record from NWS
| Rank | Detroit Area* | Flint Bishop** | Saginaw Area*** | ||||||||||||||||||||||||||||||||||||||||||||||||||||||||||||||||||||||||||||||||||||||||||||||||||||||||||||||||||||||||||||||||||||||||||||||||||||||||||||||||||||||||||||||||||||||||||||||||||||||||||||||||||||||||||||||||||||||||||||||||||||||||||||||||||||||||||||||||||||||||||||||||||||||||||||||||||||||||||||||||||||||||||||||||||||||||||||||||||||||||||||||||||||||||||||||||||
| Coldest | Warmest | Coldest | Warmest | Coldest | Warmest | ||||||||||||||||||||||||||||||||||||||||||||||||||||||||||||||||||||||||||||||||||||||||||||||||||||||||||||||||||||||||||||||||||||||||||||||||||||||||||||||||||||||||||||||||||||||||||||||||||||||||||||||||||||||||||||||||||||||||||||||||||||||||||||||||||||||||||||||||||||||||||||||||||||||||||||||||||||||||||||||||||||||||||||||||||||||||||||||||||||||||||||||||||||||||||||||||
| Temp | Year | Temp | Year | Temp | Year | Temp | Year | Temp | Year | Temp | Year | ||||||||||||||||||||||||||||||||||||||||||||||||||||||||||||||||||||||||||||||||||||||||||||||||||||||||||||||||||||||||||||||||||||||||||||||||||||||||||||||||||||||||||||||||||||||||||||||||||||||||||||||||||||||||||||||||||||||||||||||||||||||||||||||||||||||||||||||||||||||||||||||||||||||||||||||||||||||||||||||||||||||||||||||||||||||||||||||||||||||||||||||||||||||||||
| 1 | 12.2 | Feb-1875 | 79.0 | Jul-1955 | 10.9 | Jan-1977 | 78.0 | Jul-1921 | 9.4 | Jan-1912 | 77.5 | Jul-1921 | |||||||||||||||||||||||||||||||||||||||||||||||||||||||||||||||||||||||||||||||||||||||||||||||||||||||||||||||||||||||||||||||||||||||||||||||||||||||||||||||||||||||||||||||||||||||||||||||||||||||||||||||||||||||||||||||||||||||||||||||||||||||||||||||||||||||||||||||||||||||||||||||||||||||||||||||||||||||||||||||||||||||||||||||||||||||||||||||||||||||||||||||||||||||||
| 2 | 12.8 | Jan-1977 | 79.0 | Jul-1921 | 12.8 | Feb-1979 | 77.7 | Jul-1935 | 10.4 | Jan-1918 | 76.8 | Jul-1916 | |||||||||||||||||||||||||||||||||||||||||||||||||||||||||||||||||||||||||||||||||||||||||||||||||||||||||||||||||||||||||||||||||||||||||||||||||||||||||||||||||||||||||||||||||||||||||||||||||||||||||||||||||||||||||||||||||||||||||||||||||||||||||||||||||||||||||||||||||||||||||||||||||||||||||||||||||||||||||||||||||||||||||||||||||||||||||||||||||||||||||||||||||||||||||
| 3 | 13.1 | Jan-1912 | 77.9 | Jul-1916 | 13.1 | Jan-1963 | 76.7 | Jul-1934 | 11.6 | Jan-1963 | 76.2 | Jul-1935 | |||||||||||||||||||||||||||||||||||||||||||||||||||||||||||||||||||||||||||||||||||||||||||||||||||||||||||||||||||||||||||||||||||||||||||||||||||||||||||||||||||||||||||||||||||||||||||||||||||||||||||||||||||||||||||||||||||||||||||||||||||||||||||||||||||||||||||||||||||||||||||||||||||||||||||||||||||||||||||||||||||||||||||||||||||||||||||||||||||||||||||||||||||||||||
| 4 | 13.2 | Jan-1918 | 77.7 | Jul-1931 | 13.4 | Feb-1978 | 76.5 | Jul-1955 | 11.7 | Feb-1904 | 76.0 | Jul-1931 | |||||||||||||||||||||||||||||||||||||||||||||||||||||||||||||||||||||||||||||||||||||||||||||||||||||||||||||||||||||||||||||||||||||||||||||||||||||||||||||||||||||||||||||||||||||||||||||||||||||||||||||||||||||||||||||||||||||||||||||||||||||||||||||||||||||||||||||||||||||||||||||||||||||||||||||||||||||||||||||||||||||||||||||||||||||||||||||||||||||||||||||||||||||||||
| 5 | 14.8 | Feb-1934 | 77.1 | Aug-1995 | 13.8 | Jan-1994 | 76.1 | Jul-1931 | 12.1 | Jan-1994 | 75.9 | Jul-1955 | |||||||||||||||||||||||||||||||||||||||||||||||||||||||||||||||||||||||||||||||||||||||||||||||||||||||||||||||||||||||||||||||||||||||||||||||||||||||||||||||||||||||||||||||||||||||||||||||||||||||||||||||||||||||||||||||||||||||||||||||||||||||||||||||||||||||||||||||||||||||||||||||||||||||||||||||||||||||||||||||||||||||||||||||||||||||||||||||||||||||||||||||||||||||||
Finally, a cooling trend in the offing??? We'll look at what the extended maps are hinting at for the rest of the summer, in a couple of days.
-----------------------------------------------------------------
How the July heat affected the rest of the country
Subscribe to:
Posts (Atom)