After beautiful spells of Indian
Summer weather in a delightful but abnormally dry autumn; there's a
change in the offing - commencing now, this mid November. Models are
progging aggressive cold fronts (of varying degrees) to drive south into much
of the country east of Rockies through the upcoming week and at least through the next weekend. The veritable "Summer to Winter" familiar narrative looks appropriate for mid month. Recent record or near record temperatures in the 60s and
70s will fall into
the 40s, 30s & 20s.
The projected 500 MB polar projection for November 2022 as of the 9th is below. Both the Polar/Arctic jet and the Pacific jet (Sub Tropical) are displayed for the the remainder of the month and I feel basically; for the winter period.
On to the Winter Outlook...
Temperatures:
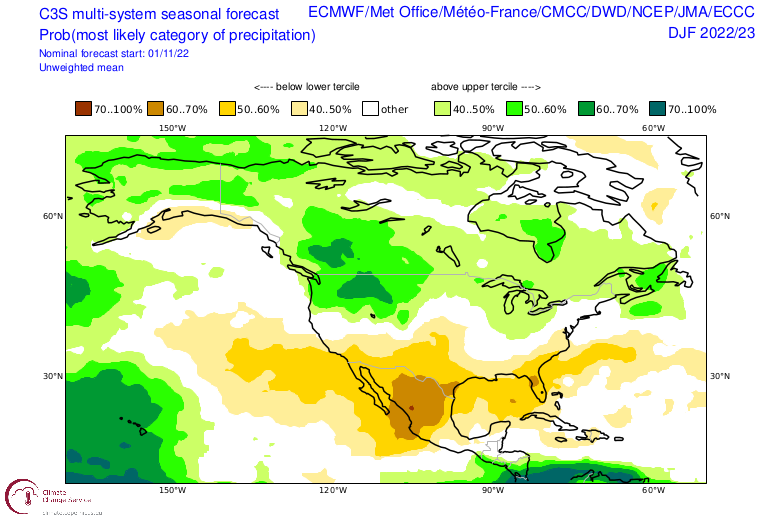
Upper Air/Surface Patterns and subsequent chosen La Nina analogues; suggest normal to slightly below normal temperatures or +1.5 to -2.0 of the new 1991-2020 norms. See analogue section for particulars.
Snowfall/Precipitation:
Upper
Air/Surface Patterns and subsequent chosen La Nina analogues; suggest
normal to locally above the new 1991-2020 norms snowfalls and
precipitation. See analogue section for particulars.
Hemispheric Layout
La Nina conditions just keep hanging around in the Pacific. So much so,
the Winter of 2022-23 will be the third consecutive La Nina winter to
occur since the first in the current set, 2020-21. In the past 130 years, this has only
happened four times since the late 1800's. Each three La Nina sets are in the following order with the third La Nina highlighted.

|
SEASON
|
|
1892-93
|
|
1893-94
|
|
1894-95
|
|
1908-09
|
|
1909-10
|
|
1910-11
|
|
1973-74
|
|
1974-75
|
|
1975-76
|
|
1998-99
|
1999-2000
|
2000-01
|
While La Nina winters have their own set of weather trends across the country; they can vary or be influenced by many other factors, sometimes to the extent they resemble little of the initial La Nina climate/weather standard trends. This is why I feel it is more important to compare "apples to apples rather than bushels to bushels" What do I mean? In my chosen and emphasized analogues; I research the timing, type, and stronger relevance to the up coming La Nina (and in this round; third La Ninas highlighted) rather than all La Nina's in the past century or so. This brings up another relevant point. The majority of La Nina's used in analysis are only since 1950. Why? Because some the data from the later period is based on measured data; especially in water temperature and departures. Instead of trying to explain why I use data at least back 100 years; I'll let the experts explain it. Please read the full article because it is interesting and explains the larger data set which goes back a "century" further to 1854 rather than 1950. The following is excerpts from NOAA Climate.gov "
ERSSTv4 goes back to 1854 (although due to a lack of observations in
the Pacific Ocean, for El Niño purposes, the dataset reliably goes back
to only 1950), and scientists have already put in a lot of time and
effort to make this dataset consistent regardless of era (2). So why do
we need another one? The easiest answer is that our seasonal climate
models don’t run just once a month, but daily. Not surprisingly, they
produce better forecasts when they are launched (we say “inititalized”)
with a more detailed, more up-to-date view of what the oceans look like
at that time.
For this situation, we want as much information as we can get it
regardless of the historical consistency. So we rely on a dataset that
combines in situ measurements with near-real-time satellite
measurements. Satellites are not equipped with magical space
thermometers that can measure the ocean temperature directly. Instead,
instruments on the satellite detect energy radiating from earth to
space. We use algorithms, physics equations and estimations to calculate
what the sea surface temperature must have been to generate the amount
of energy the satellite detected.
So the next time you want to compare the strength of this El Niño
with past historical cases, use the ERSSTv4 dataset, compiled from
buckets, boats, and buoys. That is what it was created for. But if you
want to see the smaller-scale spatial and more frequent temporal changes
of sea surface temperatures that occur within an event, OISST is more
useful.
ERSST stands for the Extended Reconstructed Sea Surface
Temperature dataset and is updated and maintained by our colleagues at
the National Centers for Environmental Information.
La Nina La Nina La Nina
Autumn thus far has contained classic La Nina weather with drier than average fall weather and normal to above temperatures. Plenty of sunshine along with average frost/freeze days rounded off the overall, pleasant weather. Checking the previous La Nina, autumns in our current set of analogues shows the past weather (Temps/Pcpn):
As we move into the winter; a weak to moderate La Nina will prevail across the Pacific and influence the climate and weather patterns over North America.
Late October La Nina SST conditions

Model La Nina Forecast
Types of La Ninas related to placement of colder, below normal Pacific water temps
Thus
far the projection for the La Nina is for the coldest departures to be
located in the central-eastern Pacific, closer to the resultant seasonal to colder winters (1st and 2nd examples).
Pacific Decadal Oscillation /PDO/ and associated subset EPO
Late October Pacific water temperatures (map 1, above) indicate closest semblance oscillation phase is currently a negative PDO. Note the negative /-PDO/ below on both collection of maps. Generally, a negative PDO coincides with a La Nina (as seen on the negative PDO anomaly pattern map).
Temperatures across Southeast Lower Michigan on the prevailing negative PDO map are normal to slightly above (last map).
Currently; the Pacific Decadal Oscillation is settling into a cool phase and is represented on the right
of the following example; and, compare it to the current state. The cool phase PDO on the right contains a large area of warmer waters extending from Japan east to the mid Northern Pacific. Waters along the Alaskan and Pacific coastline tend to cool somewhat leading to the cool phase.
Warm Phase of the PDO Cool Phase of the PDO

"When
SSTs are anomalously cool in the interior North Pacific and warm along
the Pacific Coast, and when sea level pressures are below average over
the North Pacific, the PDO has a positive value. When the climate
anomaly patterns are reversed, with warm SST anomalies in the interior
and cool SST anomalies along the North American coast, or above average
sea level pressures over the North Pacific, the PDO has a negative
value" (Courtesy of Mantua, 1999).
"The
Pacific Decadal Oscillation (PDO) is a pattern of Pacific climate
variability similar to ENSO in character, but which varies over a much
longer time scale. The PDO can remain in the same phase for up to 20 to
30 years, while ENSO cycles typically only last 6 to 18 months. The PDO,
like ENSO, consists of a warm and cool phase which alters upper level
atmospheric winds. Shifts in the PDO phase can have significant
implications for global climate, affecting Pacific and Atlantic
hurricane activity, droughts and flooding around the Pacific basin, the
productivity of marine ecosystems, and global land temperature patterns.
Experts also believe the PDO can intensify or diminish the impacts of
ENSO according to its phase. If
both ENSO and the PDO are in the same phase (as in this and last Winter of
2021-22), it is believed that El Niño/La Nina impacts may be magnified. Conversely,
if ENSO and the PDO are out of phase, it has been proposed that they
may offset one another, preventing "true" ENSO impacts from occurring".
http://jisao.washington.edu/pdo
http://www.john-daly.com/theodor/pdotrend.htm
Two years back, during the Winter of 2020-21 and our first La Nina of the current three, water temperatures of the La Nina and PDO were out of phase. As it turned out; the winter was indeed notably warmer than
what is generally seen in a La Nina winter. This possibility was mentioned in the write-up of the Winter
Outlook 2020-21 and one of the reasons noted that may interfere with the normal LA Nina
winter jet and temperature pattern.
The evolving cold phase of the PDO this fall and weak La Nina are displayed well in this recent Global SST
scan on October 29th, 2022, below.
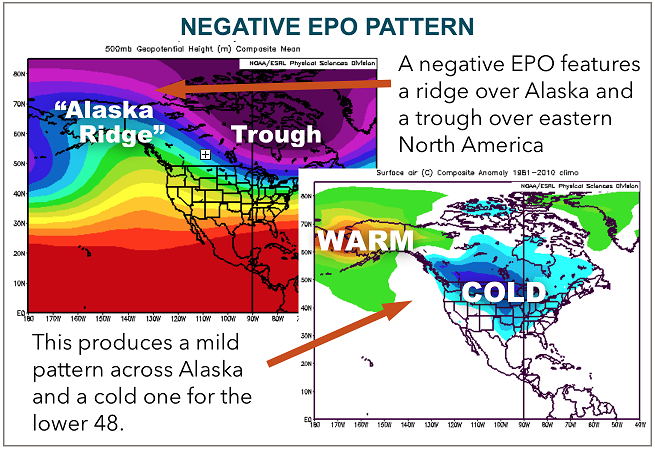
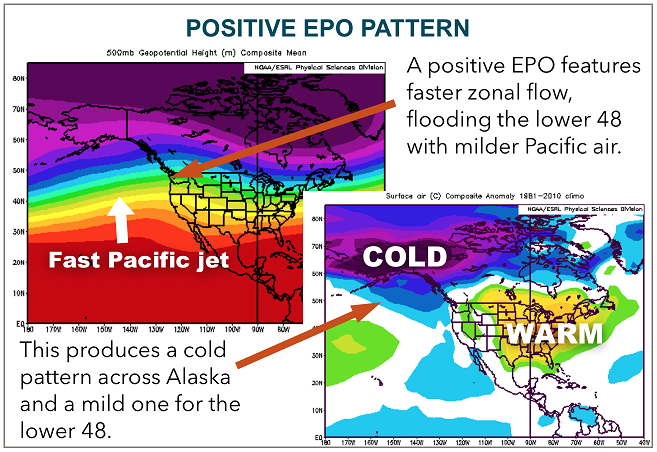
Eastern Pacific Oscillation /EPO/
The Eastern Pacific Oscillation /EPO/ is a variation
in the atmospheric flow pattern across the eastern Pacific many times into
Alaska. When the EPO is in a positive phase, mild Pacific air flows
straight into the West Coast of North America. When the EPO is in a
negative phase, a ridge forms in the upper winds along or off the West Coast over the eastern Pacific. I feel not enough emphasis is put on the EPO for the Winter Outlooks for the Great Lakes and some other regions.
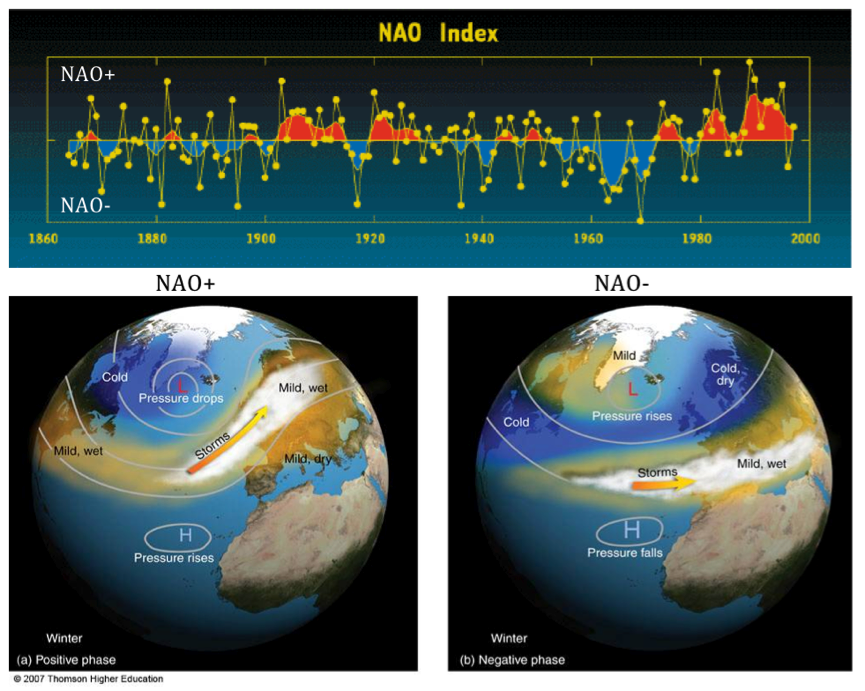
North Atlantic Oscillation/Arctic Oscillation - NAO/AO
As usual; this should be one of the most important
meteorological influences for this winter. In the last few years, it's
had an on and off again effect on our weather, working with
Stratospheric warming (delivering cold air to the surface) and the EPO. Refreshing our memory on
this little number shows why it is the major influence with our weather.
+AO(NAO) and -AO(NAO) explained:
The
Arctic Oscillation is tracked by observing 1000-millibar geopotential height
anomalies over the far upper latitudes of the Northern Hemisphere, above 20
degrees North to be specific. The AO has two phases: a positive phase, and a
negative phase. When the AO is said to be positive (+AO), geopotential height
anomalies over the upper latitudes are lower than normal. This means the
tropospheric polar vortex is stronger than normal, and this stronger vortex
“locks up” the colder air at the upper latitudes, keeping it from flowing
south. As a result, a positive AO is associated with above-normal temperatures
in the United States. When the AO is said to be negative (-AO), geopotential
height anomalies over the upper latitudes are higher than normal. This means
the tropospheric polar vortex is weaker, and enables colder air masses to flow
down to lower latitudes. As a result, a negative AO is commonly associated with
below-normal temperatures in the United States.

Generally when the NAO/AO index is in the positive phase; more
zonal winds dominate as the polar vortex lifts up toward or over it's
home, the North Pole region. However; when in a negative phase; the cold
vortex or wind flow is more meridional
and thus; cold Polar or Arctic air is readily pushed south from the
Pole; down into the eastern half of the U.S. (among other Northern
Hemisphere areas). Many times ridges of higher pressure develop in
conjunction on the North American west coast and/or into Greenland.


Siberia/Eurasia /North America Snow Cover
One of the studies by Dr. Jonah Cohen uses October
snow-cover over Siberia/Eurasia to aid in projecting out the main phase of the
NAO and likely corresponding temperature pattern for the winter. Recently, early November is also considered in the comparisons sometimes.
The snow-cover over Siberia has actually been less than average
until right at the end of October when it became slightly above normal. The first week of November was above normal.
From recent Dr Jonah Cohen
As can be seen from Figure i, the SCE was relatively
low the entire second half of the month. But please keep in mind of all
the years shown in the plot, only 2011 was below normal so, 2022 is low
relative to recent years but high compared to the long-term average.
And I have been estimating over the past month, the final number will
still likely come in slightly above normal due to the fast start to the
month.
In Figure ii, I present the timeseries for Eurasian
mean October SCE anomalies since 1979 and 2022 was slightly indeed above
normal. In fact, it is very similar to the observed values for the
past two Octobers. It is my impression that El Niño does favor a faster
advance of Eurasian SCE than La Niña, and it could be the three-peat La
Niña has suppressed the SCE the past three Octobers, albeit at
historically high values. Quasi-Biennial Oscillation /QBO/
THE QBO INFLUENCE
The QBO, or
Quasi-Biennial Oscillation, is an oscillation in the wind direction in the
stratosphere within about 15 degrees of the equator. Over a roughly two-year
period, winds tend to oscillate between westward and eastward, with the switch
between west and east winds starting high in the stratosphere and then shifting
lower in altitude with time. The QBO is the result of waves propagating
vertically in the atmosphere that then interact with the mean flow to slowly
change wind speeds and direction. These changes influence the overall global
circulation patterns, which in turn influence winter weather patterns across
North America.
If you notice on my
analogues; I included the QBO's for each available winter and compared it to
the upcoming winter's QBO phase and trend. The present and expected QBO this
winter is for a light to possibly moderate westerly wind. The set of maps below show the differing influences of the QBO
dependent on phase and trend. The QBO is presently in the light westerly (closest being maps in sequence; D).
Finally, a new kid on the block in my write-up; see the video from the Met Office in England (click on "What is the Atlantic Multidecadal (AMO). I've known about the AMO since I started my outlooks but since the effects are mainly east especially in the Winter Outlook, I left out of my discussions. Like all Oscillations; the AMO does occasionally affect the Great Lakes.
SOLAR CYCLE /SC/
Solar cycle actual effects on short term weather
and longer term climate variability remain a controversial subject. I've read
several articles which support or are against their shorter term winter
relevancy. Some theorize that both natural solar cycles and man's influence
affect our climate. I am in favor of the solar cycle being somewhat relevant
and sometimes giving the present winter cycle a "little kick" in
regard to hemispheric wind flow patterns and resulting temperatures. Numerous
recent studies for example,
do in fact make the connection to our climate and solar activity including
wintertime effects. One of the studies stated the following:
"The Euro–Atlantic sector seems to be a region with a par-
ticularly strong solar influence on the troposphere. In fact,
significant positive correlations between solar activity and
surface temperature in Europe have been reported in several
papers (e.g. Tung and Camp, 2008; Lean and Rind, 2008;
Lockwood et al., 2010; Woollings et al., 2010), although
long records tend to give very weak signals (van Olden-
borgh et al., 2013). We found a weak but significant change
in the mean late winter circulation over Europe, which re-
sults in detectable impacts on the near-surface climate. Fig-
ure 9 suggests that during solar minima more cold air is ad-
vected from the Arctic, thus resulting in a slightly increased
probability of colder winters for large parts of the continent.
Sirocko et al. (2012) recently reached the same con-
clusion after analyzing 140 yr in 20CR, although their results
are strongly dependent on their selection criteria for
the solar minimum composite (van Oldenborgh et al., 2013),
which includes only one winter for each solar cycle".
Analogue Sunspots
When reviewing the analogues; I look at where in the solar cycle the sun was in past relevant years and compare them to current sunspot cycle. Since this set of analogues are grouped with La Nina three year periods, the solar X's on the chart are averaged in the three year period.
Ironically; all of the analogue solar cycles during the three year La Nina cycles are at similar strengths as this La Nina years. The all averaged around 100 like this current set of three La Nina's. This three year cycle also averaged from around 75 to 130. Two solar cycles were on the way up and two were on the way down on the analogues. This current set of La Nina's solar cycle is positioned on the way up - like 1892-95 and 1998-2001. As far as the entire weaker solar wave; 1892-95, 1908-11 and 1973-76 are all similar.
Winter 2022-23 Analogues
Temperature, precipitation and snowfall are limited, scant or obviously missing in Flint and Saginaw and those years were excluded from averages. The columns contain a M (no data) and are shaded light purple on the chart. The questionable data is entered but shaded darker purple and again, not included in calculations and averaged.
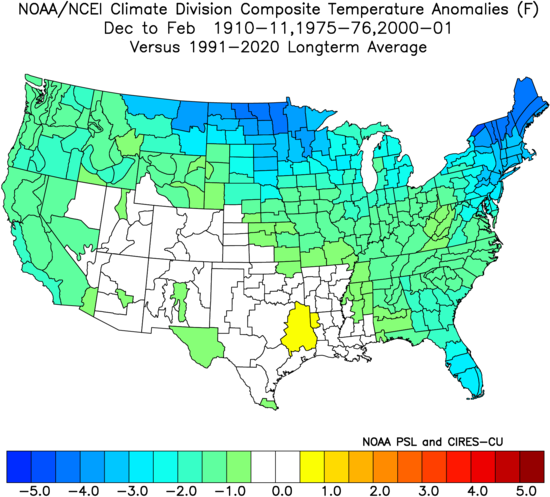
Analogue La Nina Winters - Temperatures
Analogue Third La Nina Winter - Temperatures
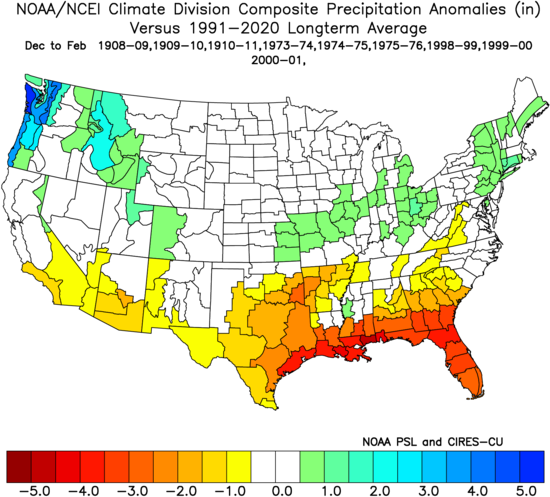
Analogue La Nina Winters - Precipitation/Snowfall
Analogue Third La Nina Winter - Precipitation/Snowfall
Analogue Findings
Late Autumn-Early Winter
If anything; the data shows quite
variable temperatures (a.k.a. roller-coaster pattern) especially month
to month or intra-month. However; one of the first things you notice is that many analogues are "front-end loaded" this time around. Aggressive cold snaps followed by moderation; some with notable snows in November and December. At this early junction; 1975-76 winter stands out at this time as being a potential "predictive analogue" for the winter - given some hemispheric/local similarities thus far. But it is way to early for any "season projection'' and why we must look at all trends and patterns in the analogues.
The last 5 Decembers have been on the mild to warm side for December; I can't vouch for this one but the analogues do suggest this December; colder than average and snowy. Out of all the analogues /12/; eight Decembers averaged below normal while seven had above normal snow. As mentioned above; this would be quite a contrast to the the past several December's temperatures. Of course; patterns usually don't fit neatly into a monthly time-table. Generally the first half of the winter, December - January seemed to be the most notable.
Mid - Late Winter - Early Spring
Mid winter on is more variable; with the entire winter temperatures averaging normal to below. With the warmer climate as of late; it also is prudent to keep that in mind as the norms have risen. While snowfalls are variable; there is a drop-off mid or late winter but with a risk of a late season storm or two. Analogues do intimate the heaviest snow for the 2022-23 season to be over central and northern areas of Southeast Lower Michigan. Basically; roughly northwest of a line from the Ann Arbor area to Port Huron (or a more typical snow layout). We shall see.
Temperatures:
Upper
Air/Surface Patterns and subsequent chosen La Nina analogues; suggest
normal to slightly below normal or +1.5 to -2.0 of the new 1991-2020
norms.
Snowfall/Precipitation:
Upper
Air/Surface Patterns and subsequent chosen La Nina analogues; suggest
normal to locally above of the new 1991-2020 norms snowfalls and
precipitation.
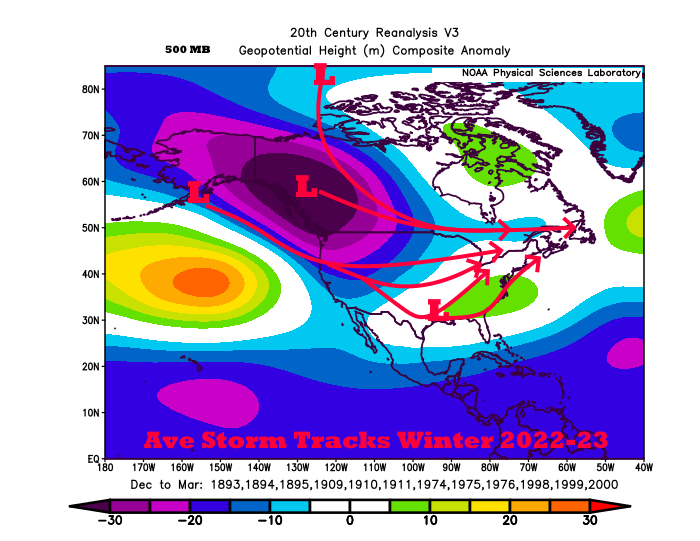
All Analogue La Nina 500mb Anomalies/Storm Tracks

Analogue Third La Nina 500mb Anomalies
Next we'll take a look at the Computer Guidance around the world for this upcoming winter
Making weather fun while we all
learn,
Bill Deedler
- SEMI_WeatherHistorian