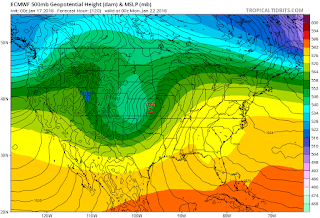
All models are projecting some storm with a variety of solutions for the exact time period. Again; the main concern here will be the map projections of the 500 MB jet and associated storm at each day interval for the next week for the time period; 00z 01/22/18. The maps will be from the 00z map projections of all three models with brief comments will be made throughout.
DAY 1; 8 days out (00z - 01/14/18 model run; Sat Jan 13 7PM)


As you note; the postings will be GFS, ECMWF & CMC
DAY 2; 7 days out (00z - 01/15/18 model run; Sun Jan 14 7PM)


General trend is slower (this continues on today's 12z also) with storm while high to the NE becoming stronger & more prevalent on most model trends. The Euro has joined the general trend with main low now further north while the GEM is the fastest with the low up in the NW Lakes.
DAY 3; 6 days out (00z - 01/16/18 model run; Mon Jan 15 7PM)


The GFS has basically held the low over E-SE Iowa while weakening it from 993 to 998 MB as the Euro actually backtracked the low to SE Nebraska/NE Kansas and also weakened the low from 990 to 996 MB. GEM has also backtracked the most dropping the low from Northern Wisconsin down to NE Missouri as pressure weakened from 995 to 1002 MB. In actual fairness, it actually elongated the low from Wisconsin down into Missouri with the center in NE Missouri and is similar in position to the GFS.


Interesting how the models subtly shift the low, sometimes similar to the former time-period of another model the day before. All focus has come around to the from the Central Plains/Western Midwest. While the GFS focuses on the Iowa/Missouri area, the Euro remains the furthest sw over E Kansas and the GEM is furthest NW in NW Iowa/NE Nebraska. The GFS hangs on to a 998 MB low intensity while the Euro weakens the low from 996 MB to 1001 MB and the GEM reverses that: deepens the low back to 997 from 1002 MB.
DAY4; 5 days out (00z - 01/16/18 model run; Tue Jan 16 7PM)


DAY 5; 4 days out (00z - 01/16/18 model run; Wed Jan 16 7PM) and GIF for the the 5 days
Since all models have converged on a Central Plains/West Midwest position and not affect SE Michigan with warm air advection snow; I've decided to end the comparison project with a GIF for each model for the 5 Days running up until 00z Thu, Wed Jan 16, 7PM.


It's very interesting to note the GFS/American model appears to have the least variance for position of the low for the same forecast hour (22/00z Jan 21, 7PM Sun) especially after Day-1. The Euro/ECMWF comes in second while the GEM was all over the place and most variant. However; it must be mentioned that the GIF cycle of the GFS contains all runs (00z,06z,12z,18z) and not just the 00z, while the Euro and Gem contain the 00z and 12z. Therefore, the GFS has the most GIF positions which can be confusing. Comparing just the 00z daily runs of all three models is the best and fairest way to look at it....which was done above for 5 days. Of course, the final analysis won't be available until the Mon, 00z when the initial run for Jan 22, 2018 is done and posted.