November's opening weather continued the chill and took on an early winter-like appeal with readings generally in the 30s and 20s; or more like Christmas in the offing rather than Thanksgiving. Then; Mother Nature has the nerve to throw us a big curve snowball on Veterans Day with a big snowstorm on top of it all - and it's still a 1/2 a month before Climate Winter even begins! With record snows and record cold temperatures has Mom Nature already shown her hand for the entire winter - or just faked us out? Well that's the past and current what about the future?
Winter Outlook for the Winter of 2019-20
Local Research and Hemispheric Data suggests:
Temperatures - Normal to Below
I expect this winter to be more typical of the "old fashion winters" seen in these parts with snow and cold breaking for a typical thaw before resuming and playing out the rest of the winter into early spring. And; the thaw wasn't always in January; a significant amount of December analogues /7/ contained above normal temperatures (some significantly - and that will be more understood when discussing the storm tracks toward the end).
Precipitation (Rain & Snow Water Equivalent) - Above
Hemispheric Discussion - ENSO
Researching through several periods of oscillating weak El La Nina-Neutral-weak El Nino left a very wide range of winter weather solutions for this winter. This is complicated by the questionable but narrow current Sea Surface Temperatures /SST/ and computer projections for the winter. The current ENSO 3.4 area continues to vary from a weak La Nina - Neutral - weak El Nino. The area of ENSO 3.4 is seen on the diagram below.


Though generally a Neutral ENSO is projected and accepted into the winter; the more "fine-tuned" weak El Nino to Neutral shown here was preferred in the analogues.

Running 3-Month Mean ONI values

Added to the annotated strong and weak El Nino's and La Nina's on the chart, are the Neutral winters included in this year's set of analogues winters from 1950 on.
Southern Oscillation
Index /SOI/
The Southern Oscillation Index /SOI/ below shows the La Nina's and El Nino's from 1880 to 2016. Remember; a negative SOI is indicative of a positive SST and ONI - or El Nino. This scaling comes into play especially pre-1950 for analogue research.
1880-2016

2000-2018

Very little additional time will be spent on the ENSO this Winter Outlook since it is expected to have the least, if any effect on our winter weather. It was used as a starting point for the analogues only and for that; it served its purpose. On to the more pertinent winter effects....
North Atlantic Oscillation/Arctic Oscillation - NAO/AO
This should be one of the important, if not the most important meteorological influences for this winter. In the last few years, it's had an on and off again effect on our weather, working with Stratospheric warming and the EPO (more later). Refreshing our memory on this little number shows WHY the major influence with our weather.
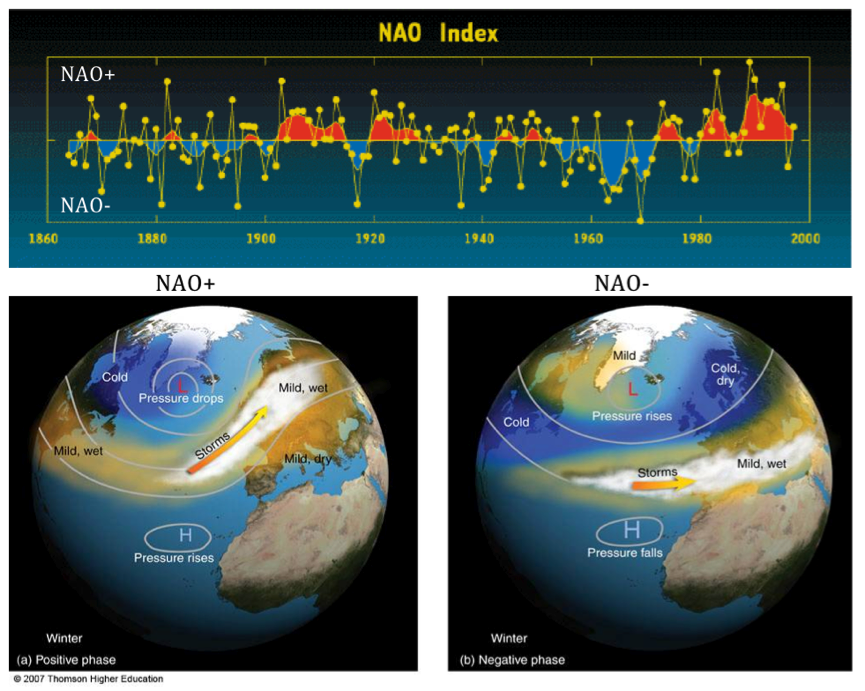
Generally when the NAO/AO index is in the positive phase; more zonal winds dominate as the polar vortex lifts up toward or over it's home, the North Pole region. However; when in a negative phase; the cold vortex or wind flow is more meridional and thus; cold Polar or Arctic air is readily pushed south from the Pole; down into the eastern half of the U.S. (among other Northern Hemisphere areas). Many times ridges of higher pressure develops in conjunction on the North American west coast and/or into Greenland.

Most winters; the phase of the NAO/AO is one of the most important ingredients to the type of winter to be had over the central and eastern part of the country. However, this is also one of the most elusive oscillations to predict for more than a week or two. One of the most impressive seen this year is the NAO/AO pattern has been primarily in a negative phase since the summer. While the NAO has been more negative; the AO has held in a fairly tight range around neutral.


Note the drop "off the cliff" the AO forecast projected mid month. This jived well with the Arctic cold that has been over the eastern half of the country mid month.
Pacific Decadal Oscillation /PDO/ and associated subset EPO
The warm phase of the Pacific Decadal Oscillation is represented on the left side of the following example and the cold phase on the right.
Warm Phase of the PDO Cool Phase of the PDO

Latest SST's (below) seemed to have evolved into a cool phase recently. Note the above or well above normal SST's around Alaska and south over the mid Pacific. Relatively cooler anomalies have formed further inland along the West Coast.
The warmer SST's further off the West Coast south of Alaska; generally encourages high pressure ridging which may help at times, deliver Polar and Arctic air from the northern Canadian regions into the Lakes. This was especially true during the hard, snowy winter of 2013-14 where the NAO was not always negative.

A negative Eastern Pacific Oscillation /-EPO/ is displayed below along with its cold affects it can have downwind on North America. The Winter of 2013-14 was one cold, bitter winter along with exceptionally heavy amounts of snow across Southeast Lower Michigan. The brutal cold delivered to the region on many occasions was either the cause or was aided by a strong -EPO helping to build a strong high pressure ridge on the West Coast which in turn; slammed our region with a deep low pressure trough filled with cross polar air from Siberia and North Pole.

Likewise; a positive Eastern Pacific Oscillation /+EPO/ pattern is displayed below along with its mild affects it can have downwind on North America.

A three-way indices pattern /NAO, AO and EPO/ evolving together can have interesting weather for the eastern half of the country as stated below;

Pacific/North American /PNA/ Pattern
The above oscillations help create the Pacific/North American /PNA/ pattern. A negative PNA generally reflects a trough over the western portion of the US with ridging and warmer weather in the East. A positive PNA is reflected by a broadening trough and influx of colder air into the center and subsequently, the eastern portion of the US.
-PNA


Solar Cycle Relevance

This year's solar sunspot cycle; at the bottom of the 24th cycle.

Siberia/Eurasia Snow Cover
The snow accumulation study over Siberia and northern North America over Canada. Both of these have been above normal, especially late October into November. The study is mainly concerned with October's snowfall. The best data goes back into the 1990s which doesn't help our analogues much since (see analogue Siberia snowfall column) only one exists in that time period but it's certainly notable to look at for recent winters. These charts go back to the Winter 2005-06 and also then, would encompass some notable winters locally.
The red line represents this fall on both charts thru 11/17/19. While snow over Eurasia is now just about average; the snowfall over North America had surged to near record amount (for this time period since 2005-06) recently with the expansive snowcover last week before a pull back the last few days.

If you notice on my analogues; I included the QBO's for each available winter and compared it to the upcoming winter's QBO phase and trend. The present and expected QBO this winter is for a lighter westerly wind to gradually shift to a light easterly QBO. The set of maps below show the differing influences of the QBO dependent on phase and trend. The QBO is presently in the weakening westerly and trending into a weak easterly (closest being maps in sequence; C then A).

WINTER 2019-20 ANALOGUES
If the month of November was all that the analogues had to project, we'd be looking great with over half colder than average and 12 out of 15 snowier than normal; some substantially above normal - like this year. The actual Winter Outlook via analogues into early spring is generally quite diverse but with a trend suggested on the Temperature and Precipitation stated at the beginning of this forecast. Also with the variance in temperatures; mixed precipitation will be quite likely.
Decembers
-There is also a strong conflict in December temperature results with 7 above normal and 7 below
normal and only 1 normal. Not surprising; the sum and average of all; leads to a normal or
average temperature for December. Therefore; the analogues concluded anything goes for
December, temperature-wise and...
-Snowfalls too, were quite variable and averaged on normal but with quite a few below normal and
almost as many above. Again no preference.
Januarys
-While temperature patterns showed colder weather dominated with 8 out of 15 colder than average; still a notable 5 Januarys were warmer and just a few normal. I suspect several of the warmer Januarys contained thaws. Therefore; it was concluded a notable thaw or two seem more plausible and likely - like many winters .
-Snowfalls in January were quite variable -like the winters on the whole- but the sample averaged below normal by a couple of inches, giving a bit more credence to a lighter January and thaw.
Februarys
The coldest of the winter weather is projected during the second half - January into February or February-March. One of the more definitive patterns seen is the evolution of this colder weather with time with February having the best chance of below normal temperatures and...some hefty snowfalls and extremely light ones averaging out to normal.
March/April
-Snowfalls picked up late in the season; averaging above in April.

Some additional analogue conclusions and category explanations in the analogue chart
AO/SC
AO - The predominant phase of the Arctic Oscillation during that winter. AO- (negative), AOn (neutral) or AO+ (positive).
SC - position of the solar cycle during that winter. Breaking it down (see solar cycle chart):
SC-- (opposite high cycle compared to the present, least similar) SC+/- (sunspots
waning but not near minimum or 2019 low level. Finally, S++ where solar sunspot cycle is at or very close to the low cycle of 2019-20 and/or is at the same decline with 2019...the best comparison and likeness. There are several this time at 8, one of the highest likes - meaning the sunspot phase of the sun is very close to 8 other analogues out of the 15.
QBO - W=West wind prevailed that winter or E=East wind prevailed. Trends: -/- (weak and weakening trend), -/+ (weak but strengthening), s (steady trend, no change) +
moderate and strengthening +/- strong but weakening. Note that the trend now in the fall of 2019 is W-, a light west wind and weakening and subsequently, should become light east /E-/. This fits with all the analogue winter's that contained a light westerly to easterly QBO. Those winters were the Winter of 1898-99, 1926-27 and to a lesser extent 1946-47.
Sib snow - Siberian snow cover in October and rate of change. Only one previous analogue winter had below compared to this past October's/early November since the data only goes back to the late 1990s. Notations are this fall compared to analogue fall: WA=Way above, A= above, B=below, % = equal to.
Letter n /next to the analogue winter years at Detroit/ - A cold November preceded these winters in all of Southeast Lower Michigan - like this present November 2019. Interesting, out of the 15 analogues; more than half /8/ were also preceded by a cold November - a solid number. In, the other winter years; the temperatures in November were normal or above normal temperature.
Snowy November was almost a given in the analogues!
-Another very notable category was included; the prevalence of snowy Novembers at the largest analogue sample, Detroit - 15 analogues. The above normal snowfalls are highlighted in yellow. The well above normal snowfalls (better than 3x the normal )were highlighted in green. An outstanding 12 out of 15 Novembers contained above normal snow and out of those 12; half or 6 contained well above normal snowfall, like this November. Clearly this is a winner this season already.
-Snowy November didn't always mean a snowy winter
Extrapolating the well above normal snowfalls in November did not always translate to a snowy (above normal snow) for the winter. Out of the 6 well above normal snowy Novembers; half continued to be a snowy winter with the other half /3/ having one normal and two below normal.
Comparing the analogue year 500 anomalies to the ENSO Neutral years shows some interesting comparisons.


Here are the composite maps of the specific analogue chosen and general neutral years. Note the scales are slightly different (analogue 1/2 degree and -5/+5 departure as opposed to Neutral years 1/2 degree and -3/+3 departure).
Note the coldest of the weather is centered further west in the analogue temperatures compared to general neutral years but overall the patterns are similar.


In the composite precipitation maps; the analogue years show the core of the heavier snow and rainfall further north and west toward the Upper Ohio Valley and occasionally Lower Lakes as opposed to the general neutral years further south. This would imply more Ohio Valley Lows to the East Coast rather than Tennessee Valley systems to the East Coast. Both would be indicative of some Gulf/Texas Lows.


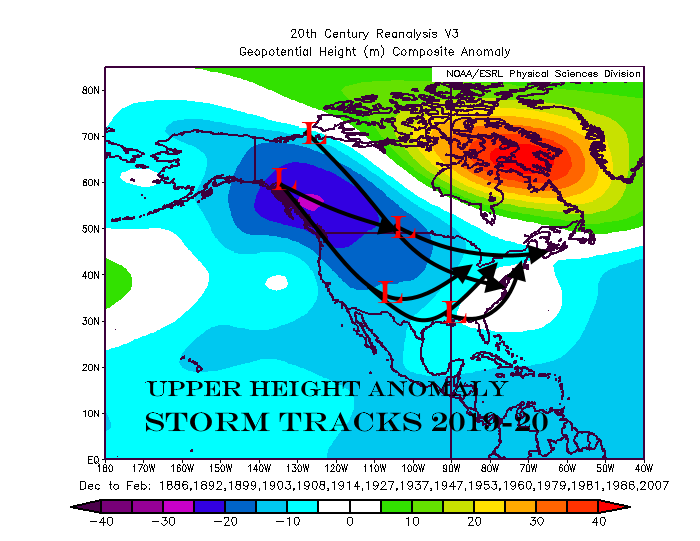
Mean 700 MB Flow forecast from computer CFSv2

Subsequent Storm Tracks
Storm tracks should focus from western Canada southeast into the Upper Great Lakes to Southern Plains and Gulf States. Besides the typical Polar/Arctic storm track across the northern Lakes; two other storm tracks across the western Lakes and the eastern Lower Lakes will determine our rain or snow. These originate over the southern plains/Texas/Arkansas area and potential lies for classic Gulf lows deepening on sharp trough orientation up the Ohio Valley or East Coast.
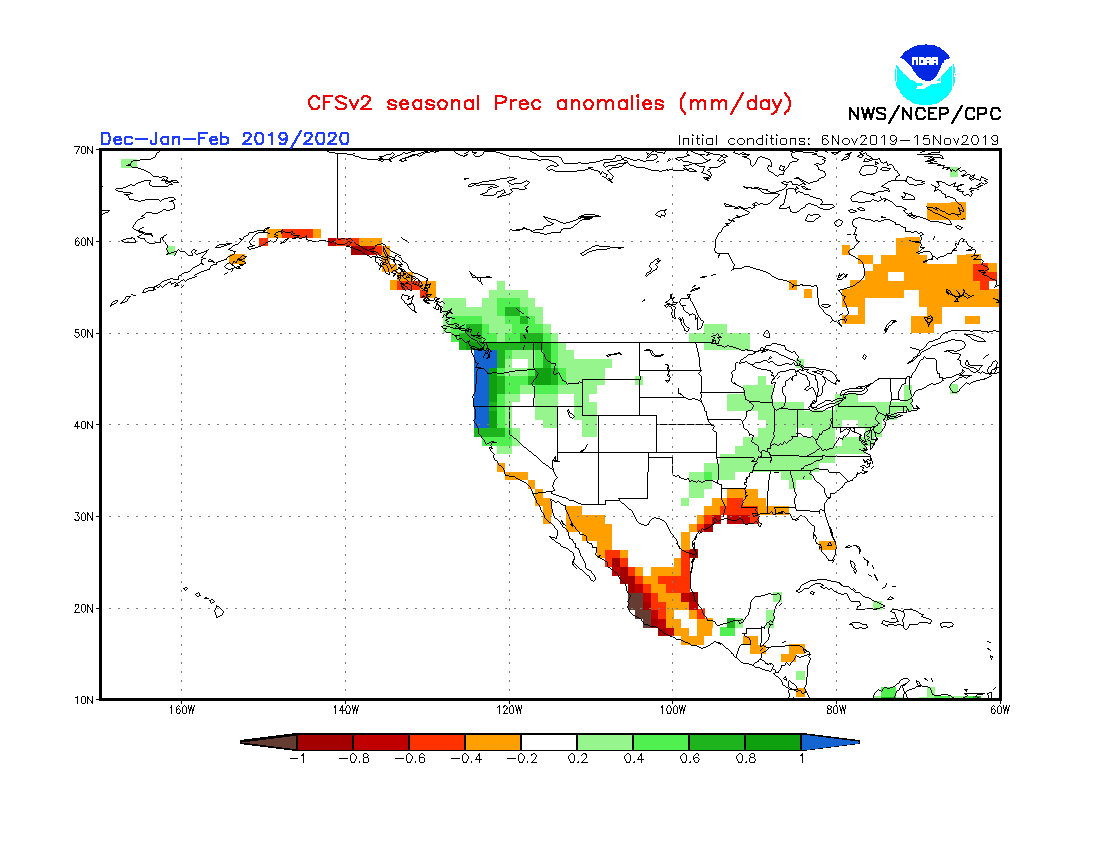
Latest Global Model Output for the Winter of 2019-20 (Temps and Precip)
U.S.A

European


British


France


German


Canadian


Bill Deedler - SEMI_WeatherHistorian