While there are generally many influences on our winter weather; this winter has an infrequent addition - what "type" of El Nino will be a key player in our hemispheric circulation? That's right, while generally a weak, moderate or strong El Nino is the question; this winter it's more the case will we have a normal weak-moderate /+0.5-1.2/ El Nino or a Modoki El Nino?
Modoki is Japanese for “same but different,” and this is indeed the case. El Nino Modoki events are a rarer subset of regular El Nino’s, and are marked by warming water in the Pacific, but not along the Equator. Instead, the warming is more focused in the mid-Pacific-equator area and the warming is generally not as strong as in regular El Nino events. Sometimes in a moderate-strong Modoki, water actually cools below normal off the coast of Peru, which is the opposite of a normal El Nino event (and what you see in a La Nina event).
Several studies have shown that the ENSO Modoki has become more prominent in recent times (also evidenced by my analogues), as compared to ENSO, and thereby changing the teleconnection pattern arising from the tropical Pacific.
Summer into Autumn
While the summer months in 2018 had some notable weather; to a large extent the summer was fairly tranquil with just the occasional upset in the pattern. The most radical but not that all atypical change occurred in October with the sharp contrasts in temperature resulting in change of jet stream from the first half to the second. Again, this is an intermittent enough pattern (against the more gradual stair-step down temperature pattern). I've written about radical jet and temperature pattern changes in October and sometimes later in November. This can set the stage for a very volatile up and down temperature cycle into the winter or continue the trend of below to well below temperatures. This fall has been extremely wet; the 3rd wettest at 13.03" as of November 25th. What's been somewhat gratifying yet a bit uneasy for me is how well the present mid-fall pattern fits into the upcoming winter pattern I found for this; my 22nd Winter Outlook.
Note: I will continue the changes made last year in my Outlook for my third decade of season outlook forecasting. They include an even more thorough analogue chart including previously mentioned patterns in the past such as: Autumnal patterns, Arctic Oscillations, Solar and QBO cycles along with Siberian/Eurasia October snow cover (available since 1998) during the previous analogue winters. This in turn is compared to the upcoming Winter of 2018-19's observed or projected patterns. Therefore, much of the information discussed is there for the reader to quickly scan on the chart. I still will provide a brief summary of each indicator but limit the amount of description, while still occasionally connecting the reader to the corresponding website. The overall, Winter Outlook format remains the same as presented in the past. Now on to the Outlook...
Winter Outlook for the Winter of 2018-19
Local Research and Hemispheric Data along with current modeling suggests:
Temperatures - Normal to Below
As
with the majority of winters; look for temperatures during the
2018-2019 winter to be quite changeable as opposing air masses via for
dominance under a fluctuating jet stream. The ongoing pattern recently
experienced this fall is also telegraphed in the Winter Analogues for
2018-19.
Various
computer guidance for the upcoming winter is also having difficulty
with what type of El Nino will occur (see model section). While
analogues and some models suggest an atypical El Nino pattern, my
research also confirms this with colder temperatures than what is
typical. I believe during this winter; the Pacific jet will be fighting
against a sometimes more impressive colder northern Polar/Arctic Jet
coming in from Canada. This winter's analogues are strongly suggesting a normal to below normal temperature winter is at hand with the clear majority pointing in that direction (see Analogues, below).
In the final analysis; I look for Southeast Lower Michigan winter temperatures to average +1.0F to -3.5F of normal
Precipitation (Rain & Snow water equivalent) - Normal to Below
While
jet stream pattern has been busy as of late; as the El Nino
sub-tropical jet rev's up into the winter, this is likely to drag the
southern, wetter storm track south of the Lakes into the Ohio valley and
points south and east - up the Coast. Most analogues and models
suggest a drier than average winter. Keep in mind however; many times we have a below normal precipitation amount with normal or even above normal snowfalls.
Note: Below normal precipitation; more than /- 1.0"/ of the winter average water equivalent. Normal
precipitation; +/- 1.0" of the winter average water equivalent and
above normal precipitation; better than /+1.0"/ of water equivalent
above the average.
Snowfall - Normal
The
especially tricky part of this forecast is how much of the expected
precipitation will be snow and where the storm tracks set up. In the
analogues: snowfall in many of the earlier winters ranged from below normal; to a few well above normal in the later winters. This
is especially true over the southern sections of Southeast Michigan
where a hint of above normal shows up the best. This make perfect sense
since the main southern storm track will be closer to that area. Adding
more to the complexity is that the later year Analogues (most after
2000) contain the above normal snows, which clouds the prognostication
picture even more. On the flip-side; below normal snows could certainly occur especially if the storm track rides further south as was the case in several of the early winters. And, it's been quite sometime since we've experienced a cold, dry winter. At this early juncture however; normal snowfall seems most suitable.
Note - Below Normal snowfall; less than /- 5.0"/ of the winter average snowfall. Normal
snowfall; +/- 5.0" of the winter average snowfall and above Normal
snowfall; better than /+5.0"/ of snow above the average.
Hemispheric Discussion
In case you haven't surmised by now; the upcoming winter is expected to contain a weak to possibly moderate El Nino in the Pacific - likely a Modoki El Nino. The analogue winters in this year's study are underlined below. For more on categorization of ENSO; see the following.
El Niño
| ||||
Weak - 10
|
Moderate - 7
|
Strong - 5
|
Very Strong - 3
| |
1952-53
|
1951-52
|
1957-58
|
1982-83
| |
1953-54
|
1963-64
|
1965-66
|
1997-98
| |
1958-59
|
1968-69
|
1972-73
|
2015-16
| |
1969-70
|
1986-87
|
1987-88
| ||
1976-77
|
1994-95
|
1991-92
| ||
1977-78
|
2002-03
| |||
1979-80
|
2009-10
| |||
2004-05
| ||||
2006-07
| ||||
2014-15
| ||||
ENSO Regions in the Pacific

Current ENSO map conditions as of mid November 2018

Current SST anomalies /departures/ as of mid November

While developing the El Nino; the CFS model has suggested a more typical El Nino (or mixed) rather than just a Modoki. Note the warmer departures over the central Pacific and near the coast of South America.

While the foreign models have generally held with a forecast of a Modoki El Nino this fall, especially the UK MET which actually intimates a moderate Modoki. Note the strong warm SST anomalies along the West Coast especially in Northwest Canada into Alaska. This would encourage ridging along the coast and thus; a negative PNA pattern inland in the Great Plains and Midwest and ridging in the Southeast. The ridging in the Southeast would also be encouraged by the warmer SST anomalies in the western Atlantic.
Foreign Consensus

UK

The Oceanic Nino Index /ONI/ 1950 - mid 2018 below; shows all the El Nino's and La Nina's strong and moderate whereas the weak are not depicted except for last winter's 2017-18. Latest indicated is this Summer's ONI.
ONI

SOI
The
Southern Oscillation Index /SOI/ below shows the La Nina's and El Nino's from 1880 to 2016. Remember; a negative SOI is indicative of a positive SST and ONI - or El Nino. This scaling comes into play especially pre-1950 for analogue research.

SOI, Modoki El Nino Analogues before 1950 "pre-ONI"


North Atlantic/Arctic Oscillation - NAO/AO


Most
winters; the phase of the NAO/AO is one of the most important
ingredients to the type of winter to be had over the central and eastern
part of the country. This is one of the most elusive oscillations to predict
for more than a week or two. One of the most impressive changes this fall occurred in the NAO/AO pattern. Note the strong, persistent positive phase of the NAO/AO from the summer into mid October. After; the dramatic shift to neutral and then; the negative phase seen into mid November. Below is that trace of the NAO/AO since mid July 2018...and prediction out into early December. Will this negative change a possible projection into the winter, a variable mixed projection or back to a positive state?


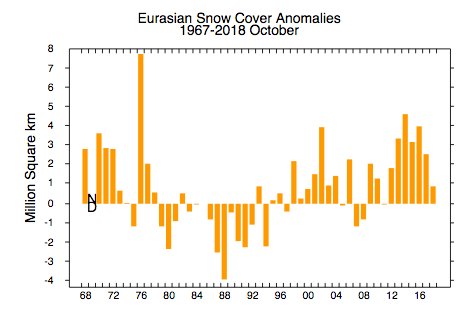
Siberia/Eurasia Snow Cover
One
of the newer studies by Dr. Jonah Cohen uses October snow-cover over Siberia/Eurasia to
aid in projecting out the main phase of the NAO and likely corresponding
temperature pattern for the winter. In my analogues;
I've included this past October's coverage and considering the rate of
coverage compared to that of the Modoki analogues researched since 1998. In the analogues; you
will notice a % sign for this years coverage and a plus sign, negative sign or same /%/ compared to previous Octobers. Results show;
this October had been slower to accumulate snow-cover over that region than some of the
analogue years. Therefore; the analogue years since 1998 that had less snow cover than this year
are /-/ or more than this October are /+/.
There is a unusual caveat to this fall's snow cover; occurring at the close of October into the first few days of November. The area saw a marked increase in snow cover in that short time. From Dr Jonah Cohen's Twitter posts...
"Here is the final tally for daily October#Siberian #snow cover extent. Weak start and for most of the month but strong finish. Which will turn out to be the best predictor for this #winter, the start or the finish"?
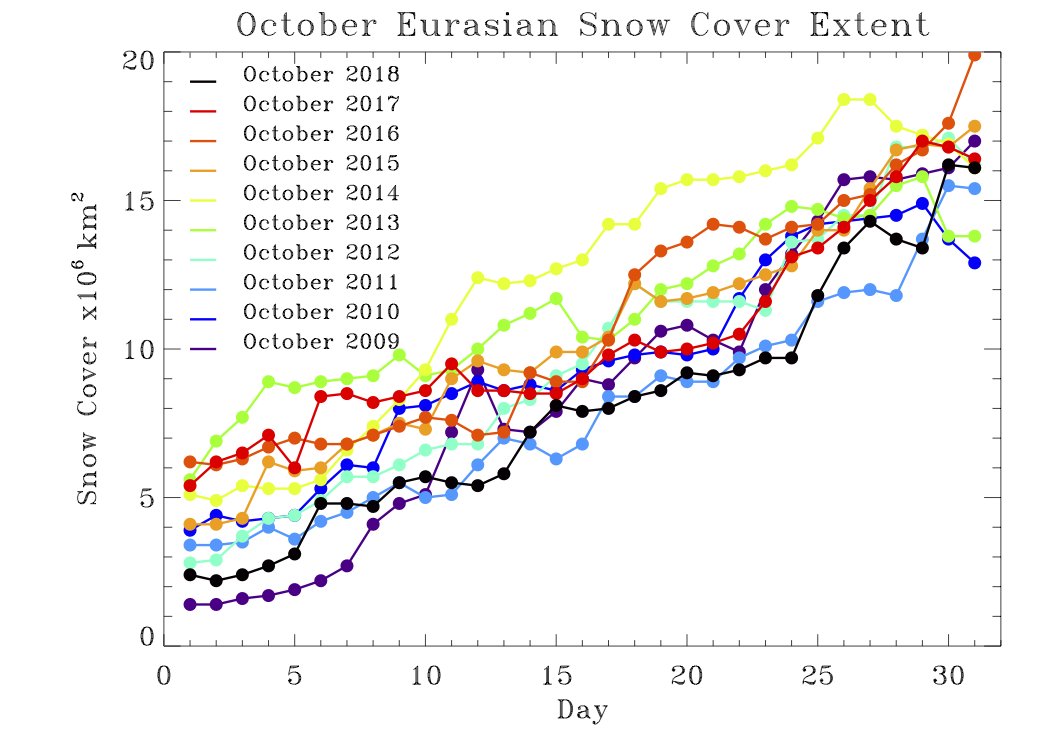 "I just checked the Rutgers Global Snow Lab site for the official tally and Eurasian October
 #snow cover extent is considerably higher than my own estimate (though still lower than most recent years). Maybe time to gas up the snowblower"!
There is a unusual caveat to this fall's snow cover; occurring at the close of October into the first few days of November. The area saw a marked increase in snow cover in that short time. From Dr Jonah Cohen's Twitter posts...
"Here is the final tally for daily October
"I just checked the Rutgers Global Snow Lab site for the official tally and Eurasian October This update in more snow cover and the larger than average snow cover over Canada may signal a likelihood of a -NAO/-AO prevailing this winter and thus; colder temperatures.
Here is the latest snow covers at both Siberia/Eurasia and North America as of November 18th 2018 (both in red traces). As you can see, this years North America trace is a close second to 2014 for a high since 2005-06.

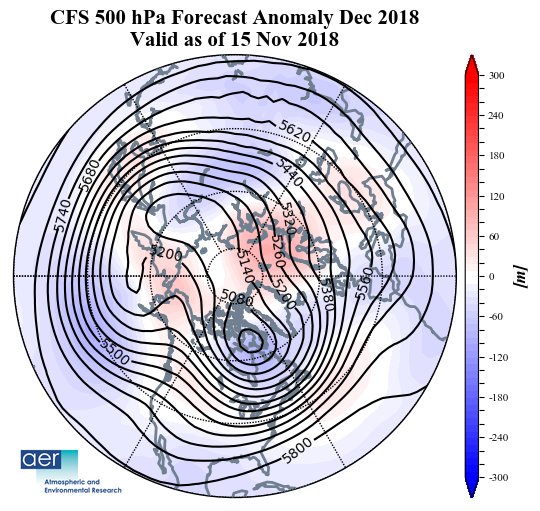
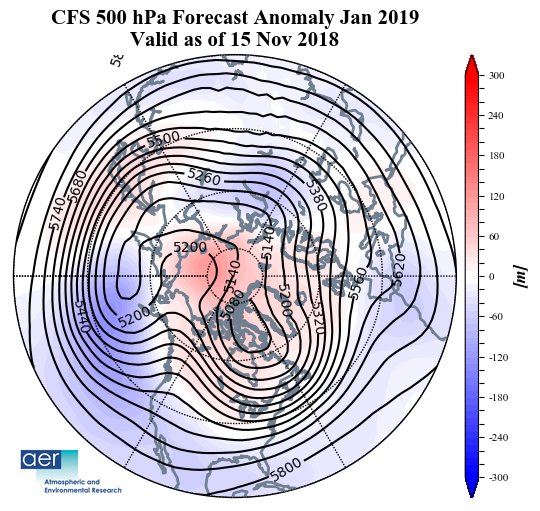
Dr. Cohen also notes the latest CFS 500MB projections into through December and January - below normal heights. Be advised these change frequently and should never be taken as gospel, especially this far out.
https://twitter.com/judah47/status/1063078283359805440
https://twitter.com/judah47/status/1063078283359805440
Mr. Cohen has a nice update here every week on current and expected trends - and a Twitter account.
Pacific Decadal Oscillation /PDO/ and associated subset EPO
The previous warm phase Pacific Decadal Oscillation recently switched to a cool phase last year and it appears now to be reverting back to the warm phase. A warm phase of the PDO is represented on the left side of the following example and can be compared it to the current state. Note the above or well above normal SST's along the west coast into Alaska and relatively cooler anomalies areas forming further out in the mid Pacific. The warmer SST's nearer the West coast generally encourages high pressure ridging which may help at times, deliver Polar and Arctic air from the northern Canadian regions into the Lakes. This was especially true during the hard, snowy winter of 2013-14 where the NAO was not always negative.
Warm Phase of the PDO Cool Phase of the PDO


Generally warm
phases coincide with El Ninos or Neutral states and rarely La Nina
states while cool phases coincide with La Ninas. Studies propose that when the PDO and ENSO are out of phase;
which is a somewhat rare event, that they may cancel out their known
effects. This isn't expected to happen during the upcoming winter. If both ENSO and the PDO are in the same phase, it is believed that El Niño/La Nina impacts may be magnified. Conversely,
if ENSO and the PDO are out of phase, it has been proposed that they
may offset one another, preventing "true" ENSO impacts from occurring".

THE QBO INFLUENCE
The
QBO, or Quasi-Biennial Oscillation, is an oscillation in the wind
direction in the stratosphere within about 15 degrees of the equator.
Over a roughly two-year period, winds tend to oscillate between westward
and eastward, with the switch between west and east winds starting high
in the stratosphere and then shifting lower in altitude with time. The
QBO is the result of waves propagating vertically in the atmosphere that
then interact with the mean flow to slowly change wind speeds and
direction. These changes influence the overall global circulation
patterns, which in turn influence winter weather patterns across North
America.
The
amplitude of the easterly phase is about twice as strong as that of the
westerly phase. At the top of the vertical QBO domain, easterlies
dominate, while at the bottom, westerlies are more likely to be found.
At the 30mb level, with regards to monthly mean zonal winds, the
strongest recorded easterly was 29.55 m/s in November 2005 and just this past summer at 29.05m/s, while the
strongest recorded westerly was only 15.62 m/s in June 1995 (Wikipedia).
If
you notice on my analogues; I included the QBO's for each available
winter and compared it to the upcoming winter's QBO phase and trend. The
present and expected QBO this winter is for a lighter easterly QBO shifting to light west. The set of maps below show the
differing influences of the QBO dependent on phase and trend. The QBO is
presently in the weakening easterly and trending into a weak westerly (closest being map-B).
SOLAR CYCLE /SC/
Solar
cycle actual effects on short term weather and longer term climate
variability remain a controversial subject. I've read several articles
which support or are against their shorter term winter relevancy. Some
theorize that both natural
solar cycles and man's influence affect our climate. I am in favor of
the solar cycle being somewhat relevant and sometimes giving the present
winter cycle a "little kick" in regard to hemispheric wind flow patterns and resulting temperatures. Numerous recent studies for
example, do in fact make the connection to our climate and solar
activity including wintertime effects. One of the studies stated the
following:
The Euro–Atlantic sector seems to be a region with a particularly strong solar influence on the troposphere. In fact, significant positive correlations between solar activity and surface temperature in Europe have been reported in several papers (e.g. Tung and Camp, 2008; Lean and Rind, 2008; Lockwood et al., 2010; Woollings et al., 2010), although long records tend to give very weak signals (van Oldenborgh et al., 2013). We found a weak but significant change in the mean late winter circulation over Europe, which results in detectable impacts on the near-surface climate. Figure 9 suggests that during solar minima more cold air is ad- vected from the Arctic, thus resulting in a slightly increased probability of colder winters for large parts of the continent. Sirocko et al. (2012) recently reached the same con clusion after analyzing 140 yr in 20CR, although their results bare strongly dependent on their selection criteria for the solar minimum composite (van Oldenborgh et al., 2013), which includes only one winter for each solar cycle".
Comparing
solar cycles of the past analogue winters to the present is a possible
influence only and not a major contributor. While the solar cycle was in
various modes, the tendency is for La Nina's to Neutral winters
to occur during the mid to lower part of the cycle or during an overall,
weaker cycle.This season's El Nino analogues resulted in about half in the lower part of the sunspot cycle.
Longer Term Solar Sunspot Activity since 1849 (includes this season's Winter Analogues)

Closest winter position in the solar cycle to 2018-19 in descending order; 1976-77, 2009-10, 1914-15, 1986-87, 1963-64 and 2006-07.

Closest winter position in the solar cycle to 2018-19 in descending order; 1976-77, 2009-10, 1914-15, 1986-87, 1963-64 and 2006-07.
Recent Sunspot chart since the new millennium

WINTER 2017-18 ANALOGUES - SOUTHEAST MICHIGAN

CLICK ON TO ENLARGE
Some additional category explanations in the analogue chart from left to right
AO/SC
AO - The predominant phase of the Arctic Oscillation during that winter. AO- (negative), AOn (neutral) or AO+ (positive).
SC - position of the solar cycle during that winter. Breaking it down (see solar cycle chart):
SC-- (opposite high cycle compared to the present, least similar) SC+/- (sunspots
waning but not near minimum or 2018 low level. Finally, S++ where solar sunspot cycle is at or very close to the low cycle of 2018-19 and/or is at the same decline with 2018...the best comparison and likeness.
QBO - W=West wind prevailed that winter or E=East wind prevailed. Trends: -/- (weak and weakening trend), -/+ (weak but strengthening), s (steady trend, no change) +
moderate and strengthening +/- strong but weakening. Note that the trend now in the fall of 2018 is E-, a light east wind and weakening and subsequently, becomes light west. This fits with all the winter's that contained a light easterly to west QBO. Those winters were the Winter of 1963-64, 1968-69 and 1994-95
Sib snow - Siberian snow cover in October and rate of change. All previous analogues winters had mixed snow covers compared to this past October's/early November. Notations: WA=Way above, A= above, B=below, % = equal to.
Letter n /next to the analogue winter years at Detroit/ - A cold November preceded these winters in all of Southeast Lower Michigan - like this present November. Interesting, half of the winters were also preceded by a cold November. In, the other winter years; the temperatures in November were normal or above normal temperature. Next to the years under Precipitation column /Detroit/; you will notice a "m" next to seven of the years; that indicates a below normal, cold March.
WINTER ANALOGUE SUMMARY
Temperatures
One of the first things one notices about this winter's analogues is the majority of normal to below normal temperatures and drier precedence of total precipitation. While there were some above normal temperature winters; clearly normal to below normal (including subsequent temperature departures) prevailed. The thick of the winter seems to come in the mid-later part of the winter. December's temperatures were quite variable ranging from 21.5 - 12/1976 /5th coldest/ to 37.4 -12/2006 /6th warmest. Yes, quite a range indeed! Unlike the other winter months, December had quite a few years with above normal temperatures. Detroit alone, saw five Decembers where averages fell in the 30s /norm 30.1/. December of 2006 was one of the warmest December's on record with 37.4 /6th warmest/. Chances for colder, below average temperatures increase somewhat as we move into the mid to later winter on a departure basis.
While mentioning December of '76, the Winter of 76-'77 was a brutally cold (by far the coldest in the sample) and a relatively dry winter in Southeast Lower Michigan. While drier than average; since nearly all the precipitation fell as snow, normal amounts of snow were generally observed. That winter too, saw the lull of the solar sunspot cyle and was a weak Modoki winter. Snowfall in October '76 superseded any of the other snow covers in the Eurasia area and was preceded by a cool November (in fact, a notably cool fall). At this time, I don't see anything nearly this cold for this winter but there are enough similarities to keep it alive.
Another stand-out in the winters, is the more recent Winter of 2002-03. A cold and snowy winter was had over much of the Great Lakes and especially along the East Coast. It too was preceded by a cool November but was not in the lull of the solar cycle.
Precipitation and Snowfall
Generally with precipitation (both rain and snow); below average amounts dominated. However; there were just enough above normal precipitations and snowfalls to seriously consider - being most occurred in more recent winters. This fall's rainfall /13.03" thus far/ matches well for the wet fall that occurred in 1986 /"12.45"/ in Detroit This precipitation pattern also lines up with our present fall wetter pattern and with our snowy November. As stated before, half of the Novembers that preceded the analogue winters were below normal temperatures - or notably cool. Another item in that same vein of an early start to winter is that all locations averaged above normal snow in November in the analogues - and indeed in this November, also.
As a side note: the November analogues snow's climaxed with the the infamous Armistice Day Storm of 1940! "But perhaps the most embarrassing revelation was that no one was watching the storm's explosive development in the pre-dawn hours of November 11. A retired government forecaster says the Midwest headquarters in Chicago was not staffed overnight. The uproar led to several changes. The Chicago office went to round-the-clock operation and the Twin Cities branch was upgraded so it could issue forecasts'. Now we know when Chicago NWS went 24 hour operation and here is the history of Detroit's.
Decembers received a variety of snow but six averaged below normal; the rest normal to above. Actually; all months had quite a number of below normal snows with somewhat less above normal which lead to the slightly below normal winter snows. As always the main thing we are concerned with are the snowfall trends of the winters and to a lesser extent; the snowfall totals. The trend was for normal but on the lighter side and thus far; following the trend with a cold and snowy November.
Below are the maps from the analogue winters for Temperature departures, 500MB Low placement and subsequent likely storm track placement (Nov-Mar). Note the time period encompasses March also (still a winter month in my book). The El Nino pattern aided by blocking in the northern latitudes leaves Southeast Lower Michigan below average. Larger departures in the deep south reflect the colder air is able to push well south.


Storms tracks across the Great Lakes and points south and east should prove interesting. The track projected over the region should vary enough to bring snow and/or mixed precipitation along with rain to Southeast Michigan - like most winters. As warmer air masses are able to push north with troughing west, look for the track to veer to the north and west. Likewise; as colder air engulfs the region and troughing forms southwest and south, the track shoots lows northeast and east into the Lower Lakes and Ohio Valley and points south and east.


PCPN


The European is the driest of the patterns for extent.

Making weather fun while we all learn,
Bill Deedler - SEMI_WeatherHistorian
One of the first things one notices about this winter's analogues is the majority of normal to below normal temperatures and drier precedence of total precipitation. While there were some above normal temperature winters; clearly normal to below normal (including subsequent temperature departures) prevailed. The thick of the winter seems to come in the mid-later part of the winter. December's temperatures were quite variable ranging from 21.5 - 12/1976 /5th coldest/ to 37.4 -12/2006 /6th warmest. Yes, quite a range indeed! Unlike the other winter months, December had quite a few years with above normal temperatures. Detroit alone, saw five Decembers where averages fell in the 30s /norm 30.1/. December of 2006 was one of the warmest December's on record with 37.4 /6th warmest/. Chances for colder, below average temperatures increase somewhat as we move into the mid to later winter on a departure basis.
While mentioning December of '76, the Winter of 76-'77 was a brutally cold (by far the coldest in the sample) and a relatively dry winter in Southeast Lower Michigan. While drier than average; since nearly all the precipitation fell as snow, normal amounts of snow were generally observed. That winter too, saw the lull of the solar sunspot cyle and was a weak Modoki winter. Snowfall in October '76 superseded any of the other snow covers in the Eurasia area and was preceded by a cool November (in fact, a notably cool fall). At this time, I don't see anything nearly this cold for this winter but there are enough similarities to keep it alive.
Another stand-out in the winters, is the more recent Winter of 2002-03. A cold and snowy winter was had over much of the Great Lakes and especially along the East Coast. It too was preceded by a cool November but was not in the lull of the solar cycle.
Precipitation and Snowfall
Generally with precipitation (both rain and snow); below average amounts dominated. However; there were just enough above normal precipitations and snowfalls to seriously consider - being most occurred in more recent winters. This fall's rainfall /13.03" thus far/ matches well for the wet fall that occurred in 1986 /"12.45"/ in Detroit This precipitation pattern also lines up with our present fall wetter pattern and with our snowy November. As stated before, half of the Novembers that preceded the analogue winters were below normal temperatures - or notably cool. Another item in that same vein of an early start to winter is that all locations averaged above normal snow in November in the analogues - and indeed in this November, also.
As a side note: the November analogues snow's climaxed with the the infamous Armistice Day Storm of 1940! "But perhaps the most embarrassing revelation was that no one was watching the storm's explosive development in the pre-dawn hours of November 11. A retired government forecaster says the Midwest headquarters in Chicago was not staffed overnight. The uproar led to several changes. The Chicago office went to round-the-clock operation and the Twin Cities branch was upgraded so it could issue forecasts'. Now we know when Chicago NWS went 24 hour operation and here is the history of Detroit's.
Decembers received a variety of snow but six averaged below normal; the rest normal to above. Actually; all months had quite a number of below normal snows with somewhat less above normal which lead to the slightly below normal winter snows. As always the main thing we are concerned with are the snowfall trends of the winters and to a lesser extent; the snowfall totals. The trend was for normal but on the lighter side and thus far; following the trend with a cold and snowy November.
Below are the maps from the analogue winters for Temperature departures, 500MB Low placement and subsequent likely storm track placement (Nov-Mar). Note the time period encompasses March also (still a winter month in my book). The El Nino pattern aided by blocking in the northern latitudes leaves Southeast Lower Michigan below average. Larger departures in the deep south reflect the colder air is able to push well south.
TEMPERATURES


Precipitation

500 MB LOW/HIGH HEIGHT PLACEMENT
This map represents the suppressed 500 MB low pressure heights - not wind maxes/minimums - and the strong high pressure 500 MB heights/blocking centered on Greenland and extending westward into Canada. This pattern tends to push the colder, below normal jets/temperatures south of their normal winter position.

Storms tracks across the Great Lakes and points south and east should prove interesting. The track projected over the region should vary enough to bring snow and/or mixed precipitation along with rain to Southeast Michigan - like most winters. As warmer air masses are able to push north with troughing west, look for the track to veer to the north and west. Likewise; as colder air engulfs the region and troughing forms southwest and south, the track shoots lows northeast and east into the Lower Lakes and Ohio Valley and points south and east.
STORM TRACK PLACEMENT 2018-19

Latest Global Model Output for the Winter of 2018-19
The CFS model while projecting temperatures above normal for the winter in the early fall for nearly all of the northern areas has progressively suppressed the above normal area to the west and southwest later this fall. The first models to develop the below normal or colder trend (similar to the analogues) earlier in fall were many of the foreign models. I believe this was on account of the foreign models suggesting a Modoki El Nino. The majority of the models kept drier to normal precipitation.
CFS /American/
TEMP


Foreign Models - European/UK British/Meteor France
TEMP

PCPN

The 500MB pattern is similar to the States /CFS/ for overall pattern but focuses the higher Heights/blocking over the northwest Northern America.

UKMET /BRITISH/
The UK Model alone is the coldest for area coverage across the Midwest-East including Southeast Michigan.
TEMP

ECMWF /EUROPEAN/
The European is the driest of the patterns for extent.
PCPN

Look for more write-ups through the winter involving notable weather events, major storms and comparing the Winter
Outlook trends and actual weather trends!
Making weather fun while we all learn,
Bill Deedler - SEMI_WeatherHistorian