While
there are generally many influences on our winter weather across the country and Southeast Lower Michigan; this winter
has an infrequent addition - what "type" of El Nino will be a key player
in our hemispheric circulation? That's right, while generally a strong to moderate El Nino is expected to prevail this winter; very little has been discussed on the type of El Nino expected to evolve. Therefore; the question also this winter should be - will we have a typical El Nino or a Modoki
El Nino? A Modoki El Nino has been more on the radar (so to speak) of research climatologists and meteorologists for the past 20 - 25 years or basically this millennium.
Modoki
is Japanese for “same but different,” and this is indeed the case. El
Nino Modoki events are a rarer subset of regular El Nino’s, and are
marked by warming water in the Pacific, but not evolving along the eastern section of the equator. Instead, the
warming gradually evolves toward and becomes more focused in the mid-Pacific-equator area and the warming as a whole,
is generally not as strong as a strong to "super" El Nino event. Sometimes
in a moderate-strong Modoki (as in this El Nino), water actually begins to cool to normal to below normal off the
coast of Peru, which is the opposite of a normal El Nino event (and what
you see in a typical La Nina event).
Several
studies have shown that the ENSO Modoki has become more prominent in
recent times (also evidenced by my analogues), as compared to a typical El Nino ENSO, which can result in changes in the teleconnection pattern arising from the tropical
Pacific. This change in the peak location of the El Nino affects the downstream Pacific Jet.
Summer into Autumn
The most radical but not that all atypical change occurred in
October with the sharp contrasts in temperature resulting in change of
jet stream from the first half to the second. Again, this is an
intermittent enough pattern (against the more gradual stair-step down
temperature pattern). I've written about radical jet and temperature
pattern changes in October. This can set
the stage for a very volatile up and down temperature cycle into the
winter reflecting a more volatile meridian pattern /sine-wave/. While this fall has reverted to the spring pattern seen with below normal precipitation thus far; due to a wetter summer - the annual precipitation has remained above normal.
Note:
I will continue the changes made last year in my Outlook for my third
decade of season outlook forecasting. They include an even more thorough
analogue chart including previously mentioned patterns in the past such
as: Autumnal patterns, Arctic Oscillations, Solar and QBO cycles along
with Siberian/Eurasia October snow cover (available since 1998) during
the previous analogue winters. This in turn is compared to the upcoming
Winter of 2023 - 24 observed or projected patterns. Therefore, much of
the information discussed is there for the reader to quickly scan on the
chart. I still will provide a brief summary of each indicator but limit
the amount of description, while still occasionally connecting the
reader to the corresponding website. The overall, Winter Outlook format
remains the same as presented in the past. Now on to the Outlook...
Winter Outlook for the Winter of 2023-24
Local Research and Hemispheric Data along with current modeling suggests:
Temperatures - Normal to Above Normal
As
with the majority of winters; look for temperatures during the
2023 - 24 winter to be quite changeable as opposing air masses vie for
dominance under a fluctuating jet stream. The ongoing pattern recently
experienced this fall is also telegraphed well in the Winter Analogues for
2023 - 24.
Various
computer guidance for the upcoming winter is also having some difficulty
with what type of El Nino will occur (see model section). While
analogues and some models suggest a typical El Nino pattern, my
research also confirms this with somewhat colder temperatures than what is
typical in a moderate to strong El Nino. I believe during this winter; the Pacific jet will be fighting
against a sometimes aggressive colder northern Polar/Arctic Jet
coming in from Canada. This winter's analogues are suggesting a
"normal to above normal" winter on the whole but with the strength of the present El Nino (Modoki or not); the variances of above normal to below also work together for a normal winter. With nearly equal amounts of above, below and normal winter results in analogues - the conflicting contrasts are striking! This also takes into account the majority of the colder winters are earlier in the sample and milder climate patterns are also at hand.
In the final analysis; Statistically, I look for Southeast Lower Michigan winter temperatures to average +0.0 to 3.0 degrees above normal depending on the resultant, dominant pattern that evolves. Note: Normal temperatures in my Outlook's denote within one degree of the local norm.
Precipitation (Rain & Snow water equivalent) - Below
While
the jet stream pattern has been busy in spurts as of late; as the El Nino
sub-tropical jet revs up into the winter, this is likely to drag the
southern, wetter storm track south of the Lakes into the Ohio valley and
points south and east - up the Coast. Most analogues and models
suggest an average to drier than average winter. Keep in mind however; many times we
have a below normal precipitation amount with normal or even above
normal snowfalls. Average snowfall to liquid amounts in Southeast Michigan vary somewhat; but an average of 10-12" to 1'' is suitable.
Note: Below normal precipitation; more than /- 1.0"/ of the winter average water equivalent. Normal
precipitation; +/- 1.0" of the winter average water equivalent and
above normal precipitation; better than /+1.0"/ of water equivalent
above the average.
Snowfall - Normal to Below
The
especially tricky part of this forecast is how much of the expected
precipitation will be snow and where the storm tracks set up. In the
analogues: snowfall in many of the earlier analogue winters ranged from below normal; to a few well above normal in the later winters. This
is especially true over the southern sections of Southeast Michigan
where a hint of above normal shows up the best. This make perfect sense
since the main southern storm track will be closer to that area. Adding
more to the complexity is that the later year Analogues (most after
2000) contain the above normal snows, which clouds the prognostication
picture even more. On
the flip-side; below normal snows could certainly occur especially if
the storm track rides further north or south - or fewer storms affect the region. At this early juncture however; normal to below normal snowfall seems
most suitable.
Note - Below Normal snowfall; less than /- 5.0"/ of the winter average snowfall. Normal
snowfall; +/- 5.0" of the winter average snowfall and above Normal
snowfall; better than /+5.0"/ of snow above the average.
Hemispheric Discussion
The upcoming winter's ENSO in the Pacific is expected to fade from an initially strong intensity El Nino to a moderate intensity later in the winter and early spring. As of November; there still is a decent chance the El Nino will evolve into a
Modoki El Nino as discussed above.
The analogue winters in this year's study are enhanced in red
below. For more on categorization of ENSO; see the following and here. Years before 1950 are added due to estimated data researched.
El
Nino
-
Moderate
Strong
1911-12
1899-00
1940-41
1925-26
1951-52
1930-31
1963-64
1957-58
1968-69
1991-92
1986-87
1994-95
2002-03
2009-10
ENSO Regions in the Pacific
Current ENSO map conditions and SST anomalies as of early November
While developing the El Nino; the specific CFSv2 model has suggested a more typical
El Nino to occasionally a Modoki rather than just a Modoki. Note the warmer
departures over the central Pacific and near the coast of South America. In fact; foreign and stateside models have generally held with a forecast of an
El Nino for the winter ranging from east-based to a centrally-based Modoki as the El Nino evolves. This was the case in a number of the chosen analogues but there are various other factors presented here to consider for the winter.
CFSv2
Foreign Models Consensus

The
Oceanic Nino Index /ONI/ chart below from 1850 into 2023 below; shows all the El Nino's
and La Nina's.
ONI
North Atlantic/Arctic Oscillation - NAO/AO
Most
winters; the phase of the NAO/AO is one of the most important
ingredients to the type of winter to be had over the central and eastern
part of the country. This is one of the most elusive oscillations to predict
for more than a week or two.
One of the more impressive patterns seen this summer was the negative dominance of the NAO /AO state. This was one of the main reasons we had a relatively cool summer with temps averaging slightly below 1991-2020 normals. Since the fall, the pattern has been more variable again with positive and negative oscillations prevailing.The majority of ensemble members below, forecast average to below average for the remainder of November.
POLAR VORTEX WEATHER
So why is all this important? Why do we care about the Polar Vortex every Winter?
The answer is actually quite simple. This stratospheric polar circulation, called the Polar Vortex, can mean the difference between a very cold and snowy winter and a warm and dry Winter.
A strong Polar Vortex usually means strong polar circulation. This usually locks the colder air into the Polar regions, creating milder conditions for most of the United States and Europe. I the Polar regions, creating milder conditions for most of the United States and Europe. In these conditions, the Winter can be mostly warmer than normal across the mid-latitudes.
In contrast, a weak Polar Vortex can create a weak jet stream pattern. The colder arctic air is harder to contain, which can now escape from the polar regions into the United States and/or Europe. Image by NOAA.
So, if you are a fan of a warmer winter across the United States and Europe, you will prefer a strong Polar Vortex. But if you like proper winter weather with cold and snow, a weak/disrupted Polar Vortex is your best bet.
As each year is different in the story of the Polar Vortex, we will look at the latest data in the Stratosphere and how a new Polar Vortex is starting to emerge for the 2023/2024 Winter season.
Siberia/Eurasia Snow Cover
One
of the studies by Dr. Jonah Cohen uses October snow-cover over Siberia/Eurasia to
aid in projecting out the main phase of the NAO and likely corresponding
temperature pattern for the winter. In my analogues;
I've included this past October's coverage and considering the rate of
coverage compared to that of the Modoki and typical El Nino's back to the Winter of '72-73.
Results show;
this October had been slower to accumulate snow-cover over that region
than some of the
analogue years. There was however; a notable increase in snow-cover very late October into early November.
The strongest case that I can present for an eventual weakening of the
PV is a notable west to east dipole in snow cover extent anomalies
(below normal in the west and above normal in the east) this month
across Eurasia (see Figure iv). As I discussed in the blog from 23 October 2023, research has shown this pattern can favor a weak PV and a negative AO/NAO during the winter.
This
update with more snow cover and the larger than average snow cover over
Canada may signal a likelihood of a -NAO/-AO prevailing this winter and
thus; colder
temperatures.
Here
is the latest snow cover over the Northern Hemisphere as
of November 11th 2023 - red trace). As you can see, by Nov 11th, this year's
Northern Hemisphere trace is near the top of the traces for this particular time period.
Dr.
Cohen also notes the latest CFS 500MB projections into and through
December 2023. Be advised these change
frequently and should never be taken as gospel, especially this far out.
https://twitter.com/judah47/status/106307828335
Pacific Decadal Oscillation /PDO/ and associated subset EPO
The previous phase Pacific Decadal Oscillation has recently oscillated between positive and negative phase. As of November, a negative phase is more dominant but again, a more mixed signal has also been seen.
A
typical positive phase of the PDO is represented on the left side and a
negative phase on the right of the and can be compared it to the current
state (below). As mentioned, a somewhat mixed result can be discerned over the Pacific but with a nod to the negative phase.
Recent Numerical Values
Pacific Decadal Oscillation (PDO)Date | PDO |
|---|
| Sep 2023 | -2.97 |
| Aug 2023 | -2.47 |
| Jul 2023 | -2.52 |
| Jun 2023 | -2.50 |
At this time; the warmer SST's nearer the West coast and up into
Alaska and Aleutians /conflicting positive phase/ generally encourages
high pressure ridging which may help at times, deliver Polar and Arctic
air from the northern Canadian regions into the Lakes. This was
especially true during the hard, snowy winter of 2013-14 where the NAO
was not always negative.


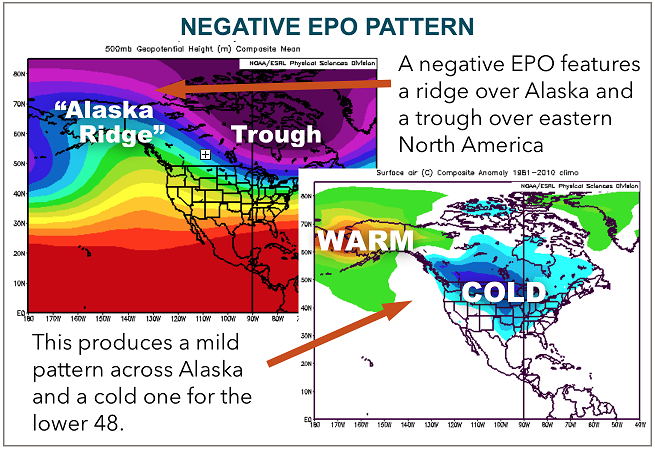
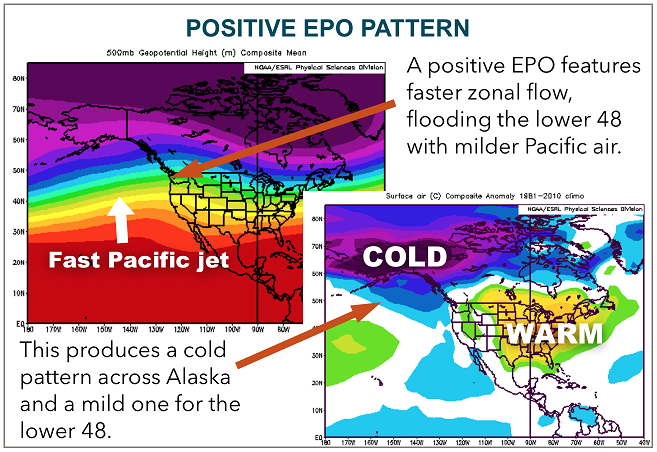
Eastern Pacific Oscillation /EPO/
The
Eastern Pacific Oscillation /EPO/ is a variation
in the atmospheric flow pattern across the eastern Pacific many times
into
Alaska. When the EPO is in a positive phase, mild Pacific air flows
straight into the West Coast of North America. When the EPO is in a
negative phase, a ridge forms in the upper winds along or off the West
Coast over the eastern Pacific. I feel not enough emphasis is put on the
EPO for some Winter Outlooks for the Great Lakes and some other regions.

THE QBO INFLUENCE
The
QBO, or Quasi-Biennial Oscillation, is an oscillation in the wind
direction in the stratosphere within about 15 degrees of the equator.
Over a roughly two-year period, winds tend to oscillate between westward
and eastward, with the switch between west and east winds starting high
in the stratosphere and then shifting lower in altitude with time. The
QBO is the result of waves propagating vertically in the atmosphere that
then interact with the mean flow to slowly change wind speeds and
direction. These changes influence the overall global circulation
patterns, which in turn influence winter weather patterns across North
America.
The
amplitude of the easterly phase is about twice as strong as that of the
westerly phase. At the top of the vertical QBO domain, easterlies
dominate, while at the bottom, westerlies are more likely to be found.
At the 30mb level, with regards to monthly mean zonal winds, the
strongest recorded easterly was 29.55 m/s in November 2005 and again, in the summer of 2017 when 29.05m/s occurred. The
strongest recorded westerly was only 15.62 m/s in June 1995 (Wikipedia).
If
you notice on my analogues; I included the QBO's for each available
analogue winter and compared it to the upcoming winter's QBO phase and trend. The
present and expected QBO this winter is for a peaking, at least to a moderate ,easterly QBO. The set of maps below show the
differing influences of the QBO dependent on phase and trend. The QBO is
presently is a weak easterly and increasing and is expected to strengthen further to at least a moderate easterly as the winter opens. Therefore; a clear choice for QBO influence is A. Another contrary pattern seen for a typical El Nino.

SOLAR CYCLE /SC/
Solar
cycle actual effects on short term weather and longer term climate
variability remain a controversial subject. I've read several articles
which support or are against their shorter term winter relevancy. Some
theorize that both natural
solar cycles and man's influence affect our climate. I am in favor of
the solar cycle being somewhat relevant and sometimes giving the present
winter cycle a "little kick" in regard to hemispheric wind flow patterns and resulting temperatures. Numerous recent studies for
example, do in fact make the connection to our climate and solar
activity including wintertime effects. One of the studies stated the
following:
The Euro–Atlantic sector seems to be a region with a particularly strong solar influence on the troposphere. In fact, significant positive correlations between solar activity and surface temperature in Europe have been reported in several papers (e.g. Tung and Camp, 2008; Lean and Rind, 2008; Lockwood et al., 2010; Woollings et al., 2010), although long records tend to give very weak signals (van Oldenborgh et al., 2013). We found a weak but significant change in the mean late winter circulation over Europe, which results in detectable impacts on the near-surface climate. Figure 9 suggests that during solar minima more cold air is ad- vected from the Arctic, thus resulting in a slightly increased probability of colder winters for large parts of the continent. Sirocko et al. (2012) recently reached the same conclusion after analyzing 140 yr in 20CR, although their results bare strongly dependent on their selection criteria for the solar minimum composite (van Oldenborgh et al., 2013), which includes only one winter for each solar cycle".
Comparing
solar cycles of the past analogue winters to the present is a possible
influence only and not a major contributor. While the solar cycle was in
various modes, the tendency is for La Nina's to Neutral winters
to occur during the mid to lower part of the cycle or during an overall,
weaker cycle. This season's El Nino analogues resulted in about half in the lower/upper part of the sunspot cycle.
Longer Term Solar Sunspot Activity since 1900 (includes this season's Winter Analogues)
Recent Sunspot chart since 1996
Closest winter position in the solar cycle to 2023-24 in descending
order (and there's only a few); 1972-73, 1963-64, 1925-26.
WINTER 2023-24 ANALOGUES
(CLICK ON TO ENLARGE)
Some additional category explanations in the analogue chart from left to right:
AO/SC
AO - The predominant phase of the Arctic Oscillation during that winter. AO- (negative), AO (neutral) or AO+ (positive).
SC - position of the solar cycle during that winter. Breaking it down (see solar cycle chart):
SC-- (opposite high cycle compared to the present, least similar) SC+/- (sunspots waning
but not near minimum or 2018 low level. Finally, S++ where solar
sunspot cycle is at or very close to the low cycle of 2018-19 and/or is
at the same decline with 2018...the best comparison and likeness.
QBO
- W=West wind prevailed that winter or E=East wind prevailed. Trends:
-/- (weak and weakening trend), -/+ (weak but strengthening), s (steady
trend, no change) +
moderate
and strengthening +/- strong but weakening. The closest QBO likeness years are several; 2009-10, 1991-92, 1986-87, 1972-73, 1968-69 (and earlier analogues are unknown). Therefore, out of the nine known QBO's seven contain at least some sort of easterly component - with five of those, closest to 2023-24.
Sib snow - Siberian snow cover in October and rate of change. All previous analogues winters had mixed snow covers compared to this past October's/early November. Notations: WA=Way above, A= above, B=below, % = equal to.
WINTER ANALOGUE SUMMARY
Temperatures
One
of the first things one notices about this winter's analogues is the
variety of winters experienced under the above conditions. As mentioned above the type of winters as far as temperatures were almost evenly divided with normal to below normal temperatures prevailing. As discussed in the past, because of the warmer trends experienced the last several years (and incorporated in the norms) it is logical that the analogue winters would average cooler than the current /1991-2020/ norms. Simply stating; the new norms skew the former year analogues averages lower/cooler and this is accounted for and kept in mind for the temperature outlook.
Precipitation and Snowfall
Generally
with precipitation (both rain and snow); below average amounts
dominated. However; there were just enough above normal precipitations
and snowfalls to seriously consider - being most occurred in more recent
winters. What's curious to note are the best snows occurred in the earlier and later years of the analogues with a decided drier snow sample mid term.
Temps/Pcpn maps longer term norms (best representation and less skewed) and shorter term for analogue years Nov-Mar /cold season/
Below
are the maps from the analogue winters for Temperature and precipitation departures,
500MB Low placement and subsequent likely storm track placement
(Nov-Mar). Note the time period encompasses March also (still a winter
month in my book). The El Nino pattern aided by blocking in the northern
latitudes leaves Southeast Lower Michigan below average. Larger
departures in the deep south reflect the colder air is able to push well
south.
TEMPERATURES
/USING LONG TERM NORMS 1895-2000/ - Best
/USING RECENT 1991-2020 NORMS/
Precipitation
/USING LONG TERM NORMS 1895-2000/ - Best
/USING RECENT 1991-2020 NORMS/
500 MB LOW/HIGH HEIGHT PLACEMENT
This
map represents the suppressed 500 MB low pressure heights with several El Nino/Modoki analogue winters - not wind
maxes/minimums - and the strong high pressure 500 MB heights/blocking
centered on Greenland and extending westward into Canada. This pattern
tends to push the colder, below normal jets/temperatures south of their
normal winter position.
Storms
tracks across the Great Lakes and points south and east should prove
interesting. The track projected over the region should vary enough to
bring snow and/or mixed precipitation along with rain to Southeast
Michigan - like most winters. As warmer air masses are able to push
north with troughing west, look for the track to veer to the north and
west. Likewise; as colder air engulfs the region and troughing forms
southwest and south, the track shoots lows northeast and east into the
Lower Lakes and Ohio Valley and points south and east.
STORM TRACK PLACEMENT 2023-24

Euro Winter 2023-24 Outlook - Temp
Euro Winter 2023-24 Outlook -Pcpn
Making weather fun while we all learn,
Bill Deedler -SEMI_WeatherHistorian


