Temperatures:
Look for temperatures to average below normal to normal with three month departure below the normal spring temperature. See reasoning below...
Precipitation:
Look for precipitation to average normal to below with the three month departure below the normal spring precipitation. See reasoning below...
ENSO
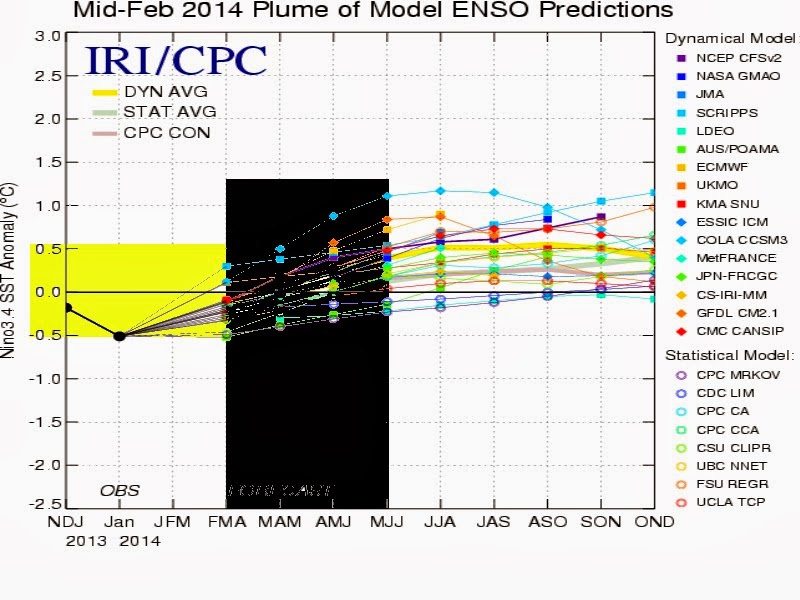
Little overall change is expected on the larger hemispheric scale as far as ENSO this spring as neutral conditions continue in the Pacific. As one can see by computer Pacific SST projections; little if any influence is expected from that region for the world.
Spring 2014 Analogues
The spring analogues were chosen as a subset of the winter analogues that performed the best in relation to temperature and lesser extent, snowfall. The original raw set of Winter 2013-14 analogue winters projected a colder than average winter with variable amounts of snowfall possible. From there, I narrowed it down by mid January to the coldest of winters with near normal to above in snowfall. these six winters were used in our spring outlook. The normals, averages for the six winters and departures are displayed on the bottom of the chart. The best performing analogues, 1981-82 and 1880-81 are displayed on the top of the chart. Remember; these analogues reflect what happened locally in Southeast Lower Michigan (using metro Detroit's data for the spring) in the past under similar hemispheric conditions. It's mainly their general temperatures/precipitation and trend that is most important and to a lesser extent, their numerical departures.
Immediately one can note these springs were not the nicest as far as temperatures (see color legend). Four out of the six springs went on to be colder or below normal as far as temperatures. The other two, averaged in the normal camp with no above normal springs seen (far right column, under spring average). The real drain on the spring temperatures were the colder than normal Marches and Aprils. Early in the spring anyway, showed the best chance of averaging below normal with three Marches below normal and three near normal. Narrowing this down further, when using our two best analogues for the winter, Winter of 1981-82 and Winter of 1880-81 both following Marches were colder or below normal. Moving on to April, three Aprils averaged below normal and two ranked near normal and one in fact, averaged above normal /4/1899 - 50.5/ +1.2/. However, when averaging the six Aprils in the analogue set, the average came in at 2.6 below the normal of 49.3 degree and almost identical to the March departure of 2.5 below it's normal of 37.2. In addition, again using our two best winter analogues, 1981-82 and 1880-81, both Aprils averaged decidedly below normal. Ironically; both March and April of 1982 and 1881 averaged similar temperatures with above average snowfall in Detroit. It will be interesting to see if this plays out a third time or the present cold and snowy pattern is cut off quicker than in those two analogue years. The most striking change that was seen in the analogues was the warmer or above normal Mays. Out of the six Mays, three averaged above normal, two averaged near normal and just one below normal. Was the polar cold was finally exhausted and the dominant upper wind pattern modified and changed? It appears that way. This is at least, encouraging for warmer than normal times ahead in mid to late spring, anyway.
Therefore; while the majority of springs started out with below normal temperatures, a subtle trend back to normal and even above normal could be summarized as the springs unfolded. This would seem to have logical support when one considers the gradual melting of the snow along with the extensive ice cover on the Great Lakes. This surface moderation along with a gradual relaxation of the predominant northwest upper jet stream looks subtle to the analogue results. Or, in other words, the previous cold analogue winter guidance and resultant extensive ice cover of the Great Lakes and bountiful snow cover (as seen in our two best analogues); encouraged a longer lag of below normal temperatures in the spring season than usually seen.
Spring Precipitation
Overall, spring precipitation averaged around normal to below in the analogue years. On average, normal to above normal precipitation early in the season gave way to normal to below normal later in the season. Five out of the six springs contained a notable dry period with the best chance being in April or May. Early in the season was feast or famine for snowfall with half of the sample containing above normal snowfall and half below; the aforementioned analogue years 1982, 1881 along with 1899 contained well above. It should be noted freezing precipitation also was noted these years.
Severe Weather Seasons (into the summer)
Looking over the severe weather stats for the analogue years since 1980 (locally) and 1961 (tornado stats map from SPC), The analogue years averaged normal to below normal for severe weather. Perhaps this is not surprising since many of the analogues averaged colder than normal and when it did warm up, precipitation amounts dropped off comparable to normal. Of course; there were a few busier years but more occurred in the summer, which is typical anyway.
Severe Weather Stats for Analogues from 1980 to 2006; note the average amount on the bottom was 45 days.
Annual
Totals
Year
|
Hail
|
Wind
|
Tornado
|
Total
|
||||
Rpt
|
Days
|
Rpt
|
Days
|
Rpt
|
Days
|
Rpt
|
Days
|
|
1980
|
58
|
17
|
186
|
32
|
29
|
16
|
116
|
37
|
1981
|
13
|
7
|
54
|
21
|
5
|
3
|
23
|
22
|
1982
|
45
|
15
|
117
|
19
|
17
|
9
|
79
|
28
|
1983
|
86
|
15
|
283
|
30
|
22
|
12
|
130
|
34
|
1984
|
31
|
12
|
79
|
29
|
20
|
12
|
71
|
39
|
1985
|
103
|
16
|
158
|
22
|
13
|
9
|
129
|
31
|
1986
|
72
|
21
|
165
|
36
|
34
|
19
|
140
|
46
|
1987
|
30
|
16
|
196
|
31
|
16
|
13
|
62
|
38
|
1988
|
75
|
22
|
198
|
35
|
19
|
10
|
113
|
40
|
1989
|
32
|
17
|
128
|
30
|
19
|
13
|
70
|
38
|
1990
|
33
|
16
|
141
|
21
|
23
|
12
|
79
|
27
|
1991
|
78
|
24
|
320
|
39
|
29
|
10
|
136
|
46
|
1992
|
66
|
24
|
262
|
32
|
52
|
16
|
170
|
42
|
1993
|
61
|
22
|
168
|
29
|
8
|
7
|
77
|
37
|
1994
|
159
|
30
|
239
|
37
|
12
|
8
|
183
|
48
|
1995
|
76
|
27
|
272
|
41
|
8
|
5
|
92
|
48
|
1996
|
120
|
35
|
244
|
41
|
14
|
8
|
148
|
56
|
1997
|
118
|
30
|
330
|
39
|
21
|
5
|
160
|
45
|
1998
|
270
|
36
|
595
|
39
|
28
|
16
|
326
|
52
|
1999
|
165
|
28
|
385
|
40
|
15
|
9
|
195
|
45
|
2000
|
292
|
30
|
381
|
46
|
16
|
9
|
324
|
53
|
2001
|
198
|
39
|
356
|
53
|
41
|
11
|
280
|
66
|
2002
|
145
|
39
|
394
|
53
|
22
|
6
|
189
|
62
|
2003
|
359
|
42
|
559
|
47
|
17
|
12
|
393
|
55
|
2004
|
326
|
45
|
489
|
45
|
22
|
10
|
370
|
60
|
2005
|
164
|
32
|
523
|
38
|
3
|
3
|
170
|
48
|
2006
|
424
|
50
|
404
|
49
|
12
|
9
|
448
|
70
|
AVG
|
133
|
26
|
282
|
36
|
20
|
10
|
436
|
45
|
| Tornado occurrences/ranks in all analogue years since 1961 | ||||||||||||||
 | ||||||||||||||
 | ||||||||||||||
 | ||||||||||||||
 |
Computer Model Temperature Outlook for Spring in Southeast Lower Michigan
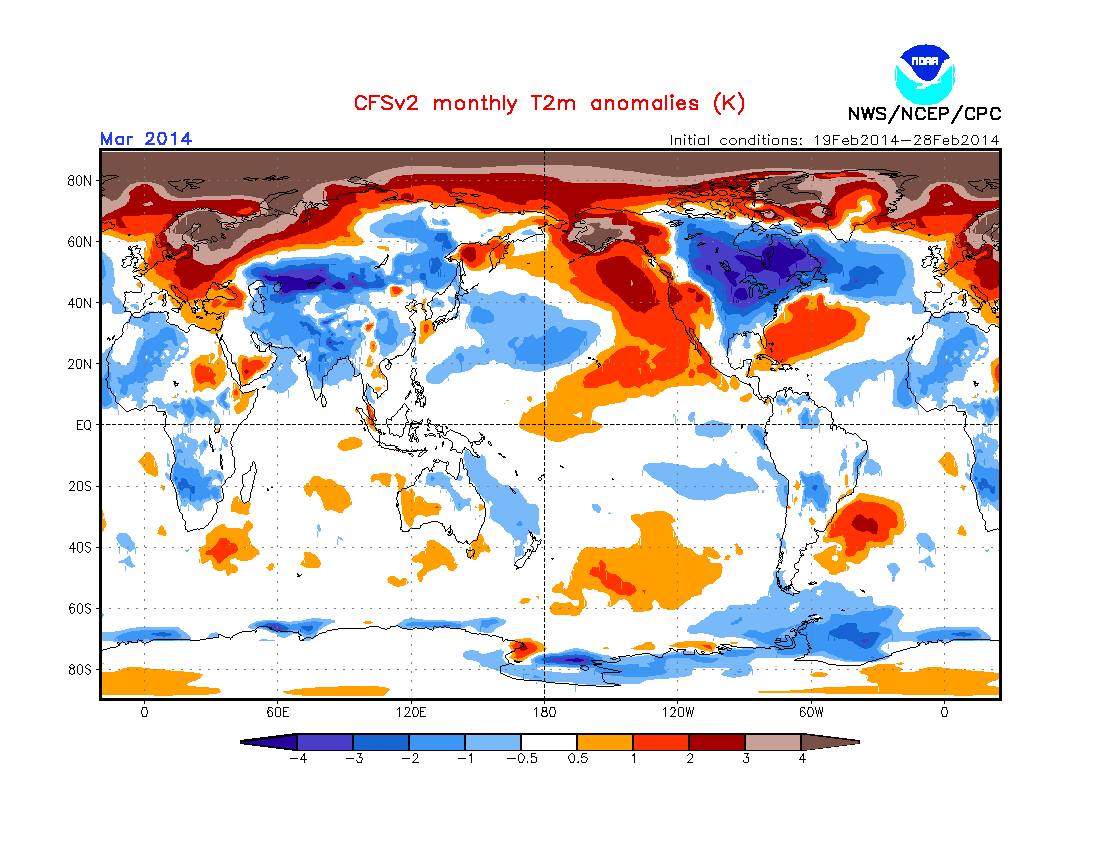
Looking at the computer model /CFSv2/ temperature outlooks for first the entire spring season and then, by monthly projections shows very strong support for the analogues. As one can see, below normal temperatures (blue shading) are suggested for the entire Great Lakes region for the spring as a whole. Interesting how this latest computer projection nearly duplicates local findings, right down to the month.
Monthly Breakdown of Temperatures
During the next few months; I'll have more posts on the Historic Winter of 2013-14.
Making weather fun while we all learn,
Bill Deedler -SEMI_WeatherHistorian
Bill Deedler -SEMI_WeatherHistorian


