Summer 2014 Outlook for Southeast Lower Michigan
Temperatures :
Overall; a comfortable summer is on tap as I look for temperatures to average around normal to slightly below for the summer. That being said I don't anticipate a notably cool summer. I look for temperatures to average between +1.0 degree and -2.0 degrees of the summer norms across Southeast Lower Michigan (see a more thorough discussion under Analogues).
Rainfall:
I look for rainfall to be quite variable as mixed data presents conflicting results but this is not unlike many summers. Taking all data (past and present) into account; rainfall is expected to be around normal over the southern sections of Southeast Lower Michigan and normal to below across the Saginaw Valley and Thumb Region. Rainfall trend data intimates the wetter weather in the early to mid summer with drier conditions later summer (see a more thorough discussion under Analogues).
Discussion:
Many are calling for a cooler than normal summer across the Great Lakes; including Southeast Lower Michigan. A common reasoning is the colder than normal Great Lakes water temperatures left over by the horrendously long, cold and stormy winter. As of this writing, ice still remains in scattered sections of Lake Superior on Memorial Weekend.
The colder than average lake water temperatures surely affect the shore and inland areas near the Great Lakes in the spring, especially when the wind's onshore. The more pertinent questions are; will there be enough of an affect to last into the summer and state-wide temperatures? After all, we do see the opposite effect every fall into at least, early winter across the Great Lakes as their mammoth water heat reservoirs temper the chilly Arctic blasts. So then; will the Lakes temper a bit, summer's heat blasts across the entire region; courtesy of mom nature's air conditioning? While this may occur early in the summer season state-wide and especially near shore areas; history and analogue data suggests a mixed picture otherwise for the balance of the summer. And besides; here in Southeast Lower Michigan warm to hot winds from the south-southwest do not pass over any large Great Lake anyway.
Frigid Water Temperatures of Lake's Huron and Michigan at the close of May


To investigate this assumption further, in addition to the usual analogue data I post for the season; I also included another chart of analogues so to speak, the cold winters and subsequent following summers. Simply put; If a terribly cold winter chilled down the Great Lakes enough to start off the summer season with below normal water temperatures, then what happened in Southeast Lower Michigan that summer? This is especially true in those summers where the springs were also on the cool-side, as in this year. And the best way to check that out would be to take the top 20 coldest winters and see what kind of summer followed but again; just in Southeast Lower Michigan. By doing this; obviously if Southeast Lower Michigan had one cold, bitter winter, then there's a strong likelihood so did the state...and the Great Lakes. Subsequently; the best correlation to this year would be where temperatures in the spring averaged below normal.
Because more recent normals for Detroit have been "contaminated" by urban sprawl and its heat island, I used a 100 year normal before the pronounced heat island evolved at Detroit Metro Arpt in the mid 1980s. Since most of the colder winters were also during that time; it's a better representation of a true normal for the summers...a hundred year average. As one can see; the old-time 100 year normal is well over a degree cooler than the latest (70.6 as compared with the latest 30 year normal of 71.9).
Cold Winter, Cool Summer Analogue Study

Looking at the chart above at the 21 coldest winters and the 20 summers that followed (2014 is yet to be determined); we find a subtle but definite correlation between cold winters and cool summers. There is even a better correlation between a cold winter and cool spring followed by a cool summer. Out of the original 20 coldest winters; eight of the following summers were more than a degree below normal using our legend. Of the remaining twelve summers; nine summers were normal and three were warmer. Therefore; 40% of the summers the temperatures averaged below normal; 45% were normal while just 15% of the summers were above normal. Therefore; relating just this analogue study to this summer; the chances of a normal to below normal summer are an impressive 85%.
Finally; narrowing down this data further by just using the seven cooler springs that followed the cold winter (and again, paralleling the past six months); four were followed by a cool summer and three were followed by a normal summer. None of these cold winter - cool spring periods were followed by a hot summer, or even an above normal /1.0+/ summer. In percentage terms on this data alone then; 57% of the summers were cool and 43% were normal.
Now, on to the typical season analogue study...
What do the Summer Analogues Project?

Remarkably; the typical season analogues chosen for parallel timing of hemispheric climate conditions at the present reflect our previous cold summer, cool summer analogues to a large extent. There is just a slight difference; normal summers have a slight edge over cool summers which is the reverse of the cold winter, cool summer analogues, where cool summers had the edge. The general message is the same however, where a cool to normal summer is preferred by all analogue data presented. In these carefully chosen analogue years; a prolonged period of neutral ENSO's were followed by an ever increasing summer El Nino. The two warm summers of the lot in this analogue study were the more recent summers of 1991 and 2002 with average temperatures of 73.6 and 73.4, respectively. Neither of these warm summers appeared in the previous cold winter, cool summer analogue study .
What are the best performing analogues thus far suggesting for the summer temperatures?
Temperatures
Since late fall of 2013, we have had a couple of years which take full marks for past prediction of the past few seasons; 1880-81 and 1981-82. And, maybe not surprising; 1881 contained a normal summer while 1982 had a cool summer (like our two prevalent trends seen). Another year; 1899 joins these analogue ranks as a decent performer during the winter and a good parallel this spring. All three analogues projected a cool spring with the temperature pattern we've seen this spring with time; below normal - normal - above normal. These analogue springs averaged below normal because of a very cold beginning to the season but will a gradual trend change from below to normal to above (Mar; Apr, May). The Summer of 1899 turned out to have a normal summer, therefore we have two normal summers and one below for the recent better performing analogues. The over all summers were cool to normal with June having the best chance being the coolest month relative to normal with August a close second. July's were the notably warm months relative to normal.
Rainfall
Rainfall projections for the summer, are really a mixed bag, as it frequently is in the summer with four normal rainfalls, four below and two above with the average skewed on the drier side. A notable trend from many of the summer analogues are wetter conditions early and/or mid summer with drier weather later summer. If high pressure over central Canada and the upper low over eastern Canada exude more force, then a summer on the drier side is likely. This will have to be watched as to where these systems dominate and rainfall patterns evolve.
That being said; it is reasonable when considering all the data and recent trends this spring to keep the prevailing dry/wet oscillations in view. While I look for generally normal rains this summer especially southern regions, I also look for the decidedly typical dry-spell this summer which frequently happens (I researched and wrote about this in 1997 and updated in 2007, while with the NWS). Below are the temperature and precipitation composites for the analogue years in the research. One the left is the data against the 105 year normal; while on the right is the same data against the latest 30 year normal /1981-2010/. In Southeast Lower Michigan; average summer temperatures prevailed against the 105 year normal and normal to below against the 30 year. The rainfall averaged close to normal against the 105 year norm and below against the 30 year.


Analogue Upper Wind Data
Past analogue upper wind data paints upper height ridging and oscillations extending from the Rocky Mountains eastward into the Gulf States and points north into the Great Plains to Eastern Great Lakes. In conjunction; an Upper low pressure oscillated over the eastern half of Canada and extended south and oscillated from the western Great Lakes to off the East Coast. This type of pattern would give us overall normal temperatures during the summer with warm to hot spells routinely extinguished by parading Canadian cool air masses. If one or the other prevails more; of course it will be cooler or warmer than expected. Looking at recent past trends along with this analogue data and subsequent pattern suggests to me normal to below normal temperatures.

The composite upper air anomaly data below shows more clearly what we are up against this summer as far as opposing upper air features. The composite shows where upper air systems were more exaggerated than during a normal summer; thus an anomaly. A blocking upper high pressure system was noted during these summers from central Canada, south into the mid Mississippi Valley. It is the same system I mentioned above that oscillates back and forth but was more dominant up in central Canada in these analogue summers. This system will be responsible for bringing the warm winds from the south when over and east of us and cooler winds from the north when west of the Lakes (blue arrows). Meanwhile; the cold upper low that was so dominant for months /Polar Vortex/ shares the stage with the high pressure as it aligns from eastern Canada south into the eastern U.S. It will be responsible for pushing cooler air southeast or south (in the form of back-door cold fronts) into the Lakes Region (also blue arrows), as it has for months; albeit weaker. Were the upper wind features develop as in the past; sunshine during the summer would average normal to above with the placement of the high.
Another interesting feature is the pronounced upper low feature that showed up over central and southern California; this too will aid in pushing warmer air northeast (red arrows) into the Plains, Mississippi Valley and Midwest behind the upper high pressure. As one can easily see, the zone of air mass confrontation between all of these systems is like most summers and extends from the Great Plains, east through the Great Lakes and on to the East Coast. If the upper high pressure and low pressure heights in Canada play out more to our east, then storms will be more focused to the south and east.

Stormy Weather?
As mentioned above; the data to me depicts a notable confrontation zone and I believe we have just recently entered it as of late May. Typically, the busiest times for severe weather in these parts is June into July; with mid June to mid July prime-pickens. I've included the severe weather stats for Southeast Lower Michigan since 1980. Looking above at our analogue summers since then are 1982, 1991, 1997 and 2002 and all but 1982 contained normal to above normal (or busy) severe seasons. That's not surprising given the jet stream that's been dominant in Canada this year. Were this upper jet continued to be aggressive, notable wind events, squall lines and possibly a derecho event or two across the country would be the risk. Off the top of my head; both 1991 (derecho) and 1997 (squall line and tornado) contained notable July squall lines and tornado and 2002's severe weather season was overall, busy.
Annual
Totals
Year
|
Hail
|
Wind
|
Tornado
|
Total
|
||||
Rpt
|
Days
|
Rpt
|
Days
|
Rpt
|
Days
|
Rpt
|
Days
|
|
1980
|
58
|
17
|
186
|
32
|
29
|
16
|
116
|
37
|
1981
|
13
|
7
|
54
|
21
|
5
|
3
|
23
|
22
|
1982
|
45
|
15
|
117
|
19
|
17
|
9
|
79
|
28
|
1983
|
86
|
15
|
283
|
30
|
22
|
12
|
130
|
34
|
1984
|
31
|
12
|
79
|
29
|
20
|
12
|
71
|
39
|
1985
|
103
|
16
|
158
|
22
|
13
|
9
|
129
|
31
|
1986
|
72
|
21
|
165
|
36
|
34
|
19
|
140
|
46
|
1987
|
30
|
16
|
196
|
31
|
16
|
13
|
62
|
38
|
1988
|
75
|
22
|
198
|
35
|
19
|
10
|
113
|
40
|
1989
|
32
|
17
|
128
|
30
|
19
|
13
|
70
|
38
|
1990
|
33
|
16
|
141
|
21
|
23
|
12
|
79
|
27
|
1991
|
78
|
24
|
320
|
39
|
29
|
10
|
136
|
46
|
1992
|
66
|
24
|
262
|
32
|
52
|
16
|
170
|
42
|
1993
|
61
|
22
|
168
|
29
|
8
|
7
|
77
|
37
|
1994
|
159
|
30
|
239
|
37
|
12
|
8
|
183
|
48
|
1995
|
76
|
27
|
272
|
41
|
8
|
5
|
92
|
48
|
1996
|
120
|
35
|
244
|
41
|
14
|
8
|
148
|
56
|
1997
|
118
|
30
|
330
|
39
|
21
|
5
|
160
|
45
|
1998
|
270
|
36
|
595
|
39
|
28
|
16
|
326
|
52
|
1999
|
165
|
28
|
385
|
40
|
15
|
9
|
195
|
45
|
2000
|
292
|
30
|
381
|
46
|
16
|
9
|
324
|
53
|
2001
|
198
|
39
|
356
|
53
|
41
|
11
|
280
|
66
|
2002
|
145
|
39
|
394
|
53
|
22
|
6
|
189
|
62
|
2003
|
359
|
42
|
559
|
47
|
17
|
12
|
393
|
55
|
2004
|
326
|
45
|
489
|
45
|
22
|
10
|
370
|
60
|
2005
|
164
|
32
|
523
|
38
|
3
|
3
|
170
|
48
|
2006
|
424
|
50
|
404
|
49
|
12
|
9
|
448
|
70
|
AVG
|
133
|
26
|
282
|
36
|
20
|
10
|
436
|
45
|
Hemispheric Data
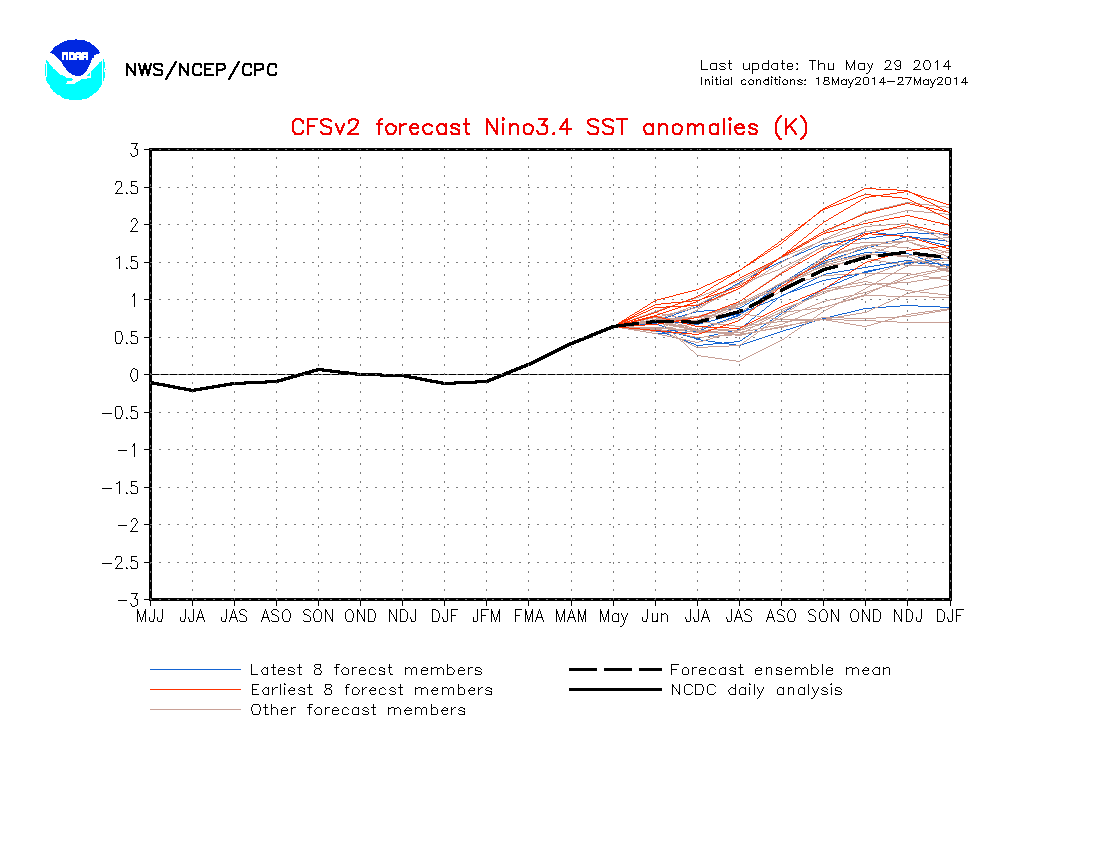
As mentioned above; Summer will be accompanied by a progressively ensuing El Nino but I just included this small amount of data below as I expect it will have negligible affects on our weather at home this summer. It will be the fall and especially wintertime that this little baby boy will be more of a player. Check out the CFSv2 models projection into the winter; quite interesting...
And while on the subject of the CFS, lets take a look at its projection for the summer. Really nothing earth-shaking here, though she does intimate the cooling Lakes effect and possibly stalled fronts in the lower Lakes on the rainfall side. I think we are seeing that starting now as of late May.
Temperatures

Rainfall


Try to get out and enjoy the Summer but if swimming in the Great Lakes; just wait a bit longer for those lake temperatures to warm up! Brrrrr.

Making weather fun while we all learn,
Bill Deedler -SEMI_WeatherHistorian
Bill Deedler -SEMI_WeatherHistorian