Detroit's summer average of 74.9 just eked-out a new record hottest summer. Looking at the data this was primarily because of the warmer overnight lows rather than the high temperatures or number of 90 degree days (record 39 as opposed to this summer's 21 as of 9/6/16). The warmer overnight lows were mainly due to the higher dew points and humidity along with the heat island affect when compared to drier summers. As an example; the Summer of 1988 is a prime candidate of a hot, miserable but dry summer. The dominant air masses were drier than this past summer and thus, lower dew points and therefore lower overnight lows. Though there were 39 days the thermometer reached 90 degrees of higher in 1988 - and five of those 100 or higher; the summer temperature average still was lower than this summer. Not because of the average high temperatures but because of the cooler overnight lows. In addition; at that time, there was just the beginnings of a heat island development at DTW (I worked at DTW most of the period between 1974-1996). The dominant air masses were generally drier than this past summer and thus, lower dew points and subsequent overnight lows.
Update
Detroit talled up 21 days of 90 degrees or higher during the summer months. Another was added on 9/6//16 for a total of 22 for the warm season thus far. Flint reached 33 days of 90 degrees or better in the summer; while Saginaw had the lowest of 8 (however, again here one was added 9/6/16 for a total of 9 for the warm season).
SUMMER 2016 STATISTICS FOR SOUTHEAST LOWER MICHIGAN

*Top warmest back thru 1996 not available for White Lake therefore; an estimate compared to recent warmest years in Southeast Lower Michigan.
*DTX Summer ave temp Year
1- 70.5 2005
2- 70.3 2010
3- 69.5 2011
4- 69.2 2012
5- 68.6 2016

From NWS DTX

DIGGING BELOW THE SURFACE
As
usual the Detroit statistics are skewed upward due to the heat island
influence and is especially noted with overnight temperatures - and
logically so. While at NWS White Lake; we did an in-house study of the
heat island change at Detroit Metro Arpt.several years back and an
estimated 2-3 degree overnight low increase was noted when you compared
DTW's older non-influenced heat island climate with its present day.
Daily high temperatures departures compared to the early data, averaged less than
lows at about 1/2 to 1 degree above. This even becomes more pronounced
with a prevailing wind off the Detroit city and near suburban area
(generally North-East-Southeast) and especially during the
colder winter months. This continues to influence ongoing norms with
normal data from 1980-2010. It is estimated that the heat island began
to influence Detroit's normal's during the 1980s (a fellow co-worker did
a paper on the change back in the late 80s or 90s). It was not
surprising with this summer's heat that Detroit's temperature average
would be skewed up some by the urban heat island - but what about Flint?
Taking all the data /including DTX/ into account gives an average temperature for Southeast Lower Michigan of 72.3. Since there is no normal for DTX, we'll stick with the three climate station average; which actually raises the Southeast Lower Michigan average to 73.5 compared with the normal average 69.8 or 3.7 above normal. As you can't miss in the data; there is quite a large variance and discrepancy between Detroit's & Saginaw's departures relating to Flint's. Both Detroit's and Saginaw's departure average are in line - about 3.0 degrees - above normal whereas Flint's is a huge 5.2 above. Also, consider Saginaw only ranked in at 12 warmest and looking at DTX's data, White Lake never even placed in the top 4 warmest going back the past 16 years- it placed 5th by my estimate above. Both stations are closer to Flint but there are other coops near FNT arprt to compare.
All three climate stations have placed in the top 20 warmest summers since 2000, several times. As far as I know there is little if any heat island out at Flint Bishop arprt - and certainly not one that would account for a 2.0 + degree higher departure than Detroit - even with its heat island, and Saginaw. Saginaw airport /MBS/ is located at Freeland, far from downtown Saginaw, so a heat island there should be negligible. In fact, when the in-house study was done at.DTX, Flint averages changed little since the airport began /1942/; negating any heat island up until the time of the study and Saginaw's actually fell a bit. I assume that could be because the Saginaw station may have been moved from downtown Saginaw to Freeland, out in the country.
Comparing the number of 90 degree days each station reported is even more telling. Detroit reported 21 days during the summer. Detroit's normal is around 10 -12 /10.3 - being listed in the latest LCD/. Saginaw reported 8 in the summer /normal is 6/ while Flint reported a whopping 33 /normal is 6.3/! Twelve more 90 days that Detroit and that's even with its established heat island and 25 more 90 degree days than Saginaw! It is my understanding; DTX knows of the questionable Flint ASOS site temperature issue and is working on the problem.
The following are area maps for the upper Midwest and Great Lakes; therefore they are smoothed and may not reflect the actual data reported at a particular location.


Rainfall
While
mom nature was very generous with the heat, she was more fickle with
the rainfall. Most areas saw normal to below normal rainfall but there
were still notable areas of normal to above. Areas on the map below that
are yellow and green received normal to below normal rainfall. In
addition, areas in the yellow to beige received normal to locally above
normal.

The map below shows the areas of above, below and normal rainfall departures. There were some "stripes" of above normal rainfall extending from the Saginaw Valley (including Saginaw) into the Thumb Region, across the far northern suburbs of Detroit and along the eastern areas of metro Detroit and extending into its northeast suburbs. Some isolated areas received upwards of 2 - 4"+ above normal.
The majority of the region received normal to below normal rainfall. Most notable was around much of the remainder of extreme Southeast Lower Michigan (including DTW), portions of \Detroit's west and immediate north suburbs and up across much of Genesse (including FNT) and eastern Shiawassee County.
And, just like the above normal departures, some areas measured 2 - 4"+ below normal.
Departures

This is the rainfall for the month of August for the entire country. Note the heavier rains that fell in Southern Lower Michigan into Northern Indiana. Of course the most notable rainfall that caused all the flooding in and around Louisiana can be seen with the bulls-eye of 20"+

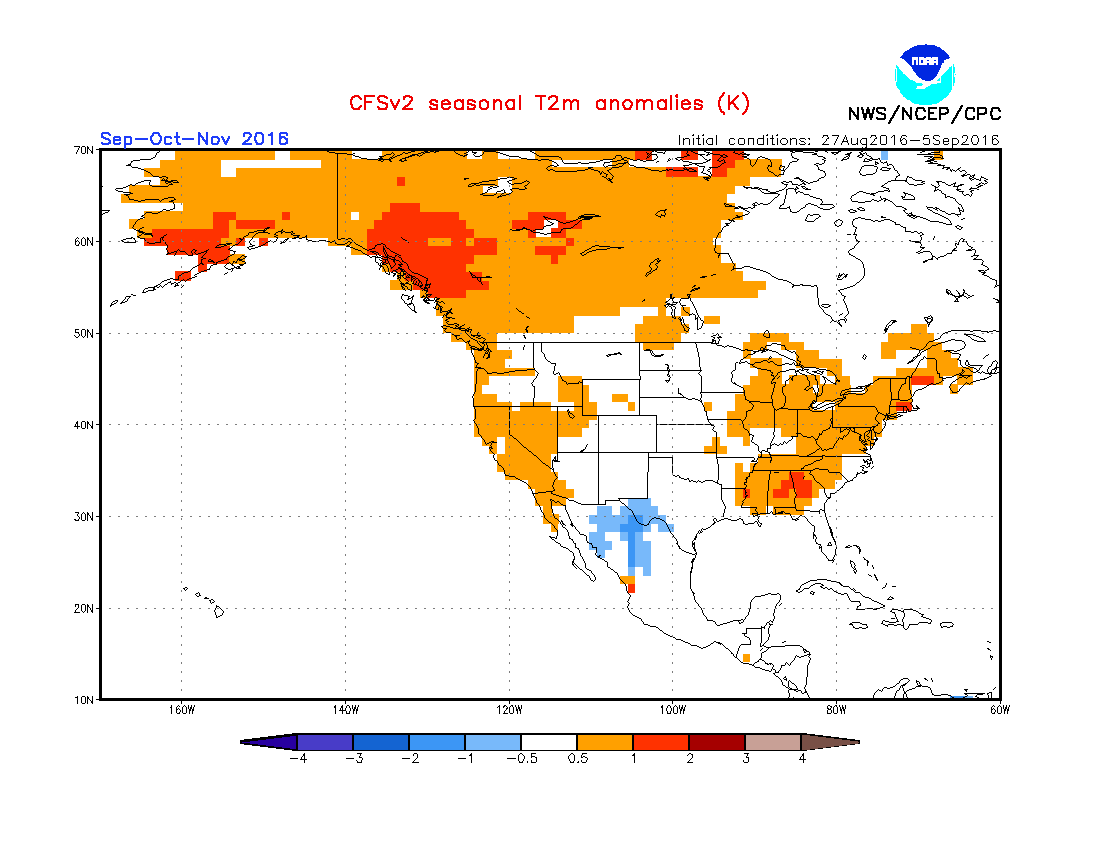
OUTLOOK FOR SOUTHEAST LOWER MICHIGAN THIS FALL
Since the ENSO temps are just slightly below normal indicating a neutral to weak La Nina; I would suspect little if any effect on our fall. Other more typical hemispheric patterns should govern our autumn. In any event; weak La Nina falls generally are rather pleasant across Southeast Lower Michigan but with killing frosts and freezes still coming at their normal or average times - mid to late October. Precipitation generally is normal to below. Here are the latest computer generated Outlooks for the country.


Later in September; will look at the Updated Summer Outlook and the actual Summer statistics
Making weather fun while we all learn,
Bill Deedler -SEMI_WeatherHistorian