Here is the latest 500H Polar Projection of both the GFS and Euro. Note the "Polar Vortex" is the deepest, coldest aloft over the Northern Hemisphere on this run.


Interestingly; the GFS and CFS -extended climate model- have been all over this Arctic cold blast for a time now. In fact; the GFS 850MB projected the Arctic blast over 200 hours out at the time (the CFS -climate model- intimated a potent cold snaps well over 300 hours, late January or early February out at varying times). Note below; the extreme cold and displacement (anomalies) of the cold air. I made the copy to compare with time the extent and accuracy to shorter time frames.
Look at the extreme Arctic anomalous 850 MB /5kt/ cold map below over the Great Lakes versus the extreme Northeast Canada/Hudson Bay anomalous warmth. The immense cold is dislodged from the Arctic and slammed south into the Northern and Eastern U.S. This map initialized back on Monday night 1/21/19 and projected the map 210 hours out for overnight, Thursday 01/31/19. I must caution we are looking at two things; trend and timing - and secondary the actual forecast of temperatures in the following maps!

Here were the 850 MB /5ft/ temperatures are projected as of that same time. Note the 850 temperatures /C/ were projected to as low as -30 to -40C!

Moving later a bit to Wednesday night's initialization; 01/23/19 for the same time period show's the overnight temperatures just after midnight - note, all comfortably (or uncomfortably as this case would be) below zero /F/.

Check out the wind chills at that time; ranging -30 to -40 across Southern Lower Michigan - and that's "mild" compared to the -40s and -50s in the upper Midwest!

Using the same initialization run time; Wednesday 1/23/19. Here's the 500 MB map the afternoon before; Wednesday 1/30/19. The 500 Dam has dropped to 486 over much of Lower Michigan!

________________________________________________________________________________
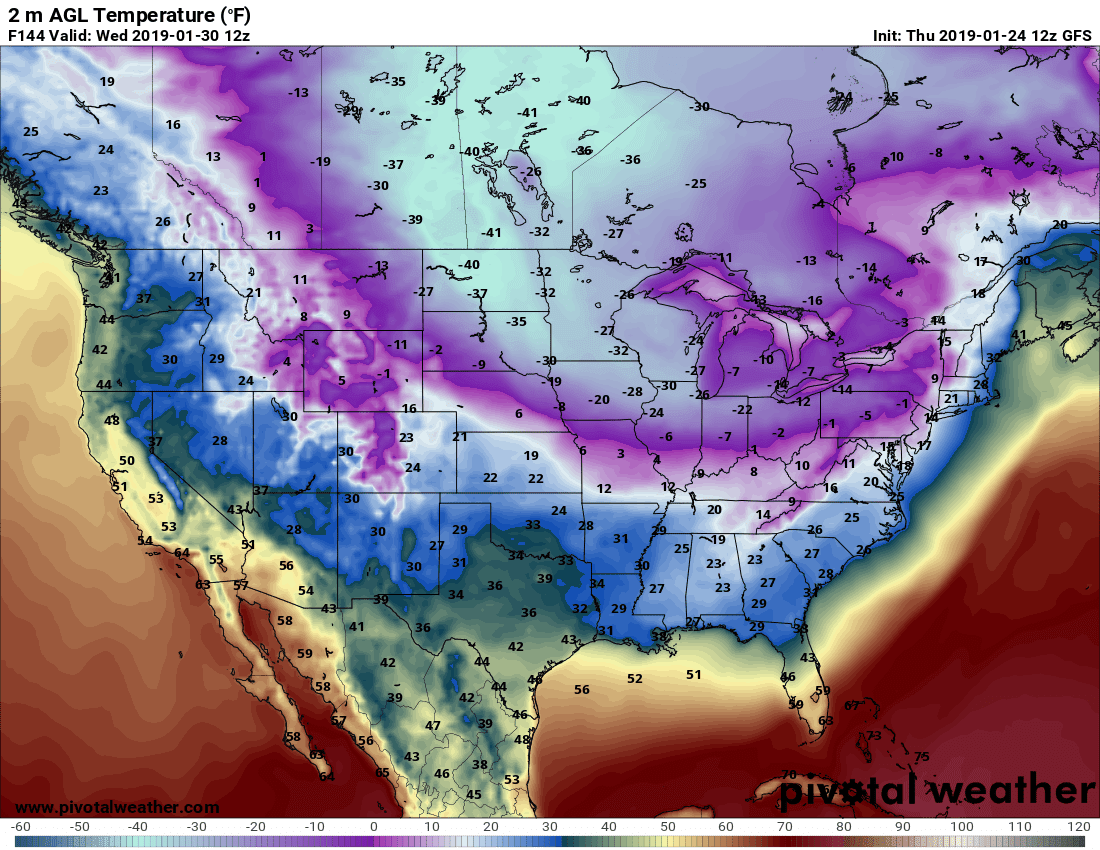
So what's the latest forecast of the GFS (the Euro is also projecting the cold but to a bit lesser extreme)?
Note this time is actually a bit earlier than the other maps, it's for 18Z /1PM in the afternoon/ Wednesday 1/30/19.
...and the wind chills, they are downright scary for Wednesday morning into Thursday!


Please do not take these numbers as gospel at this time but the trend and projection of this cold wave has changed little in several days.
Here are the record lows for all three locations /DTW,FNT,MBS/ at the end of the month into early February. As you see some records could be easily tested if not broke!
JAN - DTW - Rec lows in blue
| 29 | 32 | 19 | 26.0 | 58/1914 | 7/1977 | 41/2006 | -7/1885 | 48/2006 | 2/1977 | 0.84/1969 | 29 |
| 30 | 32 | 19 | 26.0 | 62/2013 | 7/1951 | 41/1988 | -4/1951 | 48/2013 | 2/1951 | 1.15/1916 | 30 |
| 31 | 32 | 19 | 26.0 | 60/1989 | 7/1920 | 48/1988 | -7/1920 | 51/1988 | 0/1920 | 1.48/1878 | 31 |
FEB - DTW - Rec lows in blue
| 1 | 33 | 19 | 26.0 | 54/1933 | 4/1898 | 40/2012 | -7/1971 | 45/2012 | 0/1898 | 1.11/1968 | 1 |
| 2 | 33 | 19 | 26.0 | 52/1983 | 3/1881 | 36/2006 | -12/1976 | 44/1973 | -1/1881 | 0.49/1990 | 2 |
| 3 | 33 | 19 | 26.0 | 56/2016 | 8/1996 | 36/2016 | -15/1985 | 46/2016 | 1/1996 | 1.12/1883 | 3 |
JAN - FNT - Rec lows in blue
| 29 | 30 | 15 | 22.0 | 58/2013 | 6/1965 | 43/2008 | -11/1966 | 47/2008 | 0/1966 | 1.32/1947 | 29 |
| 30 | 30 | 15 | 22.0 | 58/2013 | 8/1951 | 43/1988 | -16/1951 | 47/1988 | -4/1951 | 0.98/1947 | 30 |
| 31 | 30 | 15 | 22.0 | 59/1989 | 6/1971 | 41/2012 | -8/1963 | 48/2012 | 2/1971 | 1.03/1942 | 31 |
FEB - FNT - Rec lows in blue
| 1 | 30 | 15 | 22.0 | 52/2012 | 7/1971 | 37/1968 | -18/1959 | 44/2012 | -4/1959 | 1.31/1968 | 1 |
| 2 | 30 | 15 | 23.0 | 53/1973 | 4/1996 | 35/1973 | -22/1959 | 44/1973 | -2/1959 | 0.69/2011 | 2 |
| 3 | 30 | 15 | 23.0 | 55/2016 | 4/1996 | 36/2016 | -11/1996 | 46/2016 | -3/1996 | 0.41/2003 | 3 |
______________________________________________________________________
JAN - MBS - Rec lows in blue
| 29 | 29 | 15 | 22.0 | 56/2013 | 6/1965 | 39/2008 | -8/1966 | 45/2013 | -1/1965 | 0.99/2013 | 29 |
| 30 | 29 | 15 | 22.0 | 55/2013 | 8/1951 | 41/1988 | -17/1951 | 46/1988 | -5/1951 | 0.74/1947 | 30 |
| 31 | 29 | 15 | 22.0 | 55/1989 | 5/1920 | 36/1988 | -15/1994 | 45/1989 | -3/1918 | 1.56/1914 | 31 |
FEB - FNT - Rec lows in blue
| 1 | 29 | 15 | 22.0 | 50/1933 | 5/1918 | 37/1968 | -16/1918 | 41/1933 | -6/1918 | 0.79/1968 | 1 |
| 2 | 29 | 15 | 22.0 | 46/1920 | 2/1996 | 32/2006 | -15/1976 | 37/1973 | -5/1996 | 0.75/2011 | 2 |
| 3 | 29 | 16 | 22.0 | 50/1991 | 4/1996 | 33/2016 | -14/1996 | 42/1991 | -5/1996 | 0.38/1924 | 3 |
Next: Before the extreme cold, more snow? Look for a potential snowstorm Monday with several inches possible at this time. Snow that would definitely aid the Arctic cold slated to follow! Winter is certainly making up for lost time, the freezer door has opened!!
I will update about that on my FB Weather Historian later in the weekend.

Making weather fun while we all learn,
Bill Deedler - SEMI_WeatherHistorian


