Perhaps no other Winter Outlook, its expectations and anticipation has been "trumped" up (pardon the political pun, please) more than this upcoming winter's. Ever since last spring, the expectations of a significant El Nino and how it will affect the Winter of 2015-16 has been the topic of weather prognostication across the country. In ENSO terms, it is a
strong El Nino, the likes that will be moving into full boar shortly. It's projected strength (as of early November) is to be on par with the modern "super El Nino's" the likes not seen in 1997-98 and 1982-83.
The Fight Has Just Begun!
While El Nino has been strong over the Pacific, its downwind affects for the most part, have yet to be seen much in our neck of the woods. We've had a relatively beautiful, warm fall thus far - somewhat uncharacteristic of strong El Nino's (dependent on El Nino strength and timing) which tend to be cooler, see
Autumn Outlook analogues. During the strong El Nino's of 1982-83 and 1997-98 the atmospheric characteristics and downwind affects really didn't peak until the winter period. Thus far, along the central and southern West Coast, the "wave-train" of storms has yet to materialize but if history is any indicator, next month should see things pick up some. Things have begun to change here in November though with some storms tracking further south into the West Coast, deepening on the lee side of the mountains and heading into the Great Lakes. However, this pattern is really not unusual for any late fall period so, nothing too El Nino-like.
At the same time; the Polar/Arctic jet has shown signs of expanding and phasing further south into the sub-tropical jet, typical for November. While the subtropical jet is becoming more active, so is the Polar/Arctic jet. This has created a combative, progressive rolling jet pattern across the country. I look for this pattern to continue into at least into early December as timing is always an issue this far out. While the Polar Vortex is expected to remain much of the time up in the Arctic; looking at my data and the past few winters, I look for it to be a player at times.
Due to the strong El Nino and considerations given to other hemispheric patterns and oscillation discussed below, My Winter Outlook for Southeast Lower Michigan is as follows:
Temperatures:
In spite of a classic, strong El Nino in place I don't look for a winter placing as warm as the classic El Nino's of 1982-83 and 1997-98. I do look however, for the
winter pattern downwind to behave at times like a Hybrid or Modoki El Nino (discussed below) rather than just the typical classic El Nino. Because of the other hemispheric patterns in place; I would expect more of a "roller-caster" type of temperatures pattern established especially going into the winter, as mentioned above and coming out; directly involving the El Nino, EPO and NAO.
In any event; look for a milder, less cold winter than the past couple with temperatures averaging around 2 to as much as 4 degrees above the established normals. More on the particulars including the analogues below.
Snowfall:
Snowfall should average mainly below normal with pockets of normal across the entire region. Recent patterns along with analogue data suggest less snow than average should be expected across the southern areas of Southeast Lower Michigan with normal to below across the Saginaw valley/Thumb Region. This area and pattern involvement will be watched during the season for variations as the storm tracks materialize.
Generally, Southeast Lower Michigan receives 40" - 50" of snow in a given season with somewhat higher amounts off the snow-belts of Lake Huron, and in the highland areas over the middle region of Southeast Lower Michigan.
Again, with hemispheric patterns in place (discussed above and below) and associated contrasting air masses; the risk of rain mixed with snow and ice systems will be higher than average.
Strongest Hemispherical Players (in order of importance)
I - ENSO including Southern Oscillation Index for pre - 1950 years
Strongest analogue years post 1950 are few and far between with 1997-98, 1991-92, 1982-83 and 1972-73 all the best strong El Nino contenders in my opinion. Out of the four, 1997-98 shows the strongest correlation in some ways in the central Pacific and has been compared the most to this years.
The parallels between now and 1997 are the strong El Nino near the equator. However, there are still notable differences; those being the extent of warmer waters
just northeast of the El Nino in 2015 and the more pronounced warmth along the Pacific Coast into Alaska. The warmth up near Alaska was a contributing factor the past few winters in the Eastern Pacific that favored a -EPO which encouraged West Coast ridging. This in turn, aided in the dumping of Cold Arctic air south into the country. I believe this will, at least intermittently, be a player from the north (more below under oscillations). How often and how far south Arctic air masses get into the country this season could at least, challenge El Nino's strong mild jet.
In addition; note the extensive warmer than normal waters off the East Coast. This is an interesting addition to the puzzle since that may encourage ridging over the western Atlantic. With warmer waters well up into Alaska on the West coast and warmer than normal waters projected along the East Coast, would that not aid in occasional troughing over the U.S.? Where, will depend on the strength of El Nino jet in the Pacific along with its most eastern extent which are historically, far and encompassing. Back in the1997-98, El Nino pattern had already been well developed longer than our current 2015 El Nino (as far as the SOI and downwind affects) with its El Nino kicking into gear by late fall and more importantly, it
held strongly the entire winter. The
Southern Oscillation Index,
or SOI,
gives an indication of the development and intensity of El Niño
or La Niña events in the Pacific Ocean
From NCDC
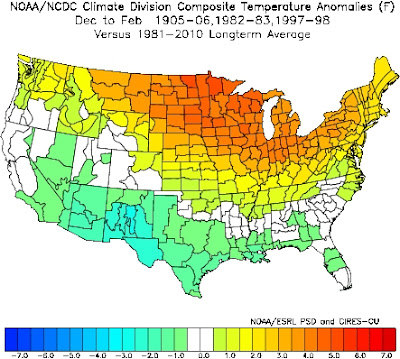
The winter of 1997-1998 was marked by a record breaking El Nino event and unusual extremes in parts of the country. Overall, the winter (December 1997- February 1998) was the second warmest and seventh wettest since 1895. Severe weather events included flooding in the southeast, an ice storm in the northeast, flooding in California, and tornadoes in Florida. The winter was dominated by an El Niño - influenced weather pattern, with wetter than normal conditions across much of the southern third of the country and warmer than normal conditions across much of the northern two-thirds of the country.
Prior to the winter of 1997-1998, strong warm-episode (El Niño) conditions had persisted in the tropical Pacific since June 1997. Sea surface temperatures throughout the equatorial east-central Pacific increased to near 29 degrees C during February and March 1998. At the same time, departures from normal were near +4 degrees C along the west coast of South America. During 1997 the National Center for Environmental Prediction (NCEP) statistical and coupled model predictions were consistent in indicating the development and persistence of strong warm-episode conditions.
Comparing the past two Strong El Nino's to 2015
What's is interesting to note from the above and data below; while the monthly ONI anomalous water temperatures are a bit higher earlier this year than in 1997, the SOI index was not as strong until this year until late this summer. In fact, the SOI in 1997 was stronger earlier than 2015 and continued stronger on both an ONI and SOI basis well into the Winter of 1997-98. This comparison of course, is based on projections of El Nino for the upcoming winter, which may turn out more variable than projected. This winter's El Nino is projected to peak the in the November - December time-frame but then, fall rather rapidly after. The above could be said about the later stages of the 1982-83 El Nino, where the ONI topped in the December-January time-frame but the SOI remained very strong well into the Spring of '83.
ONI
Jan Jun Dec
1997
|
-0.5
|
-0.4
|
-0.2
|
0.1
|
0.6
|
1.0
|
1.4
|
1.7
|
2.0
|
2.2
|
2.3
|
2.3
|
1998
|
2.1
|
1.8
|
1.4
|
1.0
|
0.5
|
2015
|
0.5
|
0.4
|
0.5
|
0.7
|
0.9
|
1.0
|
1.2
|
1.5
|
1.7
|
|
|
|
1982
|
0
|
0.1
|
0.2
|
0.5
|
0.6
|
0.7
|
0.8
|
1.0
|
1.5
|
1.9
|
2.1
|
2.1
|
1983
|
2.1
|
1.8
|
1.5
|
1.2
|
SOI


Back in 1991-92 period, the El Nino's SOI development was much more akin to the 2015 development, though not quite as strong as this year, 1997-98 nor 1982-83. Reviewing the rest of the El Nino's (the ONI's where available and SOI's back into the early 1900s) from my selected analogue years, brought up some interesting finds in regard to strength and timing of that strength. Since the ONI's are not available for earlier strong El Nino's, a comparison of SOI's is beneficial to give a broader view of both the Pacific SST's and pressure patterns. The Southern Oscillation Index, or SOI,
gives an indication of the development and intensity of El Niño
or La Niña events in the Pacific Ocean. The SOI is calculated using the
pressure differences between Tahiti and Darwin.
The best matches for strength and timing of the El Nino's was the aforementioned 1997-98 (the ONI's not SOI's), 1991-92, except it did not contain quite as warm ONI's as the current El Nino and 1940-41 which may turn out the best overall comparison in these two categories. Since the ONI is not available for 1940-41; we will now compare the SOI's. of 2015, 1991-92 and 1940-41. The traces and patterns of the three that are most similar thus far:
Current Data
Late October 2015 Pacific Anomalies
10/25/15 changes
| Index |
Previous |
Current |
Temperature change
(2 weeks) |
|---|
| NINO3 |
+2.3 |
+2.2 |
0.1 °C cooler |
| NINO3.4 |
+2.1 |
+2.2 |
0.1 °C warmer |
| NINO4 |
+1.1 |
+1.3 |
0.2 °C warmer |
| Index | August |
September |
Temperature change |
|---|
| NINO3 |
+2.0 |
+2.2 |
0.2 °C warmer |
| NINO3.4 |
+1.9 |
+2.0 |
0.1 °C warmer |
| NINO4 |
+1.1 |
+1.1 |
no change |
Projections Winter 2015-16
A
classic El Nino is projected by all models /CFSv-2 below/ for the Winter of 2015-16 with a stationary
/slight weak drift to the west, late winter and spring with the max anomalies gradually fading under the cooler season. If the shift west occurs somewhat, this would indeed set up a more of a Hybrid affect.
At this time, this classic or traditional El Nino in the Pacific is projected to maximize early in the winter, typical for El Nino.
Recently, it has been discovered there are basically two types of El Ninos; the centrally based or Hybrid El Nino (El Nino Modoki) and the easterly based, called Classic or Traditional.
Different Types of El Niño Have Different Effects on Global Temperature
The El Niño–Southern Oscillation is known to influence global surface
temperatures, with El Niño conditions leading to warmer temperatures
and La Niña conditions leading to colder temperatures. However, a new
study in
Geophysical Research Letters shows that some types of
El Niño do not have this effect, a finding that could explain recent
decade-scale slowdowns in global warming.
The authors examine three historical temperature data sets and
classify past El Niño events as either
traditional or central Pacific (El Nino Modoki). They
find that global surface temperatures were anomalously warm during
traditional El Niño events but not during the central Pacific El Niño
events.
They note that in the past few decades, the frequencies of the
two types of El Niño events have changed, with the central Pacific type
occurring more often than it had in the past, and suggest that this
could explain recent decade-scale slowdowns in global warming.

This is what the Japanese Department of Meteorology JAMSTEC has to say about Modoki.
"El Nino Modoki has recently
been identified as a coupled ocean-atmosphere phenomenon in the
tropical Pacific Ocean and has been shown to be quite different from
the canonical El Nino/Southern Oscillation (ENSO) in terms of its
spatial and temporal characteristics as well as its teleconnection
patterns (Ashok et al. 2007; Weng et al. 2007; Ashok and Yamagata
2009). Traditionally the term “El Nino” was used for the canonical El
Nino associated with warming in the eastern tropical Pacific. However,
as we realize now, during El Nino Modoki the sea surface temperature
(SST) anomaly in eastern Pacific is not affected, but a warm anomaly
arises in the central Pacific flanked by cold anomalies on both sides
of the basin (Fig. 1). Together with its counterpart La Nina Modoki,
when colder central Pacific is flanked by warmer eastern and western
Pacific, the new phenomenon is now called as the ENSO Modoki that
assumes both warm and cold phases of its behavior. Several studies have
shown that the ENSO Modoki has become more prominent in recent times,
as compared to ENSO, and thereby changing the teleconnection pattern
arising from the tropical Pacific. Moreover, the associated decadal
changes in the sea level are shown to affect not only the islands of
central Pacific but remote regions off California and southwestern
Indian Ocean (Behera and Yamagata 2009)Figure 1: Schematic diagrams of
El Nino Modoki and La Nina Modoki the two phases of ENSO Modoki.
The ENSO Modoki has distinct
teleconnections and affect many parts of the world. For example, the
West Coast of United States of America is wet during El Nino but dry
during El Nino Modoki (e.g. Weng et al. 2008). Recent studies show
that teleconnections associated with ENSO Modoki influence the rainfall
over India and South Africa (Ratnam et al. 2010; Ratnam et al. 2011)."
II - Winter Oscillations
Hemispheric oscillations remain the most illusive trends or phases to predict more than a week or two. I starting researching and studying about them back in the mid 90s and to this day, there has been no tried and true way of predicting them for more than a few weeks. It certainly would help if we knew for certain the main phase each oscillation will be in along with expected interactions with teleconnection patterns. That isn't to be said there hasn't been advancement in research and studies of the various oscillations, some of which I'll discuss here and how it pertains to this upcoming winter.
NORTH ATLANTIC/ARCTIC OSCILLATION - NAO/AO
Generally, the North Atlantic Oscillation NAO is the most discussed and main key player influencing our weather in the central and eastern U.S. The NAO/AO and its phases can be one of the make or break influences on weekly, monthly and seasonal forecasting.
The monthly trace on the chart below shows the NAO oscillations for better than the past century. The inclusive Arctic Oscillation/AO is basically a subset of the larger North Atlantic Oscillation.The
Arctic Oscillation often shares phase with the North Atlantic
Oscillation (NAO), and its phases directly correlate
with the phases of the NAO including its implications on weather across the
U.S.
The dominant
positive phase of the NAO for the
past couple of winters is easily seen here on the DJFM chart below.
Remember our severe cold in the second part of the Winter of '14 and '15 was due more in part to occasional strong negative EPO (discussed below) and subsequent southward displacement of the Polar Vortex!
Just recently forecasted, the phase of the NAO/AO for the upcoming 2015-16 winter is anticipated to revert back to more of a negative phase for the winter. The negative phase was also seen more during our past summer, which helped keeping a lid on hot weather.
Note below the strongly negative phase back in our tepid July and short term projection, the second half of November. This short term drop in November should allow colder, Polar air into the region the second half of the month.
So, what are the exact projections for this winter thus far? Keep in mind the projected NAO forecast seen below from
Kyle MacRitchie, a PHD student who has been working on projecting out the NAO and other Oscillation phases for several years.
In addition,
AER scientist Dr Cohen has been on a trail-blaze of sorts by projecting the NAO in part due to Siberian snow cover in October. Author Judah Cohen, Ph.D., works at Atmospheric and Environmental Research (AER), a division of Verisk Analytics. Let's look at his maps as we dig through the snow...
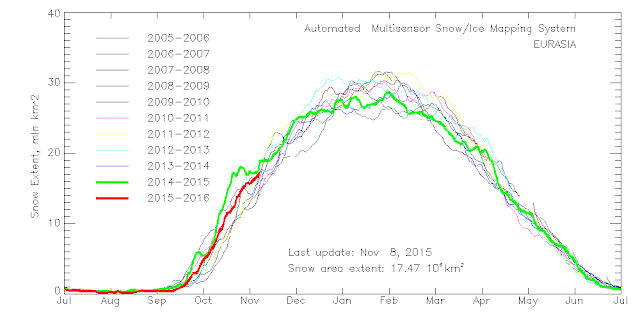
The snow cover this October 2015 was again above normal, though not a much as the past few winters. See his latest discussion and attending snow cover plot for the past several years.
Northern Hemisphere Snow Cover
Seasonal snow cover continues to advance both across Eurasia and
North America, though so far snow cover has advanced more rapidly across
Eurasia. Eurasian snow cover is above normal at this time (Figure 10).
Eurasian snow cover extent for the month of October was above normal.
Also recently the snow cover across Eurasia has advanced more to the
south across East Asia. This has resulted in an even higher value for
the snow advance index (SAI) value for October, since only snow cover
equatorward of 60°N contributes to SAI values. Above normal Eurasian
snow cover extent for the month of October favors a negative winter AO.
Pacific Decadal Oscillation/Eastern Pacific Oscillation - PDO/EPO
The warm waters extending up and down the West Coast represent a recent warm Pacific Decadal Oscillation PDO phase that commenced in early in 2014; as it went from mostly negative values to a very strong warm phase which continues dominant today. This still may be short lived since the overall 30 - 40 year term phase reversed to general cold phase, just after the last major El Nino in 1998. Back in just 2008; the transition
was completed as recent observations of the coastal waters have been
among the coolest in the past 109 years.
The warmer waters on the West Coast up into Alaska encouraged strong ridging on the Coast at times during the last two winters. This encouraged a -EPO I mentioned in previous Outlooks (the first back in the moderate El Nino Winter outlook in 2002-03) as a major participant in the cold winter periods then and the past few winters. Thus far, as seen by the El Nino projection maps, the unusually warm waters remain as of late fall. This too will have to be watched and could challenge El Nino's warming affects at times. Checking back in the ENSO section above, there is a notable difference between the West Coast water temperatures in 1998 as opposed to 2015.
The
QBC is a tropical stratospheric wind that descends in an easterly then westerly
direction over a period of around 28 months. This can have a direct influence
on the strength of the polar vortex in itself. The easterly (negative ) phase
is though to contribute to a weakening of the stratospheric polar vortex, while
a westerly (positive) phase is thought to increase the strength of the
stratospheric vortex. However, in reality the exact timing and positioning of
the QBO is not precise and the
timing of the descending wave is critical throughout the winter. At this time,
the QBO is westerly and is this expected continue throughout the winter.
Westward phases of the QBO often coincide
with more sudden stratospheric warmings, a weaker Atlantic jet stream and cold
winters in Northern Europe and eastern USA whereas eastward phases of the QBO often coincide
with mild winters in eastern USA and a strong Atlantic jet stream with mild, wet
stormy winters in northern Europe (Ebdon 1975).
III - Strong El Nino Analogues for the Winter of 2015-16
General Take
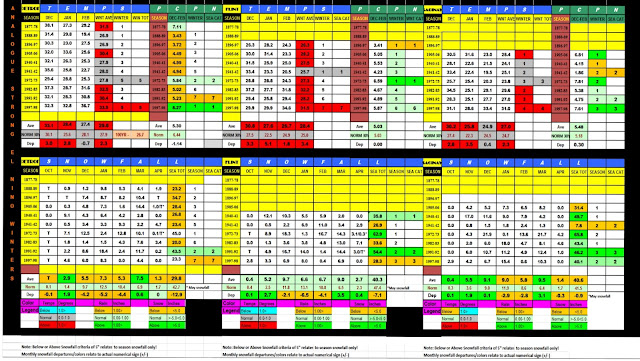
The warmth talked about with El Nino is reflected well across the El Nino analogues; so much so that this is the warmest set of winter analogues I believe I've seen. This is also the first time I can recall there were no below normal
winters (for our general purposes; a degree or more below normal).
That being said; if one digs through the data, actually two types of winters emerge; The warmer with light amounts of snow winters and the mild (near normal to a couple of degrees above), mixed temperatire and precipitation winters with nearer normal snow. This is also the first time I can recall there were no below normal winters (for our general purposes; a degree or more below normal).
Digging Further
Temperatures
Interestingly, when using the large set of available data /Detroit/, there were five "warm" winters and five "normal" winters. All warm winters averaged 30 degrees or better, while the normal winters averaged within a degree of normal. Our "coldest" winters were all hit with a below normal month, February 1889, January 1897 and February 1942. The two other normal winters 1940-41 and 1972-73, monthly temperatures were more uniform.
On the flip side; the warmest winters had two or three months average above 30 degrees; Winter of 1905-06, 1982-83, 1991-92 and 1997-98 in which all three months averaged above normal. Maybe not surprising; the Winter's of 1982-83 and 1997-98 are the warmest winters at all three cities.
Looking at particular months; December has the best chance to average above normal with January, the second best. This jives well with El Nino peaking in that time period and affecting the downwind jet stream. The month with the best chance for colder weather was late in the season with February (some Marches followed that trend). Again, with El Nino fading by then, it stands to reason and as always timing of the dominant patterns can vary.
Snowfall/Precipitation
With snowy winters (above normal snowfalls) dominating the past 10 - 15 years, the season snow outlook for snow lovers is rather dreary. In fact, like the warmer temperature dominance this analogue go-around, snowfall averaged on the lightest side of past analogue winter totals seen at Detroit. Snowfall deficit runs from around a foot at Detroit to just a inch or so at Saginaw. This also fits with thinking of the polar jet still affecting the Lakes enough to bring near normal snows in that region.
However, all is not lost snowfall lovers! Two winters contained normal snowfall at Detroit, one normal and two above normal at Flint and finally; two normal and three above normal at Saginaw. Therefore, the most obvious pattern seen in these winters is that the further north one goes in Southeast Michigan, the better chance for more snow. The same can be said for general precipitation across the region. The Winters of 1991-92 and 1972-73 saw the best snows across the entire region with normal to above normal. The Winter of 1940-41 saw the next best "snow showing" the entire region but still well below at Detroit /26.8/ to near 50 at Saginaw /49.7/.The actual snow pattern for this winter will be watched for updates.
COMPOSITES
The temperature and
precipitation composites show the differences from all
available analogue winters
in the first two maps, the "cooler" El Nino winters in the second
two and "warmer" El Nino winter in the last two. Be advised, because of extremes, some scale departure numbers change.
All ANALOGUE EL NINO WINTERS
TEMPERATURES
PRECIPITATION
COOLER EL NINO ANALOGUE WINTERS
TEMPERATURES
PRECIPITATION
Note
the temperature/precipitation difference pattern during the "cooler"
strong El Nino winter's of 1896-97, 1940-41, 1941-42, 1972-73 and
1991-92. I included 1991-92 since it was borderline /near the 30 degree
ave/ and higher snow amounts, thus not a typical warm, drier El Nino
winter. It clearly shows colder conditions (normal to below from New
England west into the Great Lakes) and less warmth over a much larger
area, along with near normal precipitation in the Great Lakes.
WARMER ANALOGUE EL NINO WINTERS
TEMPERATURES
PRECIPITATION
Two of the warmest El Ninos occurred during the last two strongest El ninos, 1982-83 and 1997-98. Will history repeat itself?
Jet Stream and Storm Tracks
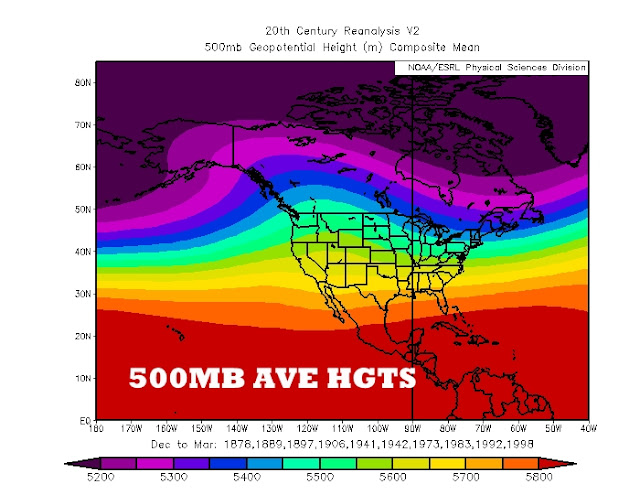
As discussed above in Hemispheric Patterns above; the strongest pattern affecting jet streams and storm tracks this winter is expected to be the very strong El Nino but next in line in my opinion are the NAO/AO and the EPO. All patterns below are a result of Winter Analogue years; 500 MB Heights and dominant jet streams and resulting storm tracks.
Look for updates and notable storm advisories during the upcoming winter!
Making weather fun while we all learn,
Bill Deedler -SEMI_WeatherHistorian

