6/30/16

Very Dry Weather Over Much of the Area Thus Far This Summer and Growing Season


Dedicated to Beloved Family Member: Mac: 9/14/98-6/26/16
                                   Dedicated to Beloved Family Member: Mac: 9/14/98-6/26/16  
 
The worst of the summer in Southeast Lower Michigan in many people's opinion of the season has been the dry weather; particularly if a one's a farmer, garden or owns a garden or landscape business. Thus far this summer /June/, we've generally had less than half the normal rainfall across the land. Of course, what makes matters worse is that May's average rainfall again, was also around a half or less of the normal. And, that is still not the extent of it; the rainfall since the start of this growing season /April/ has been in notably deficit with most areas receiving only 50 - 60% of the normal rain. See the chart below.


There is a chance of some rain overnight after midnight; so the June stats should remain the same as departures account for no rain through midnight.


                                   Growing Season 2016 Precipitation


How much the rainfall has been below normal can been seen on this departure growing season map below. Also note, the extreme dryness bulls-eye over southern Iowa and northern Missouri; while wet bulls-eye lies over northern Wisconsin and West Virginia with the recent flooding.


Adding to the dryness, June's warm temperatures have been normal to slightly above (about a degree or two).


That may be surprising since we've had some hot days in June. The main reason the average temperatures haven't been even warmer is that the dry weather allowed readings overnight to fall-off more appreciably. Humidity levels have been generally somewhat lower than normal for many summer nights.  Therefore, our daily diurnal temperature variances have been larger on average - a bit more typical of weather experienced in the Great Plains.

Because of a wet late winter and early spring /Mar/, the overall aridity of the region is still more surface based than deeply based. However; this offers no solace to plants and crops that normally have shallower roots than the deeply rooted ones. 


Drought Map and link for the Midwest and Michigan

Midwest and lower Ohio Valley

Highly variable rainfall was noted over the region’s Abnormally Dry (D0) and Moderate Drought (D1) areas. Relatively narrow swaths of moderate to heavy rain (1-4 inches, locally more) resulted in reductions of D0 and D1 coverage, most notably from Ohio into east-central Iowa. Conversely, D0 was increased over central and southern Michigan, where 60-day rainfall has totaled 50 to 70 percent of normal. Topsoil moisture in Michigan was rated 60 percent short to very short as of June 26 by USDA-NASS, a 13-point jump from last week and 57 percentage points higher than a year ago. While state-wide net gains were noted in soil moisture (percent short to very short decline week to week) from Missouri into Ohio, D1 was increased in southeastern Iowa and northeastern Missouri to reflect 60-day rainfall near or below half of normal. In the western-most Corn Belt, D1 was introduced in south-central Nebraska where 60-day rainfall was likewise less than 50 percent of normal.


http://droughtmonitor.unl.edu/Home/StateDroughtMonitor.aspx?MI


Ok then; Why the dryness??

The pattern expected for the summer of roller-coaster temperatures resulting from conflicting air masses has been strong as forecasted but most storms and rainfall resulting from it has been along and south of the southern border of Michigan. Add to this; timing of frontal passages and a occasionally capped atmosphere (too warm aloft) which inhibited storm growth has resulted in the dryness of much of Southeast Lower Michigan.

Note the big difference in rainfall the past month along and just to the south of the region and further west (resulting in some sharp contrasting differences in short distances)!


Again; there is a chance of some rain overnight after midnight but then much of the holiday weekend looks dry. Latest models have a system moving where else, just south of Southeast Lower Michigan on July 4th. Any changes, I'll update our chances.


Making weather fun while we all learn,
Bill Deedler -SEMI_WeatherHistorian


6/16/16

Strong Upper Air Patterns This June Continue to Battle It Out For Dominance!

Anyone watching the upper air patterns these past few months have noted the strong resilience of the cold upper low periodically settling down into eastern Canada. This has partly been resultant of a remarkable oscillating Arctic Oscillation pattern since spring. While this is a somewhat normal event, the strength and tenacity of the strong reoccurring upper low pattern is something to take note of, especially now that we are into summer. Anyone reading my blogs this past several months have seen my discussions on the effect this has had, and will have on Southeast Lower Michigan's weather. My latest Outlook discussed its likely effect this summer:

"I look for the summer to continue to display the more roller-coaster type of temperature pattern (not unlike seen this spring and also dominated, the Spring of '83) with sometimes significantly above, below and everything in-between but ultimately resulting in the normal or typical summer".

Note the active oscillations of late on the Arctic Oscillation:


While every season has its roller-coaster pattern of temperatures, I stated this summer is likely to be more exaggerated at times; due to a new upper low from Canada periodically battling the upper ridge over the south-central to southwest. And thus, this creates a see-saw type pattern over North America. Over the past few months, this has materialized and now, a more contrasting upper air height pattern is expected to form next week. This will result in a battle of air masses set for early in the week.

A strong early summer season upper high pressure area over the Southwest with upper heights pushing up to around 600 dekameters has and will continue to allow temperatures to rise well over the 100 degree mark in that region. The mountainous high pressure will help surface temperatures possibly challenge some all time record highs in that region. It will also influence our temperatures this weekend and Monday with high temperature readings in mid 80s to near 90. 

Meanwhile; the balance between the strong upper high pressure over the desert Southwest and cold upper low in eastern Canada /sub-546 dekameters/ is set to become unbalanced shortly. Meaning; the Canadian upper low is projected to aggressively kick the upper ridge back west and south. The strong upper low will surge southeast once again, toward southeast Canada and bring with it cool, modified Polar air for mid June. It should be noted however; next weekend the upper ridge is once again projected to build once again into the Plains and further northeast with time (the see-saw persists). Models are consistent with this change with varying amplifications and intensities and for simplicity sake, I will stick with the American Model /GFS/.


As it stands now for early next week:

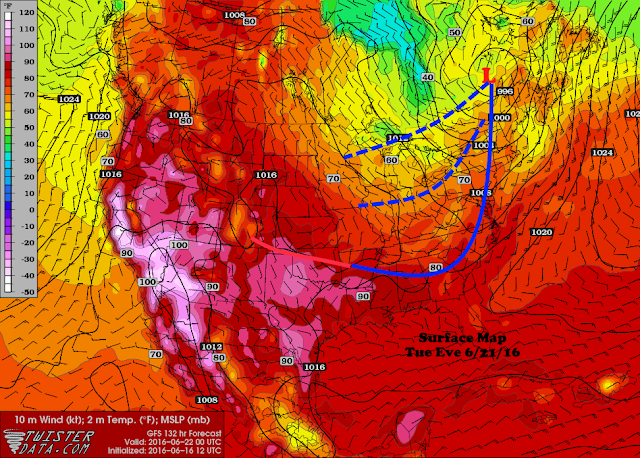
The cooler air from Canada, modified by the summer sun, will plow into the Great Lakes next Monday to Tuesday time frame. Latest indications the cold front will make it all the way into the deep south. It is also during this time frame, the potential rises for severe weather across the Lakes as the cold front dives southeast later Monday into Tuesday. If the potential increases as it is still early, I will send out a FB Weatherhistorian chat.


Note the radical change below in the upper air pattern in just a few days projected by the GFS as the upper low dives southeast and dislodges the impressive ridge west and south!


Also note the cooler, refreshing air is progged to surge well south with reinforcing waves of cooler air pivoting southeast across the Lakes early-mid week. This should push high temperatures back down into the 60s and 70s into at least mid week.


Ironically; the summer solstice this year will also be on Monday June 20th at 624 PM when the expected cold front is slated to move through the Great lakes.

In addition; here's another interesting tidbit about this years solstice: 

This June 20, the Full Moon appears on the same night as the June Solstice! A Full Moon hasn’t occurred on the same day as the Solstice since 1948.


Making weather fun while we all learn,
Bill Deedler -SEMI_WeatherHistorian


6/3/16

Summer 2016 Outlook: Ongoing Changeable Pattern And Analogues Makes Summer Prognostication Challenging

Looking Back At Spring - A Wild Ride!


No one has to be told what a changeable and variable spring we encountered across Southeast Lower Michigan. While temperatures averaged slightly above normal; getting there was certainly not a direct road. First half of March started out on the cold side only to warm up big-time later giving us a preview to mid-late spring's typical weather. By month's end; temperatures averaged around 6 1/2 degrees above normal! Meanwhile, rain and even snowfall despite the warmth was plentiful; a couple inches above normal as a whole. The first half of April did an about-face in the temperature department with a cold snap leading to temperatures averaging 5 to 7 degrees below normal (just the opposite of March). The rest of the month moderated some but still, April averaged a degree to three below normal depending on location. Precipitation amounts slacken off a bit in April with most areas seeing slightly below rainfall but normal to above snowfall due to the cold. May weather was all over the board; especially the second half with near record or record cold giving way to near record heat. As the heat increased, the rains decreased - not a good thing for the growing season nor the approach of June and Summer. A somewhat rare bird of sorts was seen in mid May with the cold bringing scattered pockets of snow and sleet (or graupel) on the 14th and/or 15th; setting snow records for occurrence on those particular dates. Latest snow observed around the region in May has been the 31st, fortunately this was not challenged this year. And speaking of a challenge...

Currently 


A rapidly changing ENSO pattern is quite evident in not only current data but projected data for the summer into the fall. El Nino has just about died a quick death and we are entering Neutral conditions for the summer, see current SST's broken down weekly for May 2016 (Chart -1) and model projections below that (Chart -2). Neutral SST's indicate really no influence from the Pacific for the summer into the early fall, anyway. This only heightens the complexity for an Outlook since summer typically has a weaker upper wind pattern pattern to start with, then add to this, a Neutral ENSO pattern, little in the way of patterns

Recently; the present pattern still has some of the "El Nino lag" with the southern jet quite active across the southern Plains and less further east and north. Meanwhile; the influence of the semi-stationary Polar vortex over northern into eastern Canada has been absent over the Great lakes during the latter half of May (Chart - 3, May 500 MB). This has lead to very warm conditions /near record at times/ with no substantial rains. Some areas have seen next to nothing to speak of since mid May.

Chart - 1


Chart - 2


Chart - 3


Summer 2016 - Where Do We Go From Here?


With the spring pattern all over the place; investigating the true trend of our recently past weather is difficult. Therefore; are there any patterns seen in the analogues that may match up with the current local and hemispheric pattern? Analogues below indicate a relatively normal summer as far as temperatures (within a degree or so) but with above normal rainfall; certainly contrary to the recent pattern, but not unlike our earlier spring pattern - what to do?


First off as far as Temperatures:


Recent variability but trends toward normal to above normal gives us a little more weighting to at least normal temperatures (the most predominant in the analogues) and against the three below normal summers displayed. On the flip side; I must mention, no where did I come up with a hot summer talked about in some media venues. Hot summer meaning placing in the top 10 warmest summers. As a matter of fact with the possibility of a cooler June (or at least dominated in the trend displayed strongly by the analogues) an outlook for a normal summer is more suitable.

Our best analogues this past winter, 1982-83 and 1997-98 contained normal summer temperatures averaging very close to 72; just a few tenths different from each other. Likewise; I look for the summer to continue to display the more roller-coaster type of temperature pattern (not unlike seen this spring and also dominated, the Spring of '83) with sometimes significantly above, below and everything in-between but ultimately resulting in the normal or typical summer. 

Summarizing: I look for temperatures to average 1 - 2 degrees of the summer norms across Southeast Lower Michigan.

Rainfall:


Recent rainfall trends in late May certainly contradict the dominant analogues for the summer with a preference for above normal rainfall. Out of the limited seven analogues, five were wetter than average (and inch or better above normal), one normal (within an inch of normal) and one below average (an inch or more below average).


There was quite a range of totals from as little as 5 inches way back in 1889 to just over 15 inches even further back in 1878. More recently however, over 12 and a half inches /12.60"/ was measured during our waning period of the last very strong El Nino in 1998.


Comparing the two best analogues of the winter at Detroit; 1982-83 and 1997-98; 1983 was a better analogue for temperature trend of the winter but was drier during the winter; then became wetter that spring and summer. The Winter into Spring of '98 was somewhat more uniform in precipitation amounts and pattern. Both analogue summers turned out wet (over far Southeast Lower Michigan around Metro Detroit). Ironically; both also contained above normal precipitation amounts  of 11 to 12 1/2 compared to a normal of just under 10 inches /9.89/.

However; researching further north in Southeast Lower Michigan gives a different account of rainfall distribution (though Flint and Saginaw analogues not shown for the summer, rainfall is below). Drier conditions prevailed further north from the Flint and Saginaw area into the Thumb region both in 1983 and 1998, particularly in the Summer of '83, when all areas in Southeast Lower Michigan saw a dry August. The one trend that continued was the variability of rainfall amounts and summer distribution. Analogues strongly suggest at drier and wetter regions over Southeast Michigan for the summer with the more likely the  drier areas, further north. 


In conclusion: Look for rainfall to average normal to above across the southern half of Southeast Lower Michigan and normal to below across the northern half.

Another interesting item noted was both summers were fairly busy with thunderstorms and logically as one might think; more occurred where the higher rainfall totals were over the southern areas, or south of I-69. Just as an example on how skewed summer rainfall amounts can be with convective rains; most of the 4.24" of rain of July's 5.72" total at Detroit in 1998 fell in one thunderstorm complex on 7th. Now, this doesn't necessarily mean it will happen exactly like that again this summer as far as rainfall amounts and distribution but an item to keep in mind.


Detroit

1983    June                      July                     August

4.88 4.53 1.57

1998

2.69 5.72 4.19


Monthly Rainfall Flint|Saginaw for Summer's of '83 and '98


1983


    June          July        August

3.942.06 2.241.66 2.262.32


1998


    June          July        August

1.251.81 1.131.30 2.62 1.51


Severe Weather


Later analogues that contain data; 1973, 1983 and 1998 all had their abundance of storms and occasional severe weather during the summer. Severe weather, thus far through the spring season has been almost absent; so any increase would be notable. Most storm activity occurred when we generally peak, mid June to mid July.  Another second peak was noted mid July thru August. 


What does our finest season model /CFV2/ project for the Summer?


Temps:


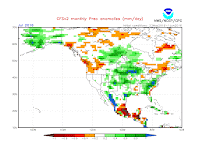
Rainfall


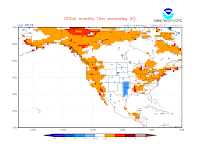
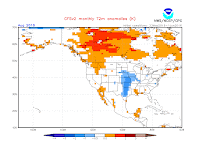
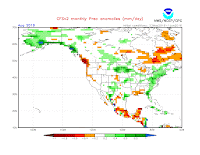
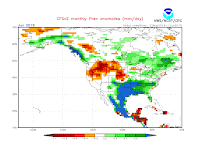
Basically; it looks very similar to the researched and chosen analogues this time around. Temperatures near normal and precipitation normal to above. Even detecting a "shading" or possibility of higher rainfall across the southern portion of Southeast Lower Michigan.


Whittling it down further by month (JJA - click on the maps for better resolution).


Temp                                                                                Precip


Have a great summer and try to enjoy the weather when able because before you know it; winter will be just around the corner. Thus far, a La Nina Winter is expected at that; hmmm.

Making weather fun while we all learn,
Bill Deedler -SEMI_WeatherHistorian