Summer 2012 Outlook For Southeast Lower Michigan
By: Bill Deedler; Southeast Lower Michigan Weather Historian
May 31st, 2012
Temperatures:
Overall, I look for summer temperatures to average cooler than last summer with closer to normal temperatures to slightly above normal /-1.0 to +2.0 degrees/. Local analogue data for this summer generally shows a variable summer temperature pattern as would be expected with negligible Pacific effects. More importantly for this summer are recent upper wind developments and projections for these upper wind patterns. Several models (see below) suggest the ridging over the High Plains eastward into the Mississippi Valley; will periodically expand east across the Great Lakes and East bringing heat into the region. In spite of the strong upper ridge however; will be the occasional influence of the upper level low and trough that made itself known this spring over eastern Canada when it still was able to penetrate; albeit infrequently, well south into the Great Lakes and Ohio Valley eastward to the East Coast.
Overall; the strong ridge is expected to continue to be a dominant player and will oscillate from the center part of the country to the east; bringing the periods of heat. Normal to below trends will be brought about by the dubious North Atlantic Oscillation /NAO/ cycling lower into neutral to possible negative phases (more below) which would aid in emphasizing the upper low and troughing over central and eastern Canada. Look for the number of 90 degree days this summer to closer to the normal /8 -14/.
Rainfall:
Overall rainfall this summer is challenging due to this past spring’s variable pattern. Recent patterns have been drier than normal conditions across the Ann Arbor into metro Detroit area. Wetter than average weather from the center part of Southeast Lower Michigan (around Flint into Port Huron) with about normal rainfall across the Saginaw Valley and Thumb Region. As I look into the summer; I feel this basic pattern will continue with normal to above rainfall from the I-69 corridor north; but normal to below south. Storm trends and severe weather are discussed under summer analogues.
Broad Scale Discussion
Last summer, generally Weak La Nina to Neutral conditions prevailed over the eastern Pacific through the summer. Then; another La Nina, albeit weaker than the Winter of 2010-11, formed again this past winter (2011-12). Recently, water temperatures moderated this spring to again, near normal or neutral conditions (Fig-1a).
Fig-1a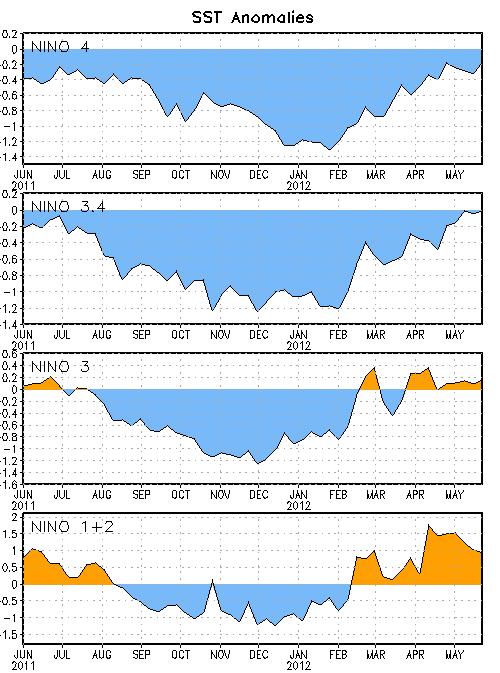
As one can see with Fig-1b/1c (location of Nino 3.4 and the projected sea surface temperatures /SST/ for the summer), the majority of model members are projecting a continuation of the recent warming (or moderation) of the sea surface temperatures /SSTs/ in area Nino 3.4. Latest mid-May guidance continues neutral conditions thru the summer with possibly a weak EL Nino commencing as early as late summer or early fall.
Fig 1b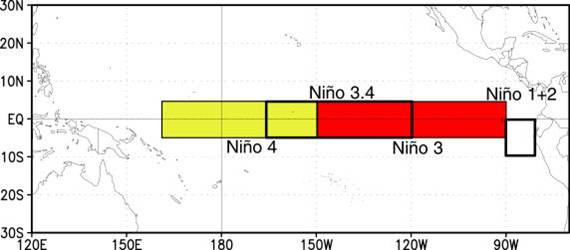
Fig 1c
Looking above at each specific dynamic model above shows they generally are in the same camp with the gradual warming expected to continue into summer and by late /JAS/, project just a hint of above normal readings. Under these conditions little, if any, significant downwind affects are slated for the Great Lakes. While there are some affects seen across the U.S. during stronger La Ninas (as with El Ninos), they are generally negligible when it comes to weak La Ninas, El Ninos or Neutral conditions, especially during the summer months.
Warm trend seen the past year or four seasons: Will that trend remain our friend?
Without a doubt; the most obvious and strongest trend seen by far in our (including much of the nation’s) weather has been the domination of warm, above normal temperatures relating much of the time directly to that dubious NAO/AO remaining in a positive phase (NAO+/AO+)! The unprecedented string of nearly continuous positive NAO/AO; especially the last three seasons of Autumn 2011, Winter 2011-12 and Spring 2012 has been astounding!
While this persistence has been almost unreal; will it continue especially since it’s gotten “so long in the tooth”? It is difficult to go against such a strong trend but sooner or later all “good” things come to an end. The very recent pattern change seen first very weakly early April, then again in early May and now; much more pronouncedly in late May into early June may be an early sign of a change (or at least back to some sort of “normalcy trend’). Then again; a recent change does not a long term pattern make. At this time it would be prudent to watch for more repeated break-downs in the NAO/AO to more neutral to negative territory. Therefore; I have chose to incorporate this recent trend in my forecast, somewhat.
Selected Projected Model Data for the Summer of 2012
The following temperature /C/ projections are from various named models for the summer.
All models show the general build up of heat (ridge) from Texas northward with a few suggesting a bit more north-northwestward. This summer pattern is almost a given; the big question is where exactly will the ridge and the eastern Canadian trough place. With some models hinting at the ridging placing in a “north by northwest” position this would be important since it would allow more periodic digging of the Canadian trough and subsequent cool downs for at least the Great Lakes. It also could imply some retrograding of the main eastern Canadian Low at times which could bring more extensive cool downs, depending on its strength. And; while on that upper wind wind scenario, check out below what I feel gives the best representations of the 500 MB pattern projected for this summer.
500 MB Projection A - NSIPP____ _______
500 MB Projection B - ECHAM____ _______
I like both of these projections upper wind projections because:
A) The NSIPP-1 model because of it’s general placement of the 500 MB long wave summer ridge (from Texas northward into the Dakotas but with expected occasional eastward building) and long wave trough extending from the Eastern Lakes into New England. Mom Nature, I feel has already shown her hand this late spring for our summer pattern. The notable ridge that has been in place and dominant and to a somewhat less extent; the Canadian upper low and trough - both key players.
B) The ECHAM4 model because of its somewhat flatter pattern with weak short waves (impulses) topping the ridge instigating storm action.
I researched both upper air patterns from past analogue summers (below) and they seem most realistic and in conjunction; will serve up our summer weather.
2012 Analogue Summers
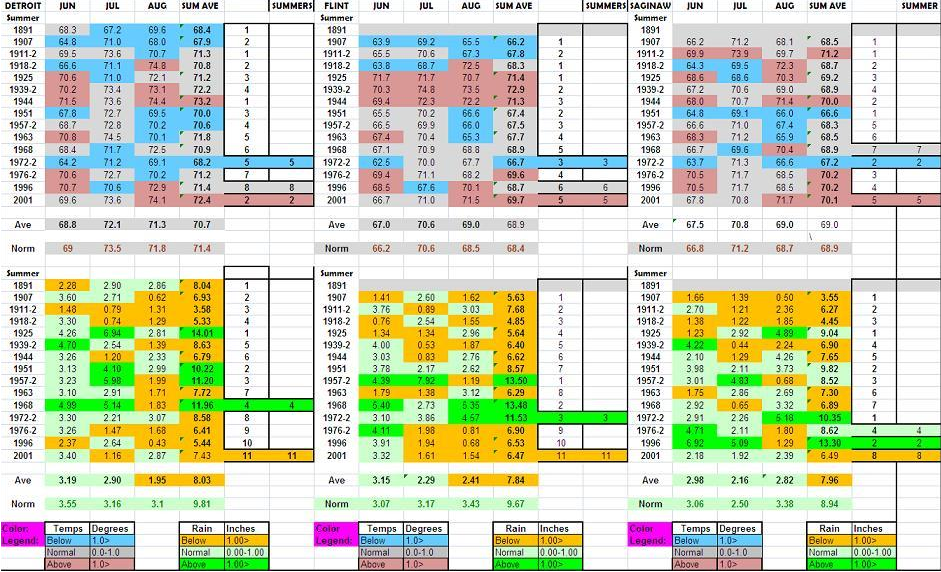
(Click on Analogue chart to enlarge)
Note: The number 2 on some years denotes the Neutral conditions came after a second La Nina. The general cycle was: La Nina-Neutral-La Nina-Neutral. Also; the 1971-2000 norms were used reflective of less contamination of the heat island affect (DTW). They are closer to the century average used in composite maps norms of 1895-2000 and recently used in previous La Nina to Neutral analogue patterns.
Analogue Summer Trends
Looking at the trends seen in the analogues suggest the summer temperatures will be mixed with the dominant trend more difficult to peg. While the upper warm ridge has been dominant this spring; the recent appearances of a negative NAO along with the evolution of the trough in Canada hints at this more mixed pattern seen in the analogues for the summer.
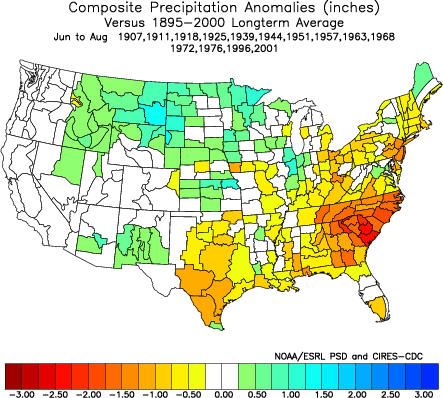
While most years were drier than normal, when it was wet, it was wet! When looking at just the statistics (of which I’m really not a fan of since they generally don’t tell the whole story), the odds this summer’s rainfall will come in an inch or more below normal are about 70%. In the past, when chances were that high in the analogue years, it was usually the way to go. What is troubling this time is when the rainfall came in above normal, it was well above normal! This says to me there is a decent potential of some extended battling of air masses and thus, some stalling of fronts (not to mention a higher risk of a forecast bust). The upper air pattern seen late spring could easily evolve into one of these patterns as the summer heats up and the trough in Canada holds somewhat tough, somewhere a confluent zone will likely set up along with heighten severe weather risks. At the same time, a dry or drier spell this summer looks just as likely and there‐in‐lies the problem. In this type of dilemma; the existing pattern of the location of previous rainfall pattern seems suitable.
Analogue Composite Maps Discussion:
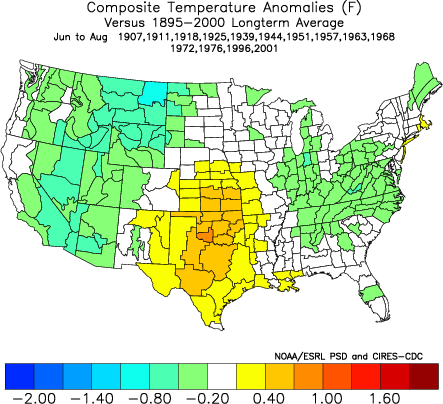
Analogue composite maps below reflect nicely the overall pattern suggested by the computer models for the summer. A Broad ridge extending from Texas northward (first NSIPP 500 MB map) but also hint at the flatter ridge with short waves rotating through the mean ridge (ECHAM). Of course; these maps reflect what happened and are only another piece of guidance. I feel they represent the overall pattern expected this summer. Take note; the average temperatures in the fine scale (ie: areas of green or light blue) are less than a degree below normal.
A few notes on the following composites:
1) Its best to look at the trend of the temperatures or precipitation for entire season. In other words, warm or cool periods don’t always come neatly wrapped up in one month, many times a trend is seen overlapping from one month into another The whole season may indeed start out above or below normal but toward the middle or end, temperature departures average the opposite.
2) The actual numerical departure value above or below for an analogue season projection is not as important as the sign(+/-) ahead of it.
ANALOGUE SUMMERS 2012 MAPS
(based on the 1895-2000 average)
Taking into account written above about analogue precipitation trends (very wet versus dry); they are less helpful since they represent the average of all the years.
Since this average temperature departure is derived from the 1895-2000
average temperature (as opposed to the 30 year norm), it would be nice
to know what the summer average (s) are in Southeast Lower Michigan
for that century plus period.
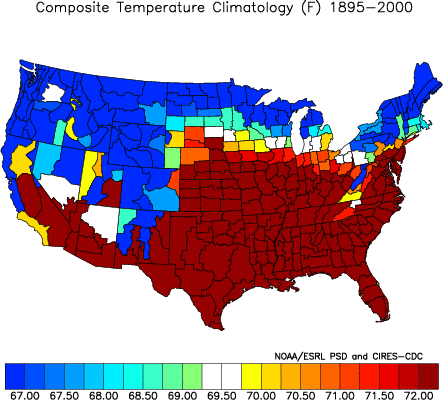
Actually two temperature averages are displayed for Southeast Lower Michigan.
Area-1 paints much of Southeast Lower Michigan (roughly from the Flint and
Port Huron areas south to the Ohio border), while Area-2 encompasses the
Saginaw Valley and Thumb Region. Note history tells us that the Saginaw Valley
and Thumb Region summers are a few degrees cooler on average than the
remainder of Southeast Lower Michigan.
Area-1 displays a summer average of about 70.5
Area-2 displays a summer average of about 68.5
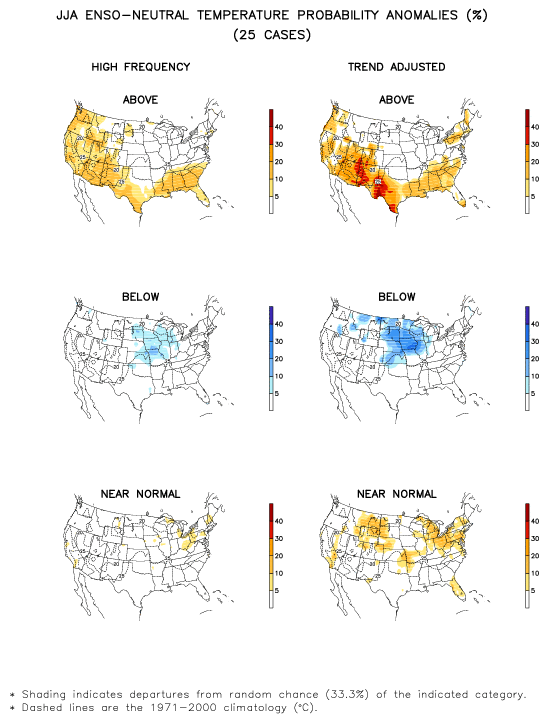
Since it is expected that Neutral conditions will prevail during the summer, it might be worthy of a look at past effects over the country when Neutral conditions existed. The top maps denote above normal, the middle below and the bottom, normal. This agrees with our local data of the dominance Note, the Climate Prediction Center /CPC/ explains these two categories (high frequency and trend adjustment) this way:
There have been significant trends in precipitation and surface air temperature
at many locations in recent decades, so it is worthwhile to examine the influence
of trends on ENSO composites. For this purpose, two basic types of composites
are examined:
- High-frequency (denoted HF) composites
- Trend adjusted (denoted TA) composites
If conditions warrant, an updated Summer Outlook will be sent.
Have a good summer, enjoy any time off and may good weather be
your traveling companion.
SUMMER BEGINS: JUNE 20th at 709 PM EDT
Making weather fun while we all learn,
Bill Deedler -SEMI_WeatherHistorian