12/24/23

Early signs show a Major Shift in the Polar Vortex, with a Strong Stratospheric Warming Wave now likely to bring a more Wintry Weather pattern in January

The Following was issued by the Severe Winter Europe Discussing the Upcoming  Strong Stratospheric Warming Which Will Affect the Northern Hemisphere.

Early signs show a Major Shift in the Polar Vortex, with a Strong Stratospheric Warming Wave now likely to bring a more Wintry Weather pattern in January

A strong Stratospheric Warming event is starting to appear in the forecast for January. It means a weakening or even collapse of the Polar Vortex and could bring a much-expected weather pattern change across the United States and Europe as we head deeper into Winter.

We already discussed a major January weather pattern shift in our recent articles. But we never really got an in-depth look at all the mechanics behind a strong weather shift across the United States.

In this article, we will look at the stratospheric Polar Vortex, one of the main culprits behind mid-winter weather pattern shifts. We will quickly look at what it actually is before focusing on the upcoming stratospheric warming event and potential winter weather outcomes in early January.

polar-vortex-north-hemisphere-winter-2024-january-february-forecast-united-states-canada-stratospheric-warming-brings-cold-weather-pressure-anomaly
 

POLAR VORTEX OVER THE NORTH

 
The best way to understand the Polar Vortex is to visualize it. In simple terms, it is just a name that describes the broad winter circulation over the northern (and southern) hemispheres.

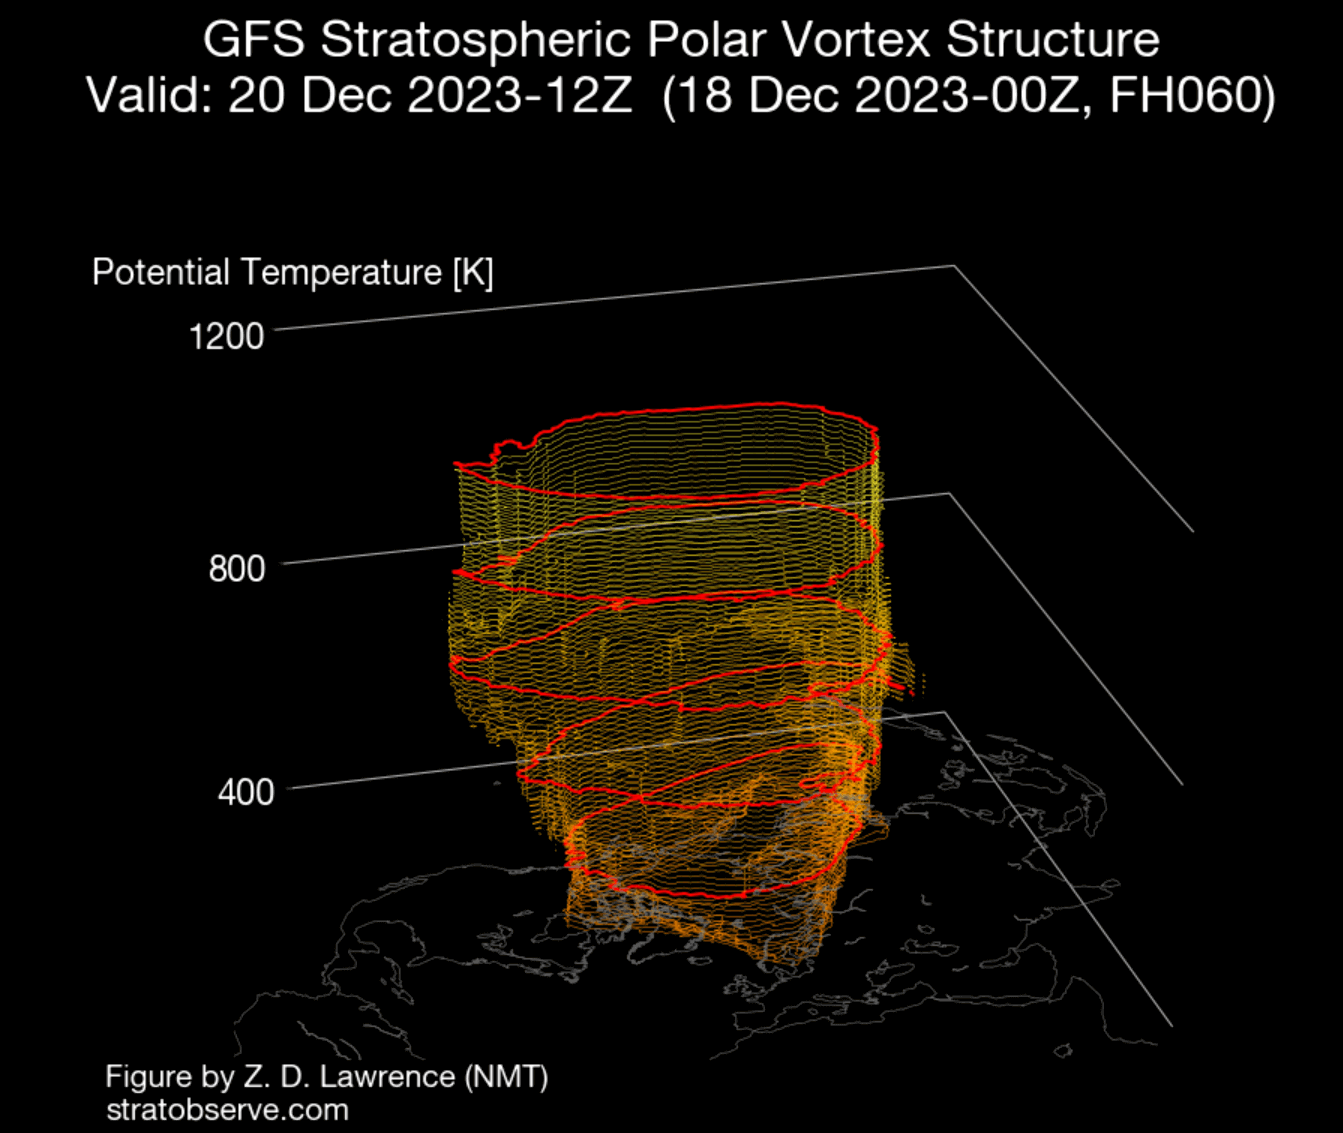
Below, you can see a 3-dimensional image of the Polar Vortex. The vertical axis is greatly enhanced for better visual presentation. It basically shows the actual structure of the Polar Vortex, connecting down to the lower levels and to the pressure systems.

winter-2024-polar-vortex-circulation-warming-collapse-weather-forecast-united-states-north-hemisphere-pressure-3D-structure-cold-snowfall

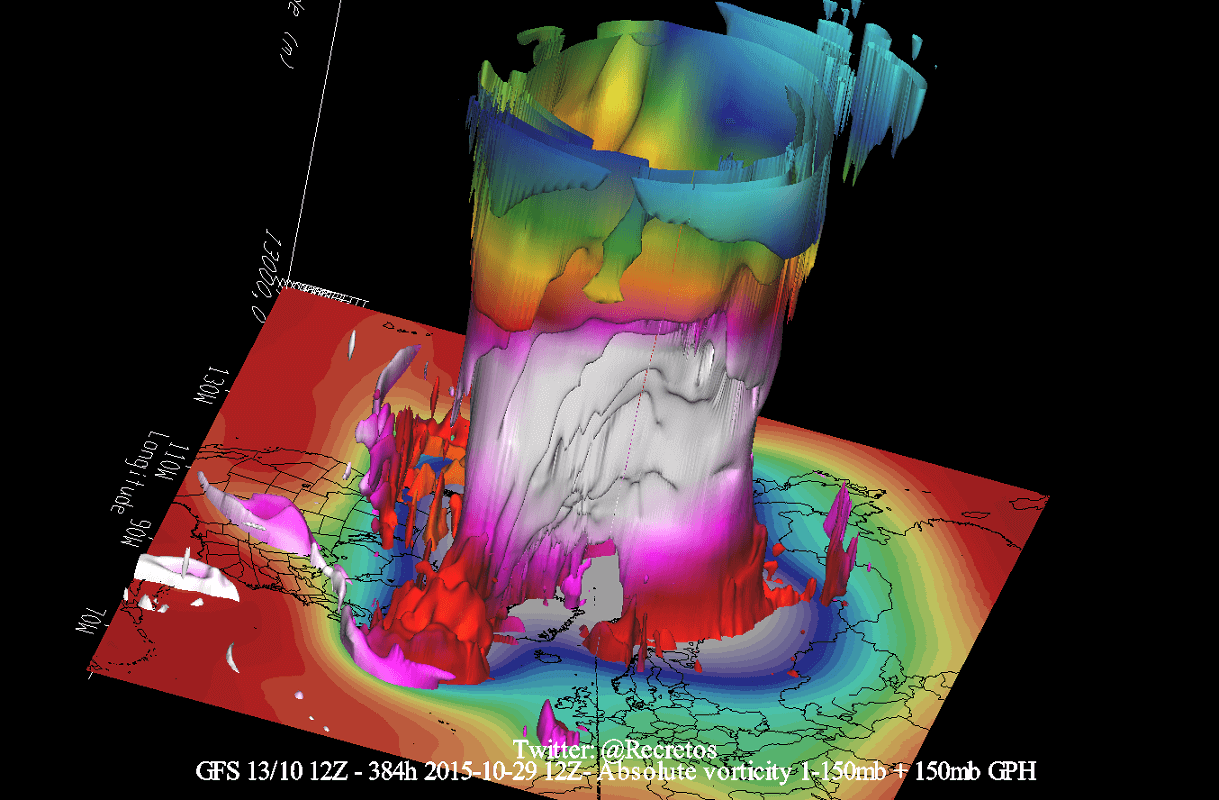
The Polar Vortex extends high up into the atmosphere. The lowest level of the atmosphere is called the troposphere, where all the weather events are. But above that, we have the stratosphere, a deeper and drier layer, and the home of the ozone layer.

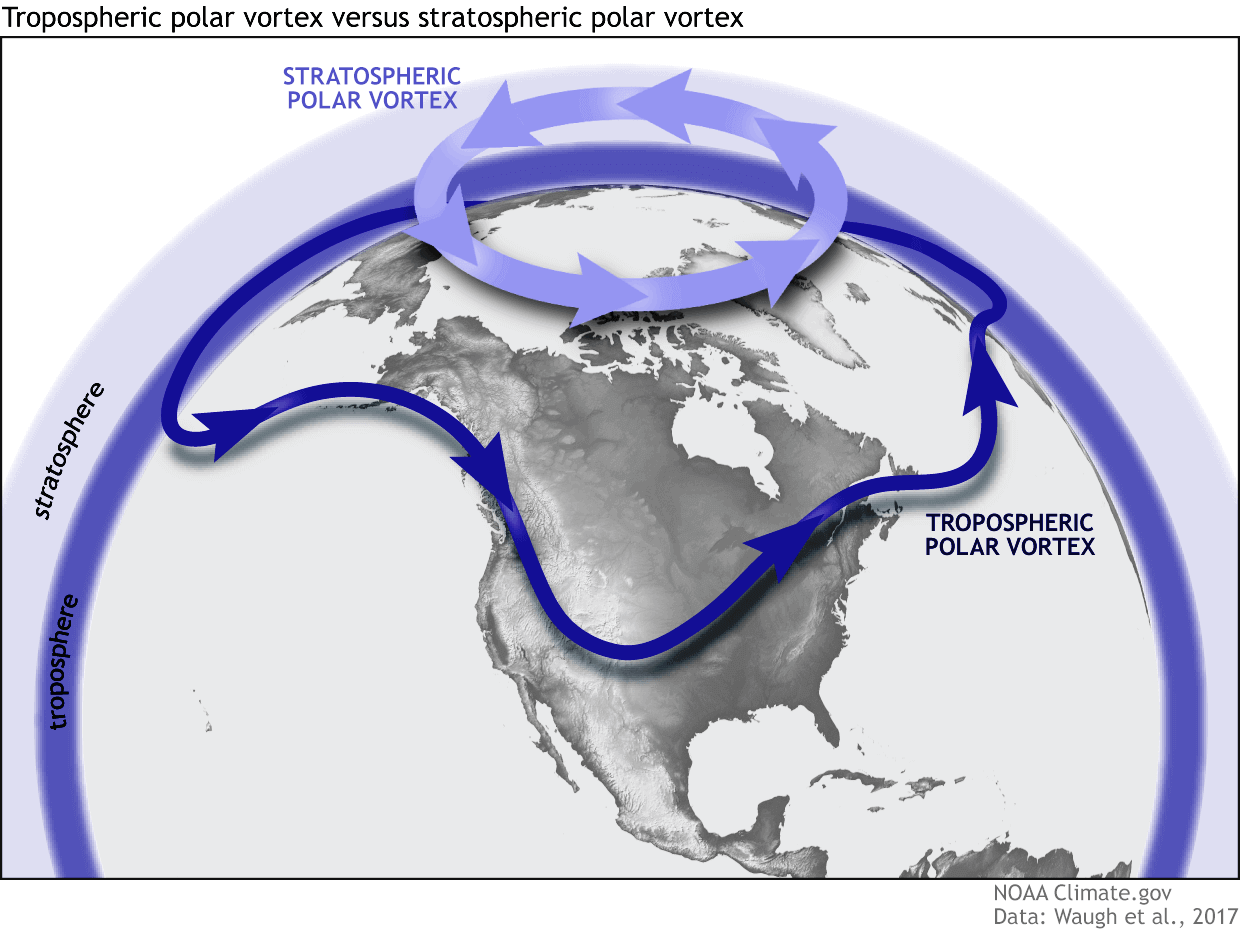
For this reason, we tend to separate the entire Polar Vortex into an upper (stratospheric) and a lower (tropospheric) part. They both play their role differently, so we monitor them separately. But both parts together form the winter circulation across the Northern Hemisphere.

polar-vortex-sudden-stratospheric-warming-tropospheric-what-is-it-north-hemisphere-winter-weather-forecast-pattern-snowfall-cold-united-states

To put the Polar Vortex into perspective, we produced a high-resolution video below, which shows the Polar Vortex in 3D, giving you a better idea of what it actually looks like. But note that the vertical size of the vortex was greatly enhanced for visual purposes.

 
The main takeaway from the video should be that the Polar Vortex is not just one winter storm or a cold outbreak that moves from the Midwest into the eastern United States. It is the entire weather circulation over the Northern Hemisphere.

Now that we know what the polar vortex is, we will look at the latest analysis, the forecast for the near future, and also at the extended-range forecast of weather patterns.
 

CURRENT STATE OF THE POLAR VORTEX

 
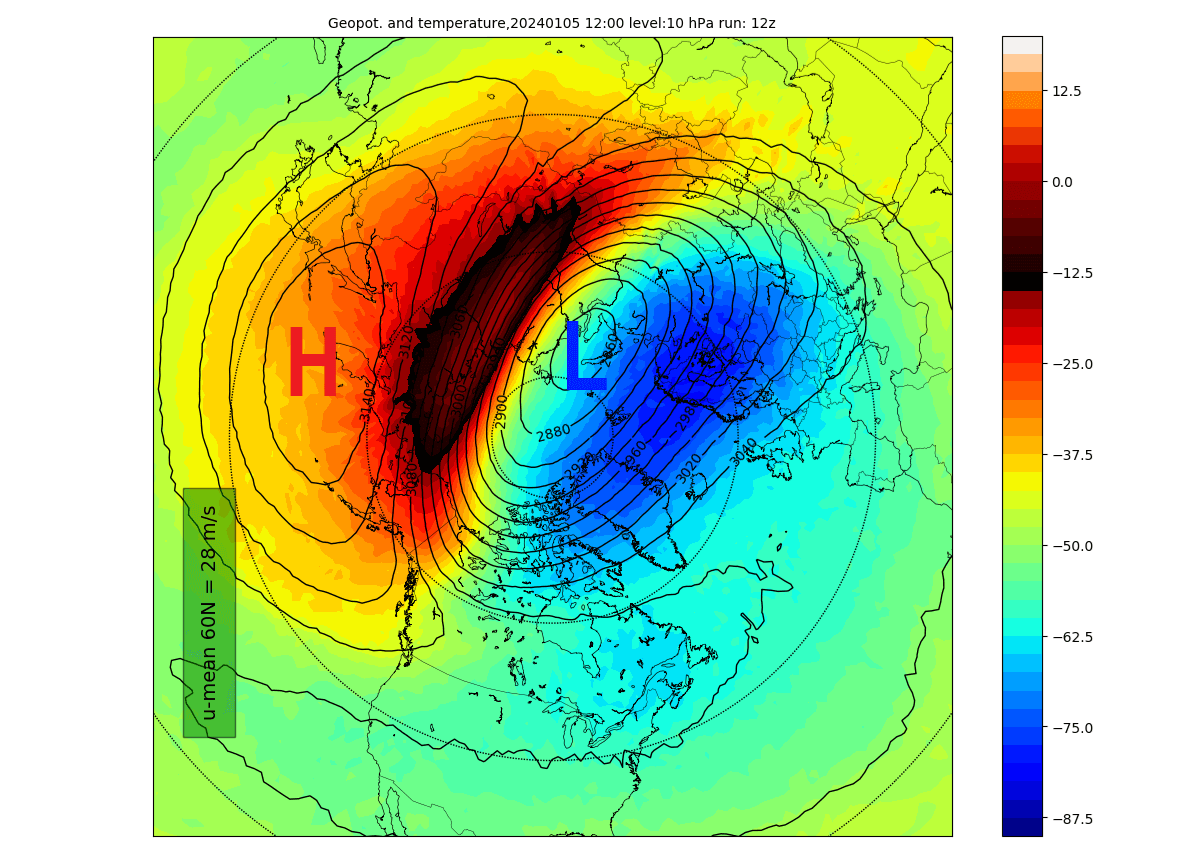
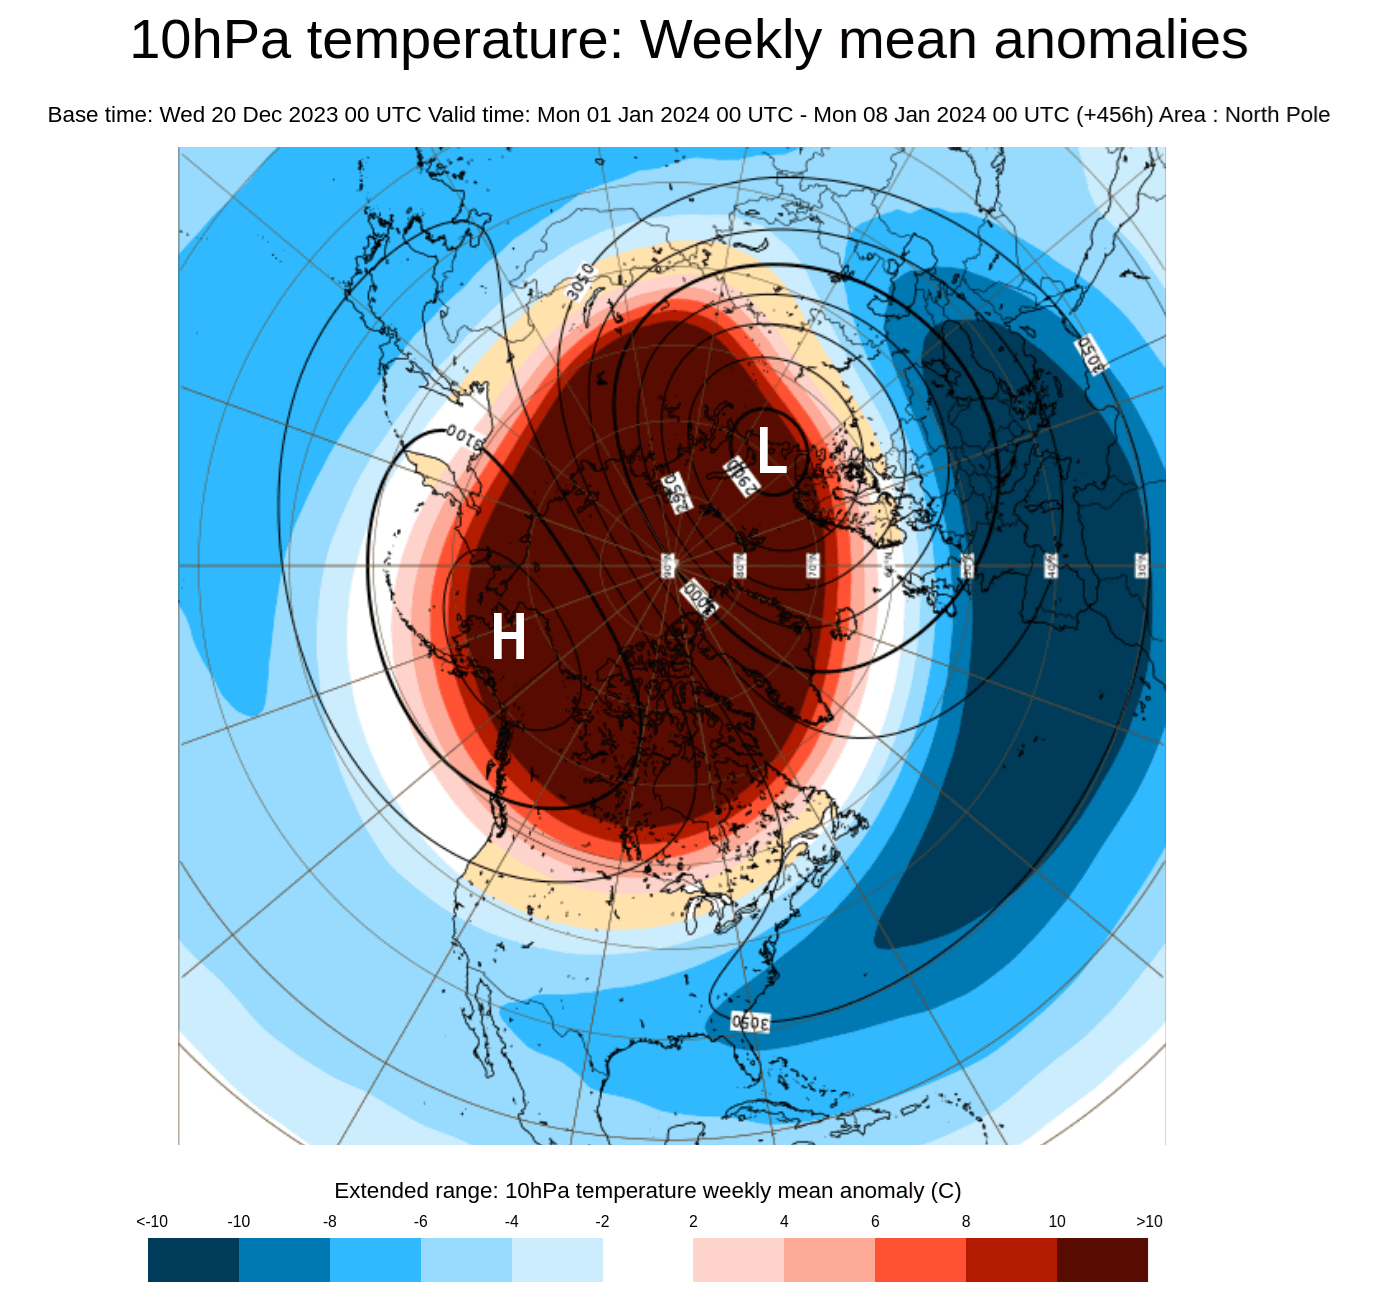
The Polar Vortex is currently normal in size, but it is displaced due to a high-pressure area over the North Pacific. The image below shows geopotential height and temperature in the mid-stratosphere at the 10mb level (30km/18.5miles). The Polar Vortex looks like a “cyclone” with a cold core near its low-pressure center. Image by weatheriscool.com

polar-vortex-north-hemisphere-forecast-analysis-december-temperature-pressure-area-stratosphere

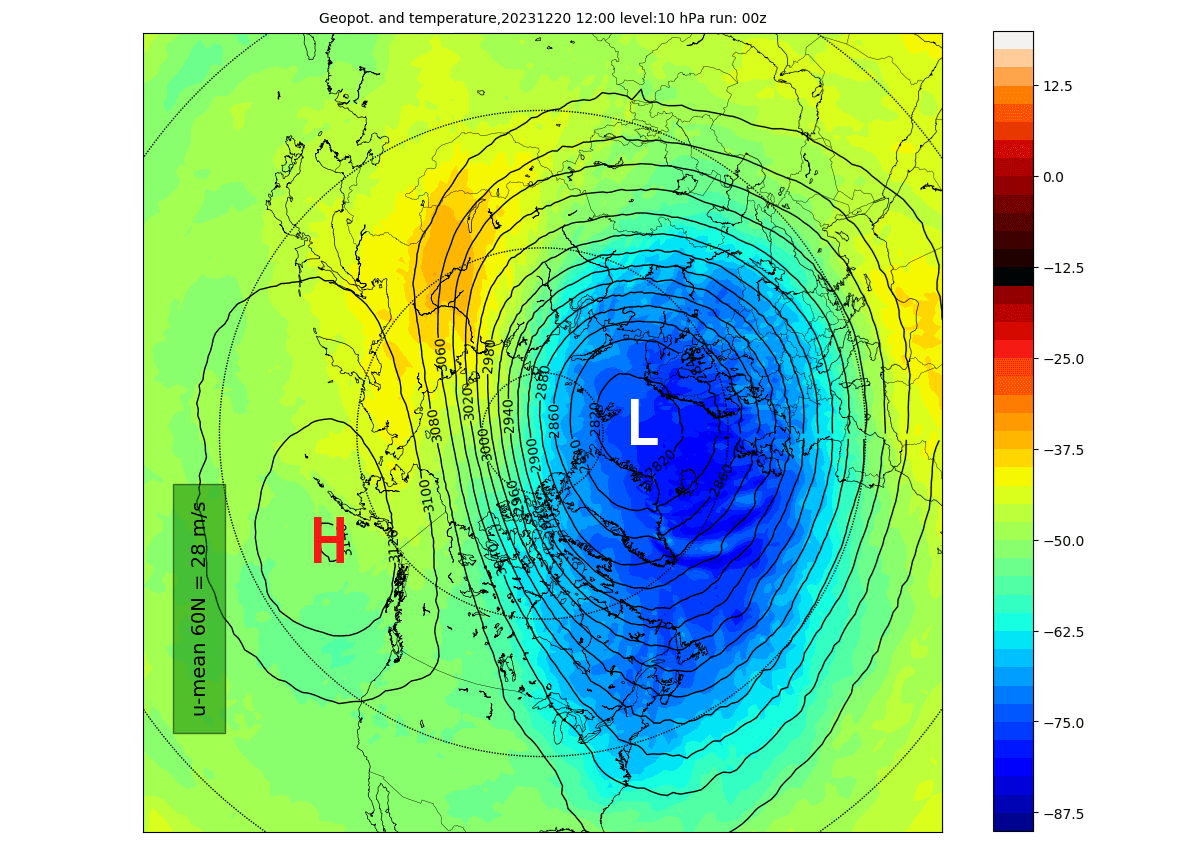
You can see a weak, warm wave on the border between the pressure systems. This is only a small warming wave, with a stronger event expected to develop.

If we look at the 3D structure of the whole Polar Vortex, we can fully see the current compact structure of the Polar Vortex. It is not circular in shape but rather elongated and compressed. That is because a stratospheric high-pressure area is pressing against it.

stratospheric-polar-vortex-3-dimensional-structure-north-hemisphere-december-analysis

The vertical pressure anomaly structure can directly reveal the connection between the stratospheric polar vortex and the lower levels.

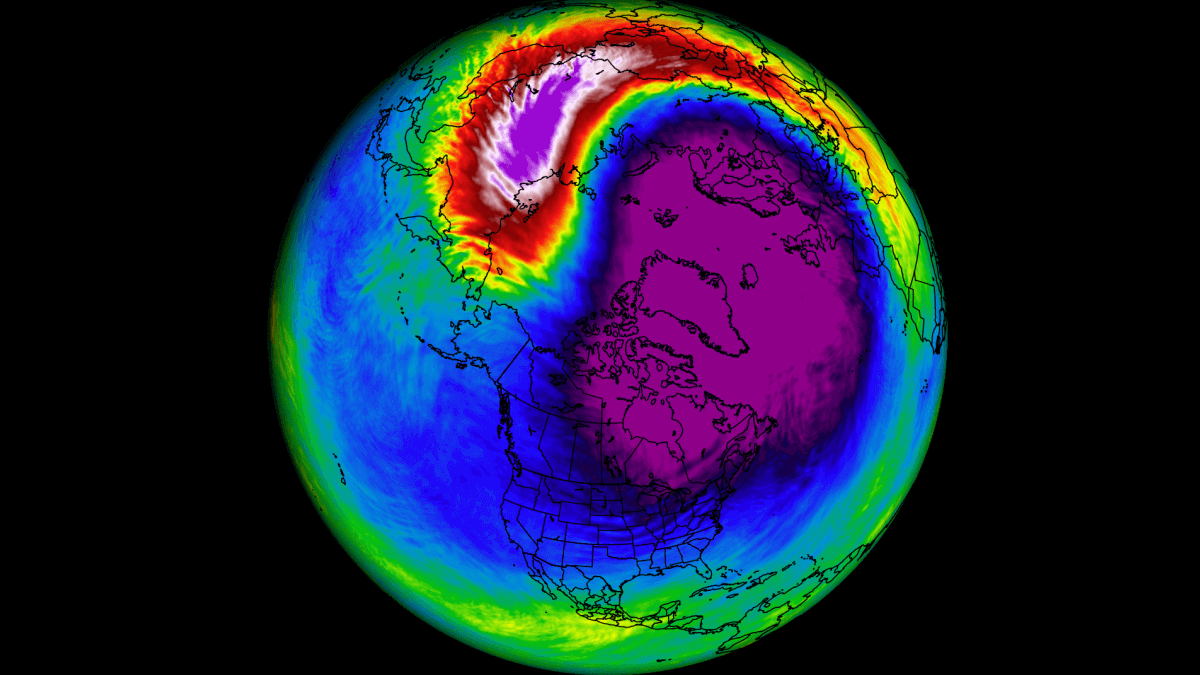
Below is the vertical pressure analysis from the ground up to the top of the stratosphere (45km/28 miles). You can see the strong negative anomalies over Greenland and the polar regions, connected all the way to the surface levels. The strong low-pressure anomaly above is the core of the polar vortex.

weather-forecast-north-hemisphere-united-states-cold-pressure-anomaly-atmosphere-vertical-profile-warming-event

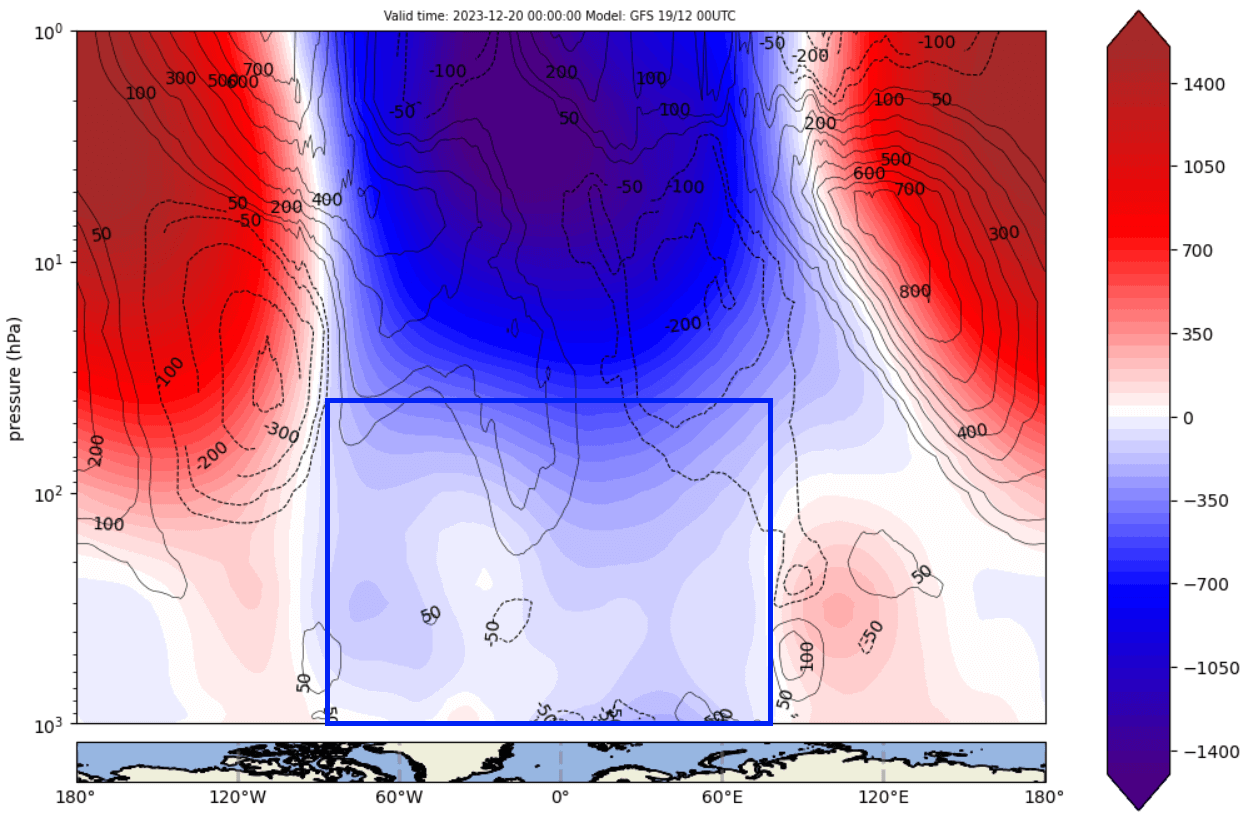
You can also see the high-pressure anomaly surrounding the polar vortex over the entire stratospheric level. This is what is pressing against the polar vortex, also affecting its structure and the weather at lower levels.

This can be seen in the weather pattern analysis below. It shows the pressure anomalies across the Northern Hemisphere. You can see the concentrated low-pressure area over the polar regions, which is acting like the “foot” of the stratospheric polar vortex.

weather-forecast-5-day-december-north-hemisphere-united-states-pressure-pattern-ecmwf-ensemble

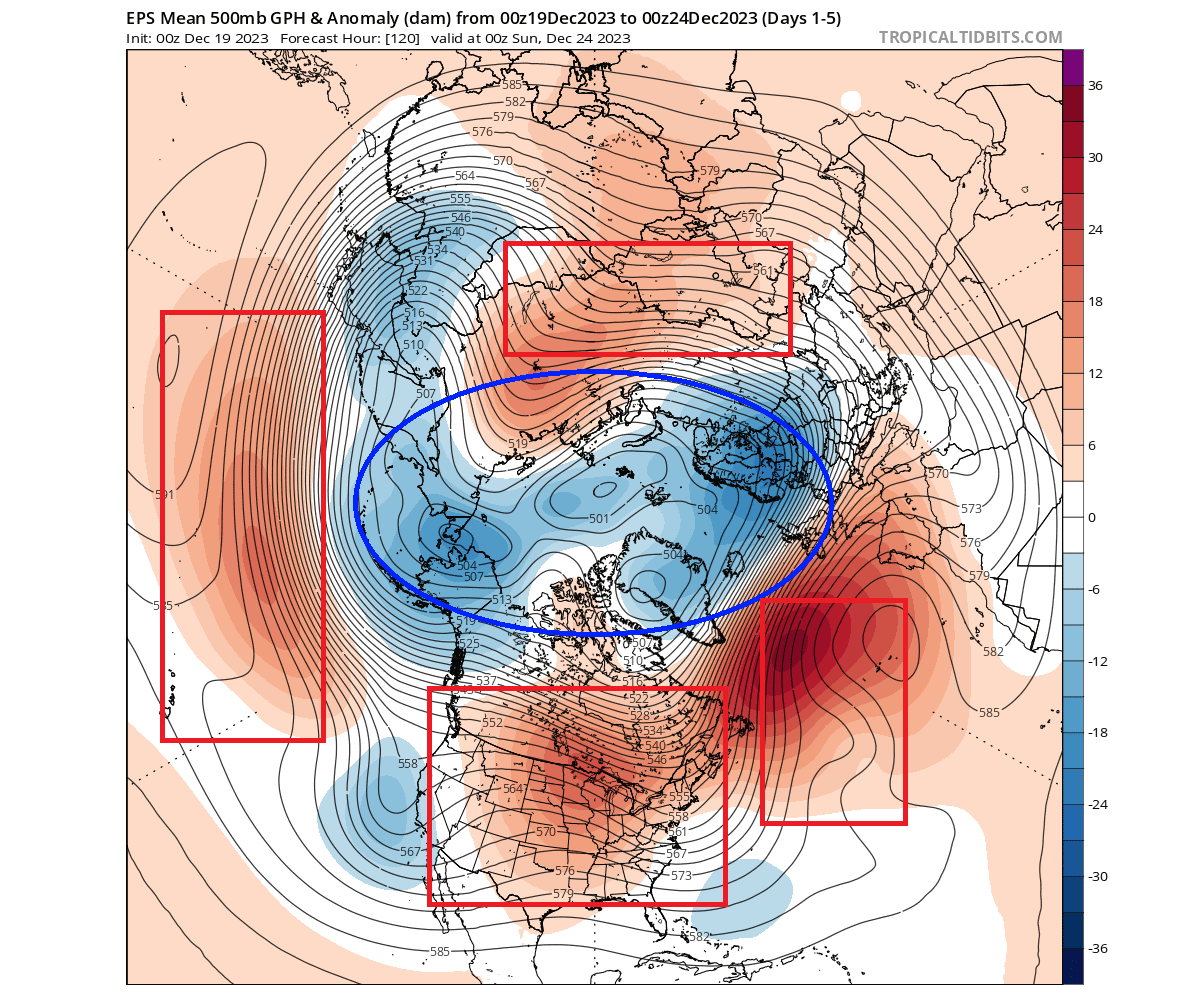
That, of course, affects the temperatures around the northern hemisphere. With a “locked-in” low pressure are over the poles, the colder air has a hard time to escape. That allows the unusually warm air to enter the mid-latitudes, creating warmer anomalies across the United States and Europe.

weather-forecast-5-day-december-north-hemisphere-united-states-temperature-pattern-ecmwf-ensemble

The reason we showed you this is to reveal the connection and importance of the stratospheric polar vortex and its link with the weather at the surface.

It is very important that we monitor the state of the Polar Vortex, as it can have a profound impact on our daily weather. We mainly separate the Polar Vortex into two different modes:

A strong/stable Polar Vortex usually means strong polar circulation and jet stream. This contains the colder air into the Arctic Circle, creating milder conditions for most of the United States.

In contrast, a weak/disrupted Polar Vortex creates a weak jet stream pattern. As a result, it has a harder time containing the cold air, which can now escape from the polar regions into the United States or Europe. Image by NOAA.

weather-forecast-north-hemisphere-what-is-polar-vortex-strong-weak-circulation-winter-pattern-jet-stream-anomaly-stratosphere-and-cold

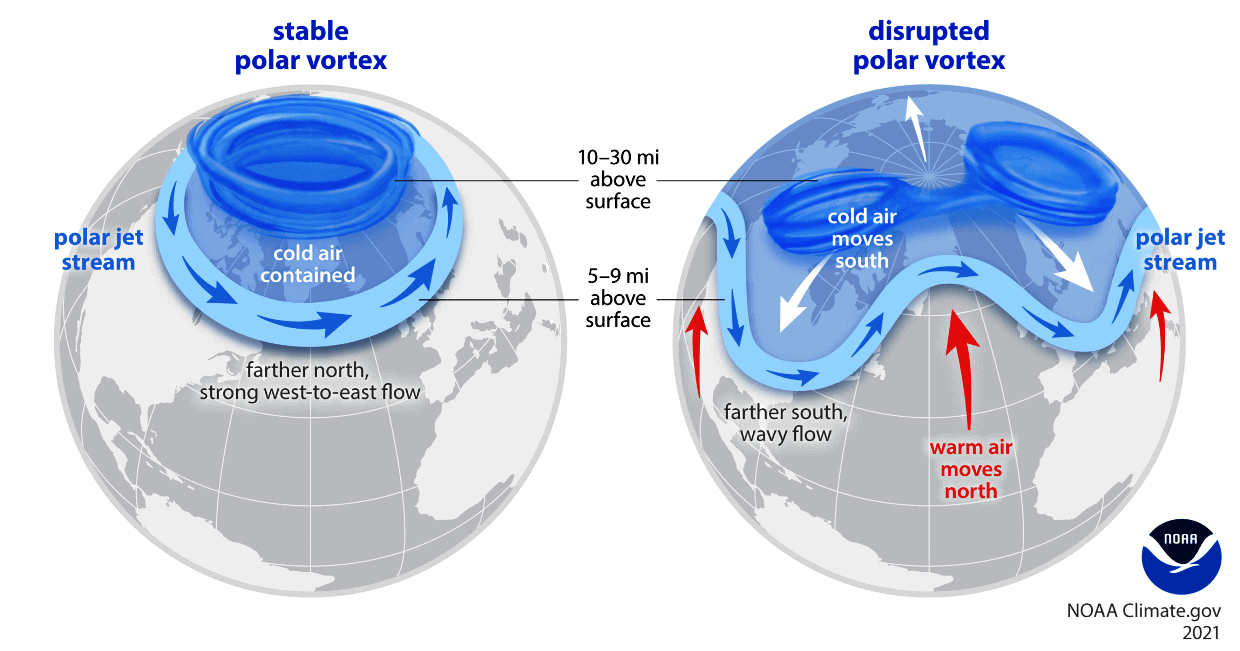
So, if you want cold and snow during Winter, and you live in the central or eastern United States, your odds are highest with a weak Polar Vortex. In nature, that means a heavy disruption of the jet stream and a release of cold air from the polar regions.

For this reason, we closely monitor the strength of the polar vortex and all the changes around it. This is even more important when there are sudden changes in the strength of the polar vortex, with potential warming events.
 

THE WINDS OF CHANGE

 
But how do we measure the strength of the stratospheric Polar Vortex? The simple answer is the winds. The more organized the stratospheric polar Vortex is, the stronger the winds inside it, which means it can have a stronger influence on the surface.

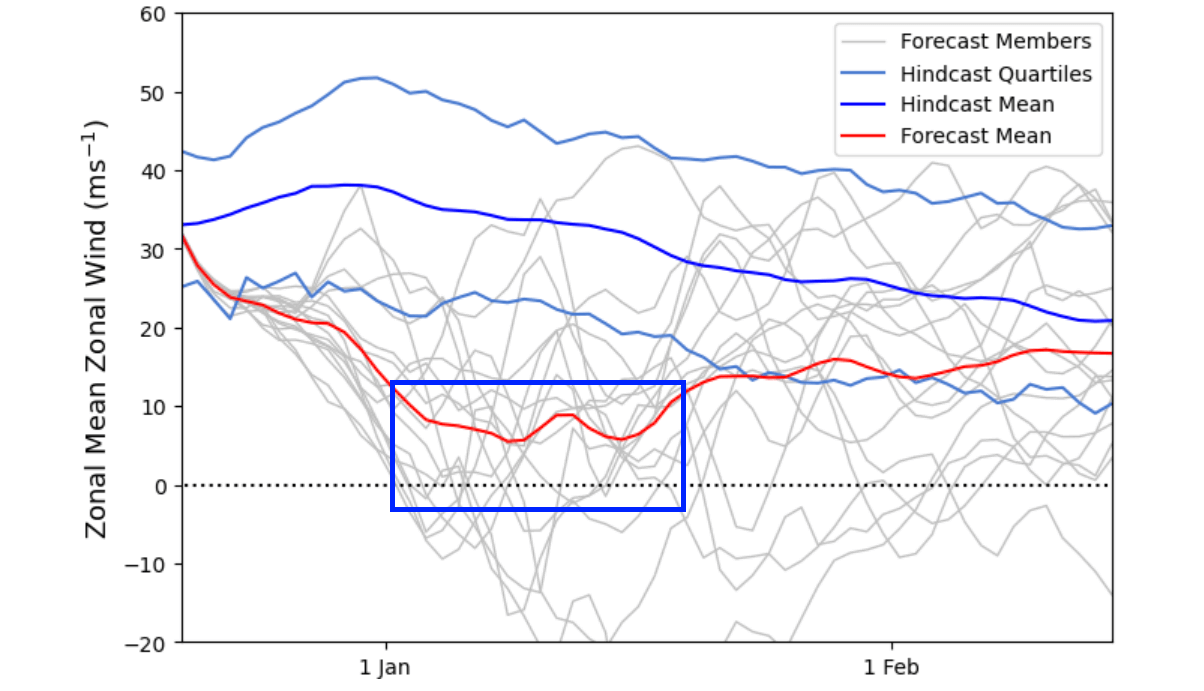
The image below shows the wind analysis and forecast for the next two weeks in the mid-stratosphere. You can see the current state of the polar vortex in the blue zone. It was fairly stable and average in strength. But notice the upcoming weakening in the coming days.

winter-polar-vortex-wind-speed-ensemble-extended-forecast-stratospheric-warming-event-2024

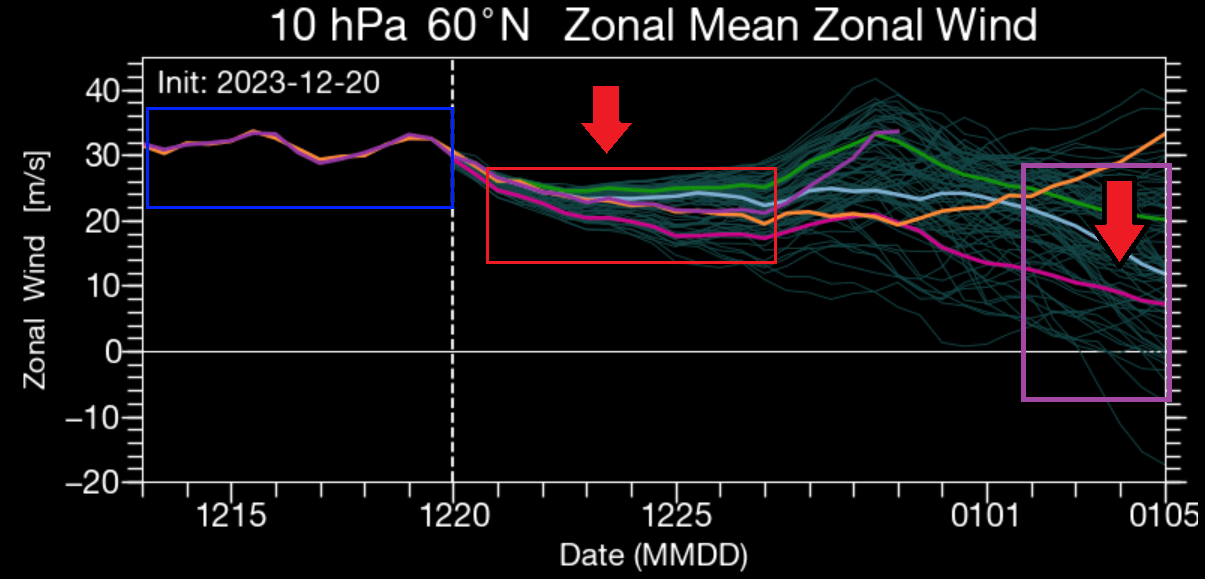
After that, there is a slight recovery, but going into 2024, an even stronger weakening is forecast, that might lead to something bigger. When the zonal (westerly) westerly winds in the stratosphere reach zero or negative values, it means a circulation reverse.

This signals a disruption or even a breakdown of the stratospheric polar vortex, known as the Sudden Stratospheric Warming event. These effects usually transfer down to the lower levels, with some delay, heavily altering the weather patterns.

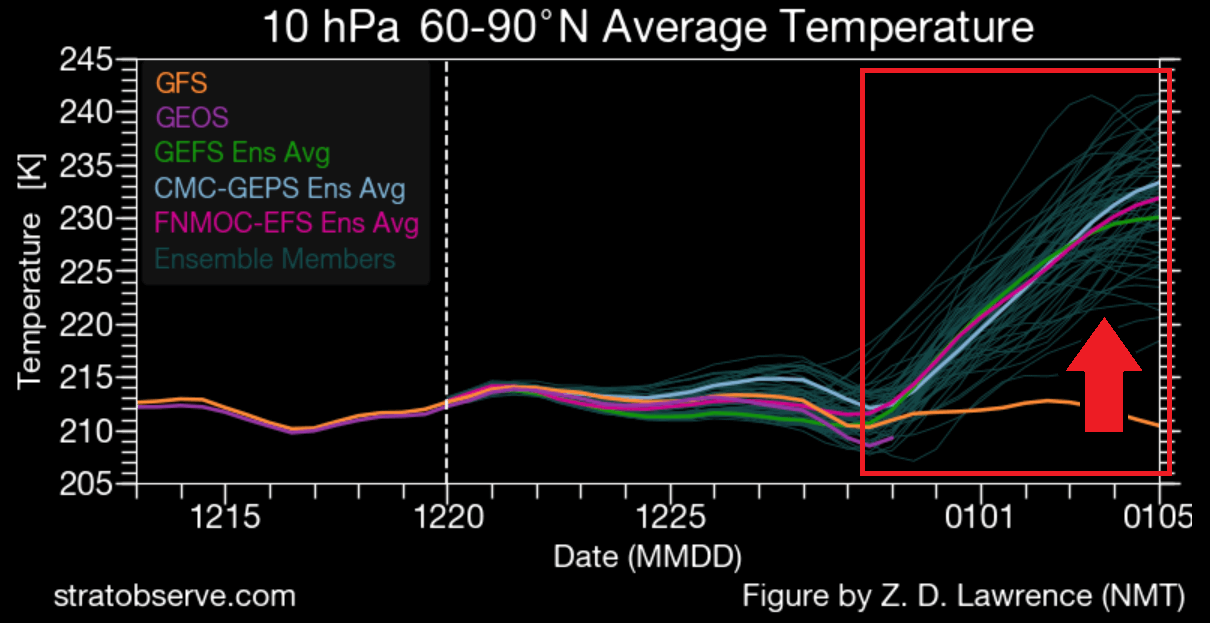
The temperature forecast for the stratosphere shows a strong rise in temperatures going into 2024. Combined with a reduction in westerly wind speeds, it indicates a major slowdown of the polar vortex, combined with a warming event.

winter-polar-vortex-temperature-ensemble-extended-forecast-stratospheric-warming-event-2024

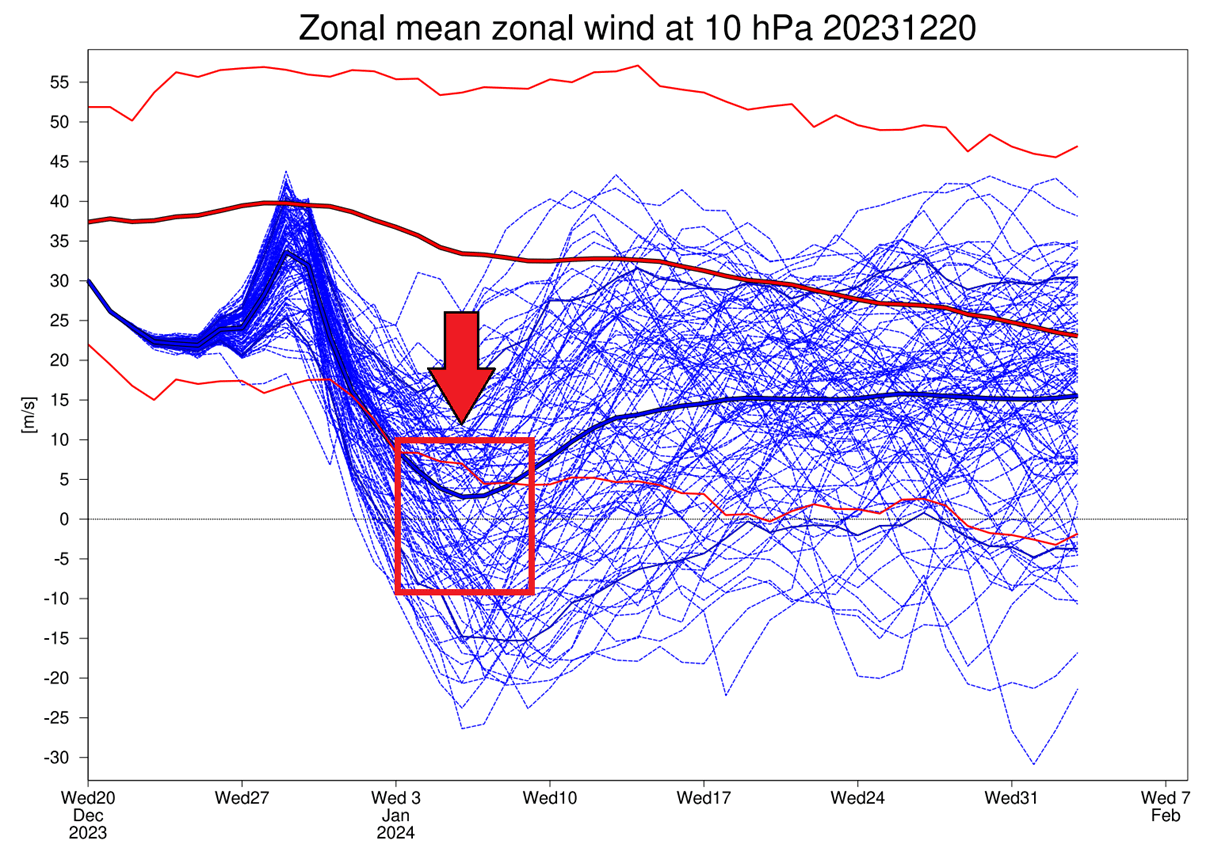
Another model that we often look at is the ECMWF, and it also has an extended forecast. You can see it in the image below, and it shows a very strong polar vortex slowdown in early January. The average line is close to zero, indicating a strong tendency of a full polar vortex collapse event.

winter-polar-vortex-wind-speed-ecmwf-ensemble-extended-forecast-stratospheric-warming-event-2024

If we look at the polar vortex forecast in the early days of January, we can see a very strong high-pressure area in the stratosphere, sometimes called the “anti-vortex”. You can see a very strong warming wave occurring where they come together.

winter-polar-vortex-north-hemisphere-forecast-temperature-pressure-10mb-stratospheric-warming-event-begins-january-2024

That is the start of a substantial stratospheric warming event and an important weakening for this time of year. But how does such an abrupt weakening of the Polar Vortex even happen? We will look more closely at this event and how it can change our daily weather.

The ECMWF model shows the same pattern for the first week of January. You can see it in the image below. A strong stratospheric high-pressure area and a substantial warming wave anomaly.

stratospheric-polar-vortex-north-hemisphere-forecast-early-january-winter-temperature-pressure-ecmwf

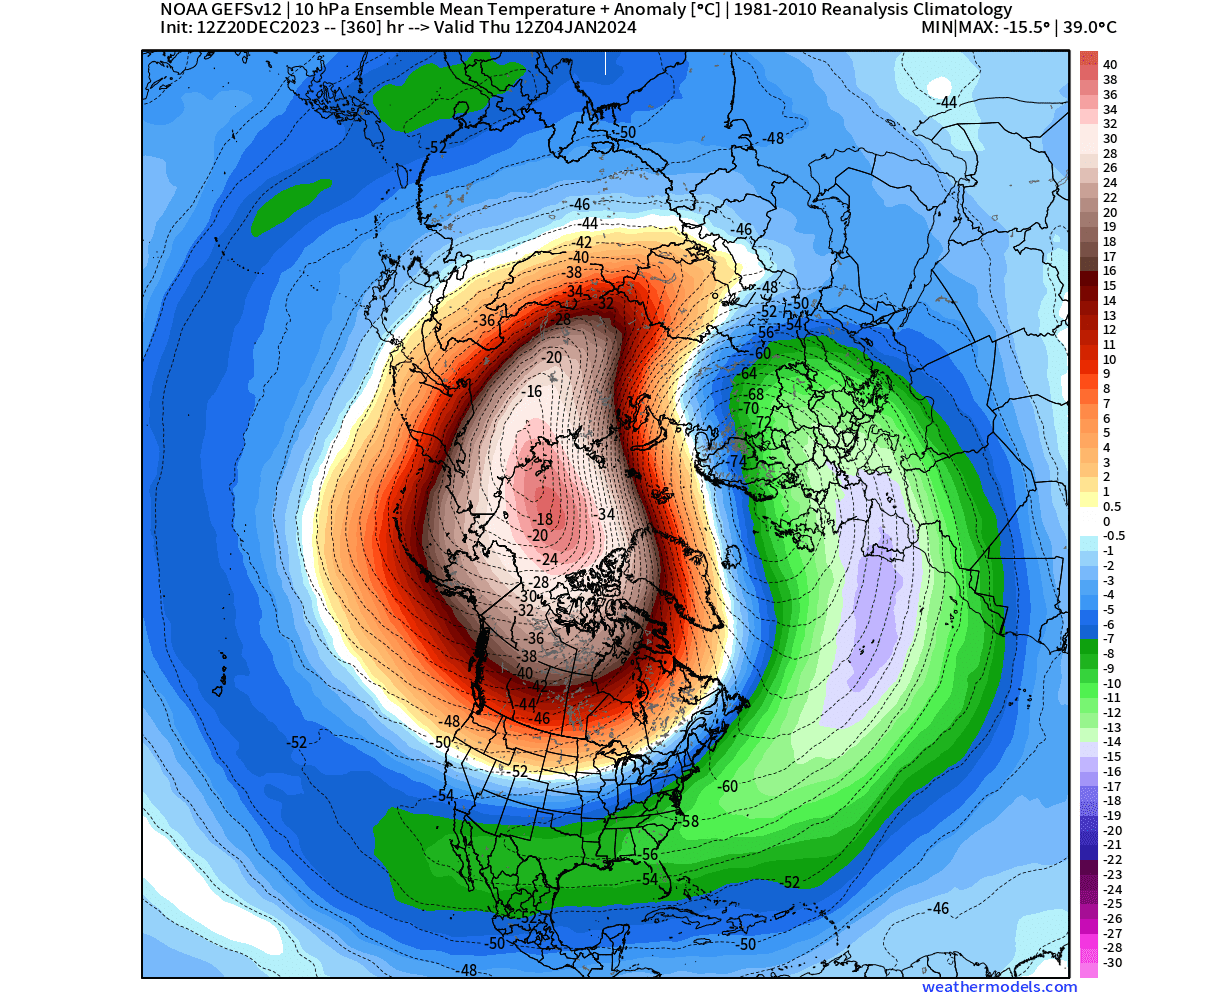
The GEFS model from the United States NCEP center also shows a substantial warming wave developing. In the image below, you can see the stratospheric temperature anomalies for early January. Inside the warming wave, you can find temperatures 40 (72F) degrees Celsius higher than normal for this time of year.

stratospheric-polar-vortex-north-hemisphere-forecast-early-january-winter-temperature-pressure-gefs

To add another model into the mix, we have the UKMO extended forecast. It shows the stratospheric wind speed forecast. It also shows a significant weakening of the polar vortex in early January.

winter-polar-vortex-wind-speed-ukmo-ensemble-extended-forecast-stratospheric-warming-event-2024

So, to recap, we have major signs from different forecasting systems that a major shift in the stratosphere is coming for the polar vortex. Based on what we know, a weak polar vortex has the power to substantially change the weather patterns across the United States and the rest of the Northern Hemisphere.

The stratospheric warming event is still many days away, and a full wind reversal is not yet confirmed at the moment. But we will still look at what we usually expect from stratospheric warming events and what the latest forecasts show for early 2024.
 

MID-WINTER POLAR VORTEX COLLAPSE EVENT

 
Sudden Stratospheric Warming basically means a strong temperature and pressure rise in the Stratosphere. That causes a major disturbance in the circulation and, as a result, starts a collapse of the Polar Vortex.

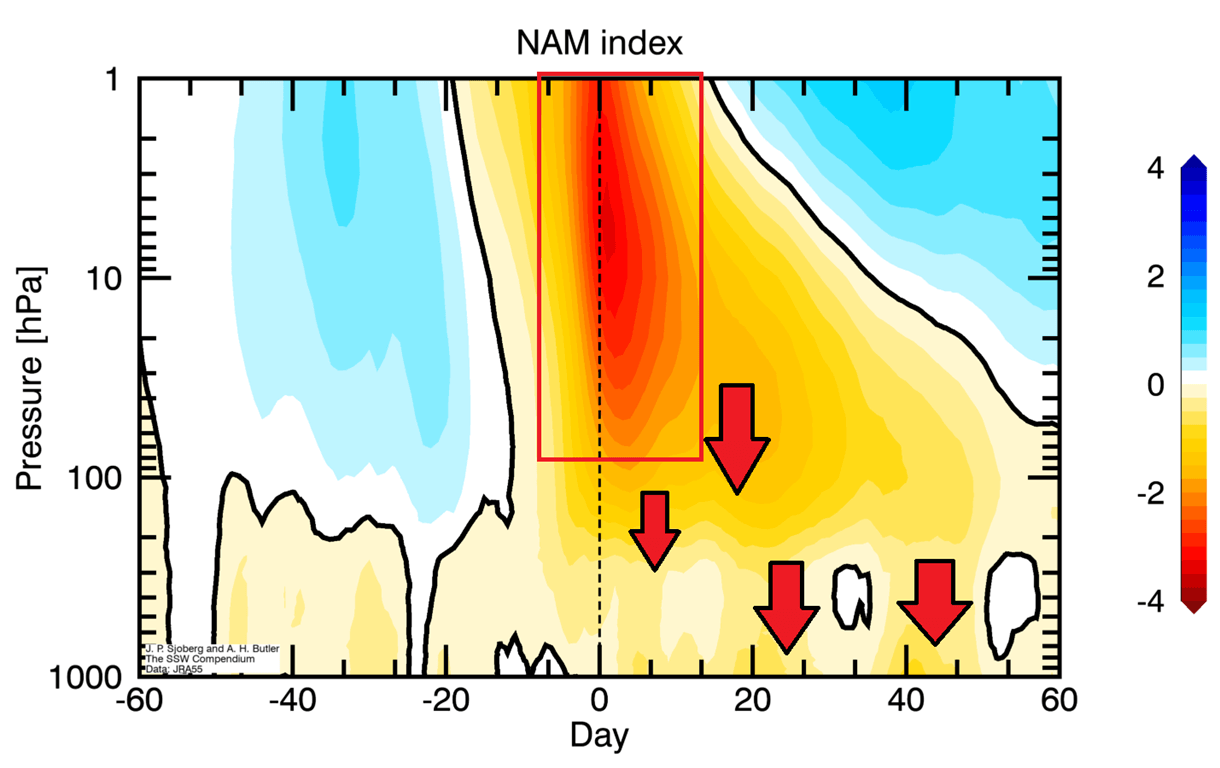
Below, we have a typical vertical progression during a stratospheric warming event. You can see the main event in the stratosphere slowly affecting the surface layers below over a certain time period. In nature, it usually works in the way of the high-pressure anomalies coming down from the stratosphere to the surface.

stratospheric-warming-event-atmosphere-vertical-pressure-anomaly-change-united-states-canada-pattern

You can see the pressure patterns 0-30 days after a stratospheric warming in the image below. This is an average image of several different events, but it gives an idea of what we can usually expect. You can see the high-pressure area over the polar region.

polar-vortex-weather-pressure-weather-impact-united-states-stratospheric-warming-2024

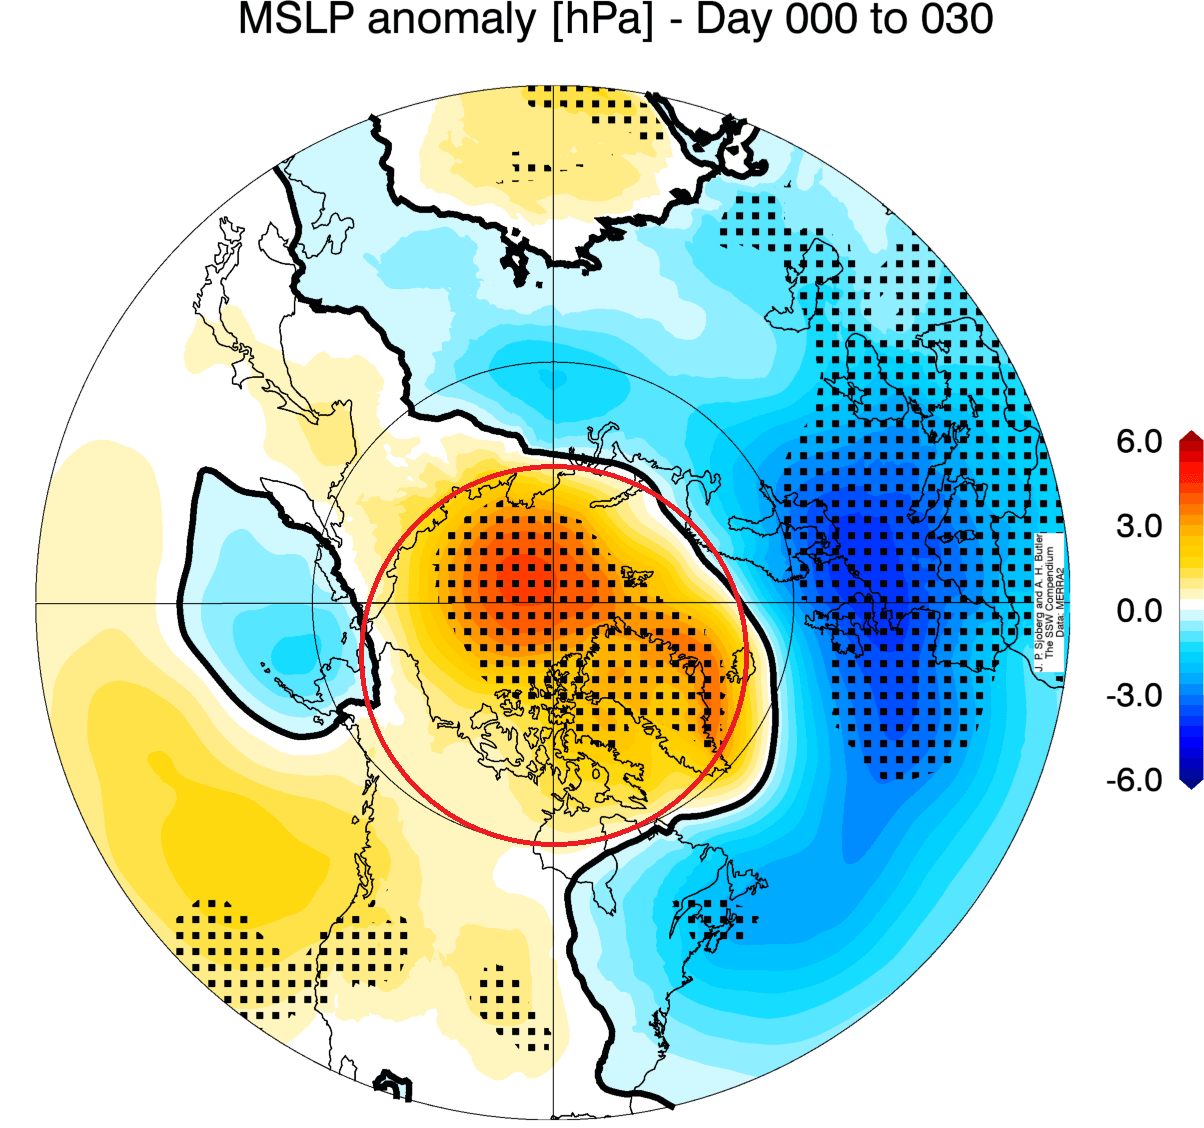
That means a weakened jet stream and low-pressure systems from the eastern United States across the North Atlantic and Europe. This helps to unlock the cold air from the Arctic, sending it towards the United States, as you can see in the image below.

stratospheric-warming-event-surface-weather-temperature-change-united-states-canada-pattern-anomaly-2024

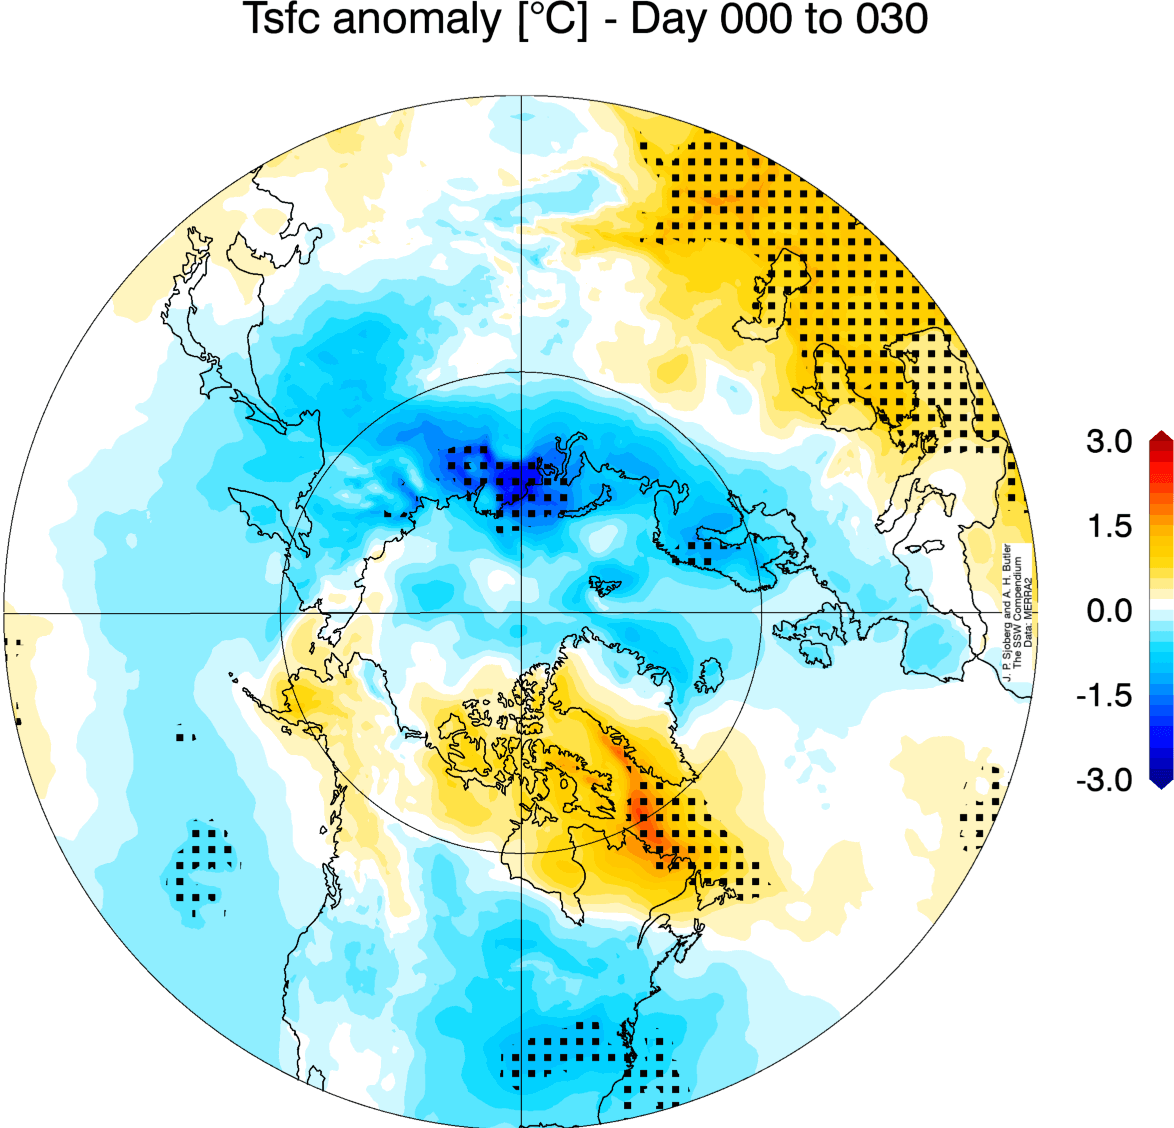
The images above show an average picture of many SSW events. Each stratospheric warming event is different and does not automatically mean a strong winter pattern.

So, what is currently shown in the weather pattern forecast for January?
 

NEW YEAR BRINGS WINTER WEATHER

 
We wrote two articles on the subject of weather pattern change in January. The latest article will be linked below. But if we make a quick summary, there were already early signs that a significant winter pattern change is in the works for January.

The stratospheric warming event is one of the strong candidates (with El NiƱo) to help push the weather pattern into a more wintery mode.

Below is the surface pressure anomaly in the first half of January, by one of the extended forecasts. You can see an oddly strong resemblance to the surface pressure pattern we just showed above, following stratospheric warmings.

winter-forecast-january-surface-pressure-anomaly-pattern-gefs-united-states-canada-extended-early

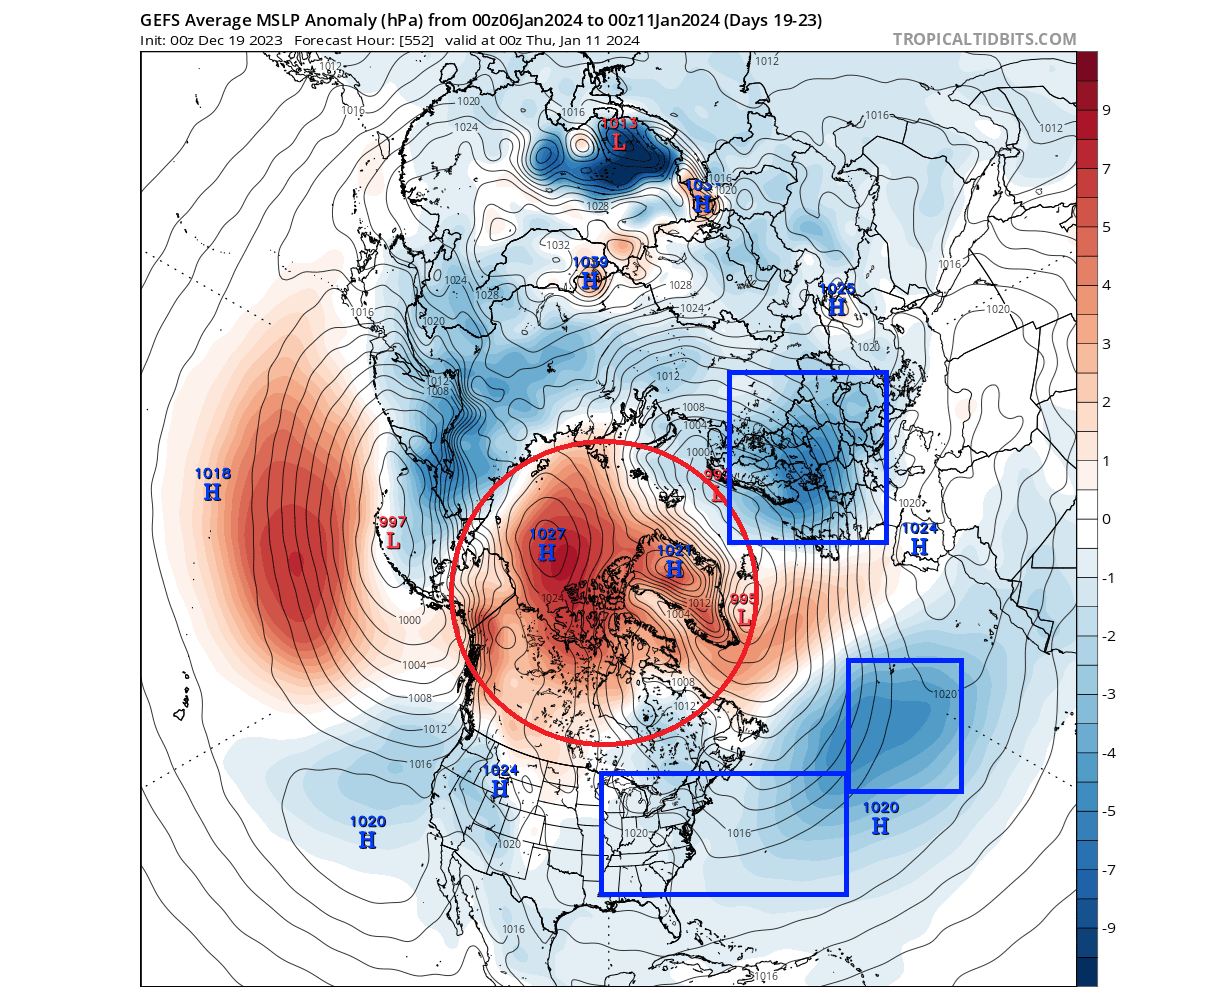
You can see the high-pressure over the pole and low-pressure areas over the United States, North Atlantic, and northern Europe. This is not necessarily a direct result of the stratospheric dynamics, but the whole system is connected and reflects changes from above to below and vice-versa.

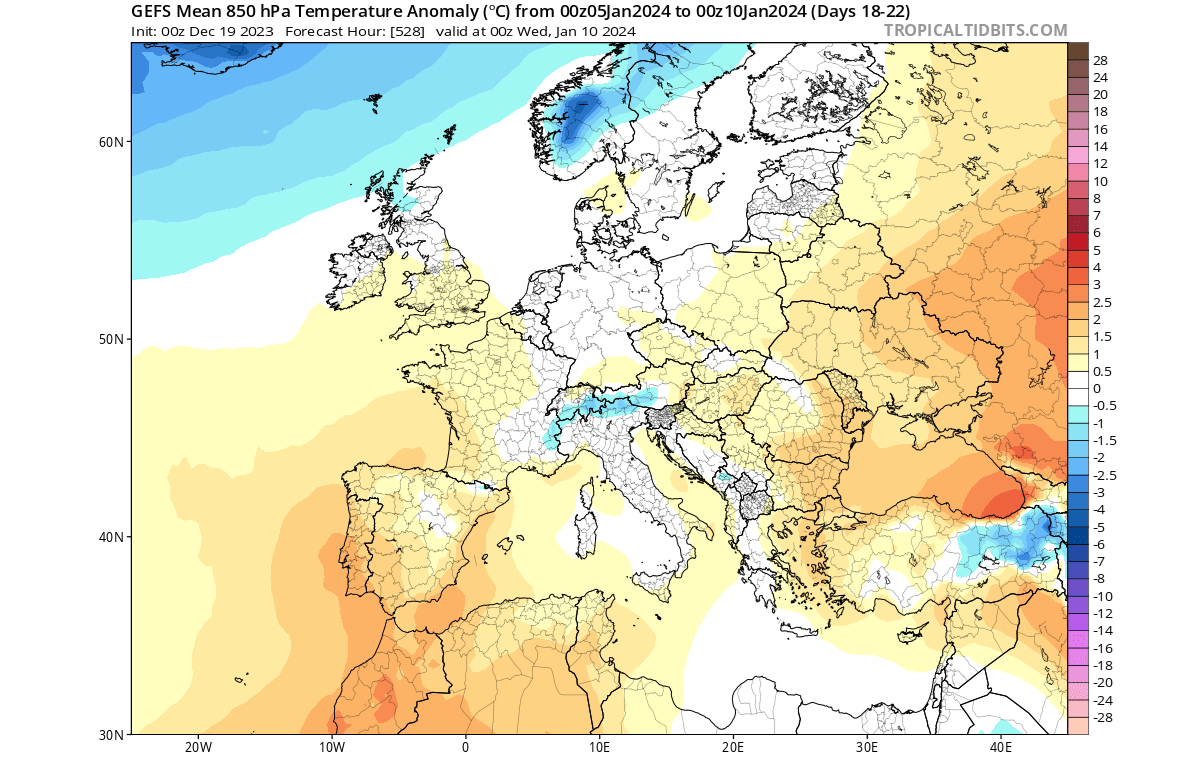
The temperature pattern for this same period shows a colder anomaly over the United States, with a focus on the eastern United States. Such a temperature pattern would be expected after strong stratospheric dynamics.

winter-forecast-january-surface-temperature-anomaly-pattern-gefs-united-states-canada-cold

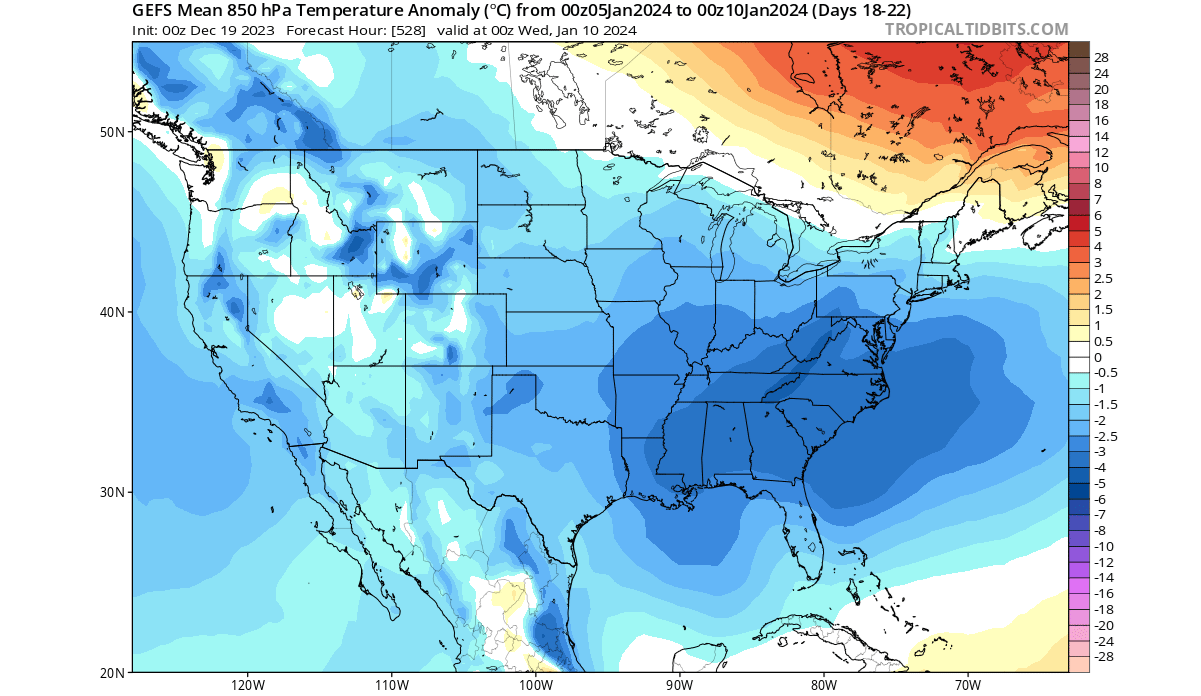
Over Europe, we do not see a major cold anomaly, but there is also no strong warm anomaly being forecast. With a high-pressure anomaly over the northern parts, a northerly flow can be expected at least towards mid-month if not sooner.

winter-forecast-january-surface-temperature-anomaly-pattern-gefs-europe

We also have to look at the ECMWF extended forecast, as it also shows strong stratospheric dynamics. Below is the pressure anomaly forecast for the second week of January, and you can nicely see the high-pressure area over the polar regions and low-pressure anomalies across the United States and Europe.

winter-forecast-january-500mb-pressure-anomaly-pattern-ecmwf-united-states-canada-extended-early

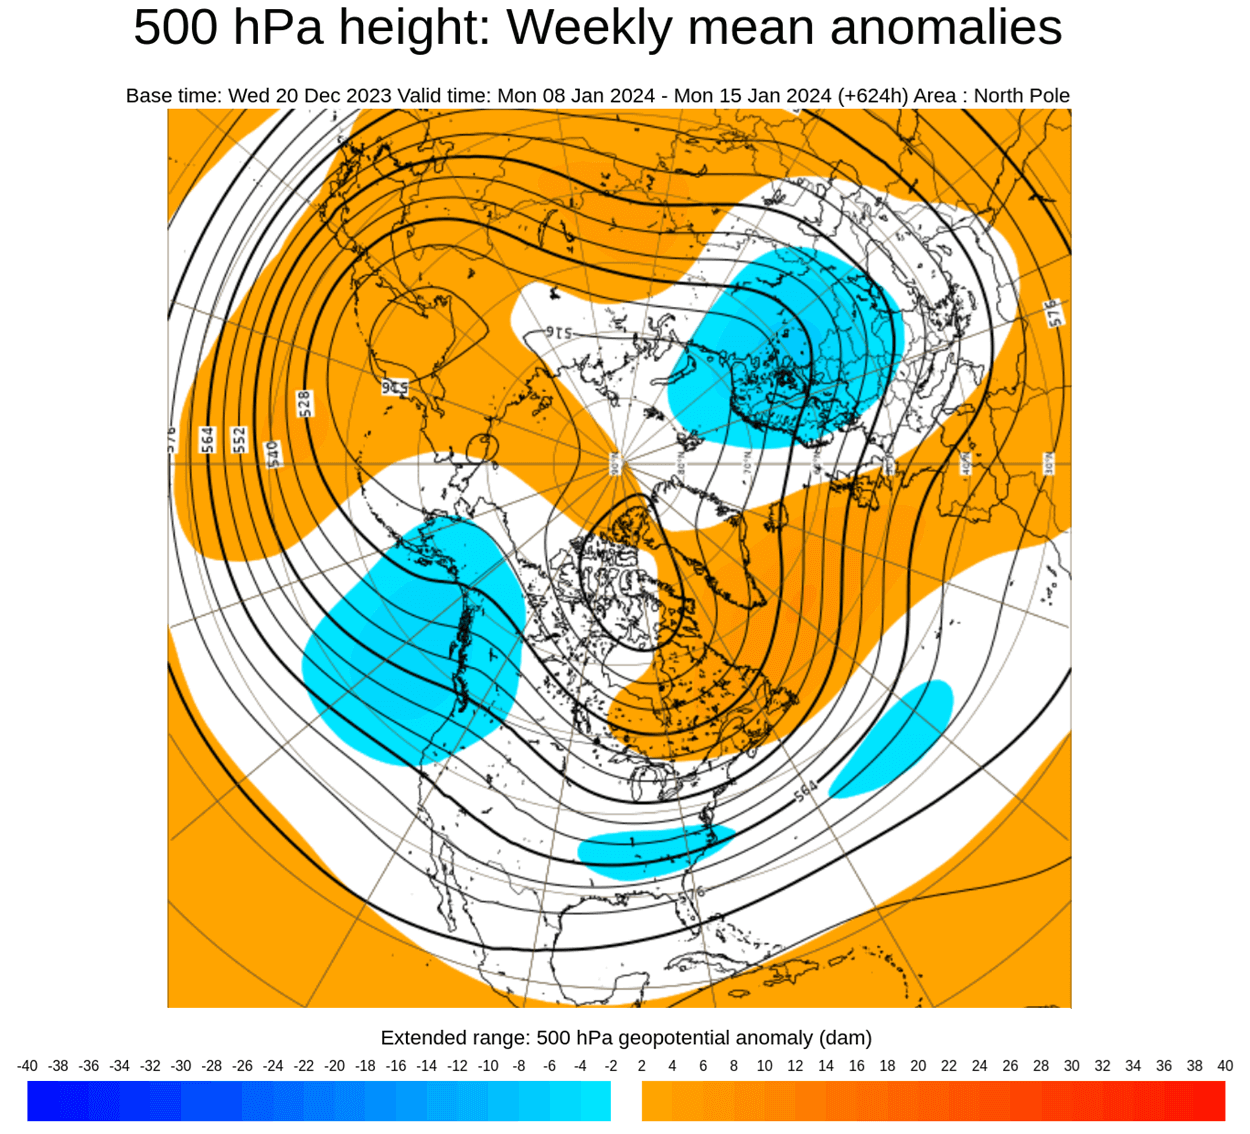
This indicates a weak vortex event and is consistent with the forecast of a strong warming event occurring in the stratosphere.

The surface temperature for the second week of January shows cold anomalies over the United States, with the exception of the upper Midwest. It is too early to talk specifically, but such a pattern would be supportive of some good winter weather across the eastern United States.

winter-forecast-january-surface-temperature-anomaly-pattern-ecmwf-united-states-canada-cold

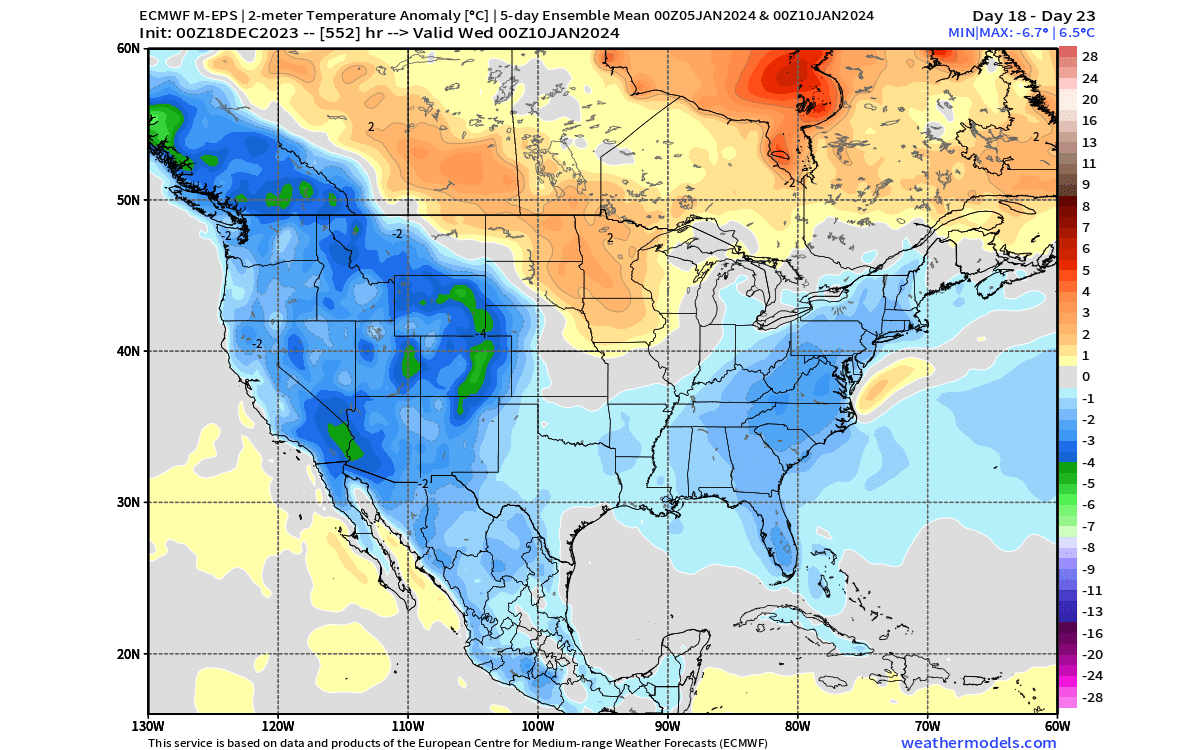
It is too early to talk specifics, as this is the extended forecasting range, so we are only looking at trends. But with everything considered, January is shaping up to show a completely different weather face compared to the much warmer December.

We will keep you updated on the global weather pattern development, so bookmark our page. Also, if you have seen this article in the Google App (Discover) feed, click the like button (♥) there to see more of our forecasts and our latest articles on weather and nature in general.

January weather pattern change:

A long-lasting Winter shift in January and February is now seen across the eastern United States in the latest long-range forecast data

12/21/23

 The Whitest of Christmases and Other Christmases Past and Chances for a White Christmas - 2023

Frequently during the Christmas Season, meteorologists are asked; Are we going to have white Christmas?  Generally, it is agreed among meteorologists that in order to "officially" have a white Christmas, an average of an inch of snow must cover the ground Christmas morning /7AM/, but not necessarily have to fall on Christmas. 

At this time /Thursday/ December 21st 2023; chances of a white Christmas across all of Southeast Lower Michigan pretty well; Zilch. Nada. No way Jose'.  In fact; this El Nino Christmas will live up to its reputation with mild weather with the risk of some light rain later in the day or night. Temperatures are expected to approach and flirt with 50 degrees Christmas Eve and slide up into the lower to mid 50s Christmas. While very mild it's still no where near the record high for Christmas of 64 back in the Super El Nino of 1982. It's interesting and ironic to note that exactly one year later; the coldest temperature temperature on Christmas occurred in 1983 with -10 with brutal wind chills to boot (see in the below discussion)!

Last Christmas 2022; a cold blast accompanied by several inches of snow fell a few days before and on Christmas across Southeast Lower Michigan making for a white Christmas but with brutally cold wind chills well below zero.
  
On Christmas /2021/ we ended up with no white Christmas. Christmas 2020; we lucked out with generally an inch or two of snow falling over the region on Christmas Eve into Christmas morning. A nice picture-perfect light snow cover.
 
Christmas /2019/ no white Christmas was to be had - and also back in 2018; around Metro Detroit there was no white Christmas. In fact; temperatures pushed up into the 40s and 50s in the few days following Christmas. Further north from the Flint area into the Saginaw Valley and Thumb Region however; a inch or two remained on the ground for a white Christmas across that region.

Over the years, extreme Southeast Lower Michigan has averaged just under a 50 percent chance for a white Christmas.  Some years it's already on the ground, some years not, some years it melts while other years it falls on the day. However, theoretically, you could actually have nothing on the ground Christmas morning and have a snowstorm dump a foot on the region during the day and still have NO official white Christmas under the standing morning rule. It works the other way too; you could have a several inches on the ground at 7am 12/25 but warmer air and/or rain melts it away by afternoon or evening and still officially have a white Christmas.

Four years ago /2017/; an unexpected white Christmas was had in spades as low pressure system overachieved; developing robustly over the southern Great Lake/northern Ohio Valley. The system developed into a notable little snowstorm falling mainly on Christmas Eve over the southeast area as seen in this map, bringing snow for a picturesque, classic Christmas scene. The only negative - and a notable one - was the lousy driving conditions Christmas Eve into early Christmas Day but with improving conditions later for Christmas dinnertime.


For more on the system from the NWS; see here.

In 2016; even with mild weather with temperatures in the 30s; Southeast Lower Michigan was able to hold on to a white Christmas as the snow (generally 2-5") slowly melted. In fact; the day after Christmas, warm air surged into the region and pushed temperatures into mainly the 50s and took care of any remaining snow! Back in December /2015/; it was a mild and snowless Christmas with a high temperatures near 50. Of course, the year before, /2014/ contained our record breaking warm El Nino December, therefore the hopes for a white Christmas were low anyway. Back on Christmas 2014, the chances for a white Christmas were very similar to 2015 with record setting low amounts of snow for the month (in the top 5 snowless). Officially on 12/25/14 at 7am; no snow was on the ground with a trace of light rain on the date. Only a TRACE of snow had fallen up to that day in December /0.1 for the entire month/.  Most areas over the remainder of Southeast Lower Michigan had a few tenths of snow Christmas eve or Christmas but with less than the amount needed and mild temperatures rising into the upper 30s to around 40...none of the area saw a white Christmas.

More Previous Christmases back to 2004:

In 2013;  even with all the snowfall throughout last winter, officially on 12/25/13 at 7am Detroit Metro Airport had only a TRACE of snow on the ground. Most areas into the remainder of Southeast Lower Michigan had some residual snow and ice on the ground for a white Christmas. Back in 2012, enough snow did fall at Detroit Metro Arpt (an inch of fresh snow Christmas Eve) to make it an official white Christmas was on the ground as of 7AM. The necessary inch or more was also on the ground at both Flint and Saginaw. Ironically the day after Christmas, the best snowstorm of the winter season hit the region...a day late and several inches short for Christmas. A year earlier in 2011, it was a relatively mild Christmas with temperatures in the 40s and no snow on the ground; so no white Christmas. However back in 2010; residents across Southeast Lower Michigan did enjoy a white Christmas with generally 1” to 6” of snow across as temperatures hovered in the 20s. Then further back in 2009, much of the Detroit area south did not have a white Christmas but points north across Flint, Saginaw and the thumb region generally had a 1” to 3” snow cover. Back in 2008, we saw a “sloppy, melting white” Christmas. That white Christmas involved the melting of a heavy snow cover from past snows that accumulated throughout December. The best of the snowstorms came before Christmas on the 19th (with another, lesser intense snow falling on the doorstep of Christmas, 23rd -24th). After, however, the heavy snow cover melted in earnest as milder air overspread the region Christmas Eve right through the 26th. Christmas of 2007, saw temperatures rise into the mid 40s to mid 50s a couple of days prior to Christmas and that, combined with light rain, pretty much took care of any hopes for a white Christmas as then, like the later Christmas of 2008, the  previous heavy snow cover melted (but this time in its entirety before Christmas). Some scattered light snow did return, skirting the landscape on Christmas Eve but most areas around Southeast Lower Michigan still only had a trace of snow for Christmas. At White Lake and Saginaw, however, the official inch of snow to make it a white Christmas was barely attained in 2007.

Going back further to the Christmas of 2006; it was also mild and therefore, there was no white Christmas. In 2005, we just barely squeaked out a white Christmas (at Detroit Metro Airport, anyway) as a mild spell moved in just before Christmas along with rain, melting the snow down from 4” to 1” by Christmas morning. Originally, there had been 8” of snow on the ground on the 15th. The last really scenic (no slop)  with fresh white snow for Christmas occurred in 2004. A snowstorm brought heavy snow (ranging from 8”at Detroit to around 4” in Saginaw and Flint) on the 23rd, which left the region with a nice white cover for Christmas. It was also a cold Christmas also with highs only in the teens and overnight lows below zero. 


Looking over historical weather records of Christmases past since 1900, a wide range of weather conditions were found. While most people would like to believe that Christmas in the Detroit area should be snowy-white and picturesque, more often than not, they're not. Over the past 123 (including 1900) Christmases in Detroit, 58 (or 47%) have been what would be called "white" with an inch or better of snow on the ground. Keep in mind however, these records are for Detroit; farther north in Flint, the chance of a white Christmas jumps to 56 percent, while in Saginaw and the Thumb region it rises to 61 percent. However; the past 30 year normals /1991-2020/ the shorter time-frame indicates the chance of a white Christmas at Detroit has dropped to just 35%; whereas around Flint the past 30 year norm puts it at basically a 50/50 chance (or exactly 51%). In the Saginaw region; the probability of a white Christmas has dropped to 46%.

Way back on the Christmas of 2000 was very white indeed, but as to how much of a white Christmas (snow depths) is where the confusion came in. Let me elaborate, officially at Detroit Metro Airport, just six inches of snow was recorded on the ground at 7AM Christmas Day. However, just about anywhere west/north and in the city of Detroit itself, amounts were considerably higher with generally 8 to at least 15 inches. At the National Weather Service in White Lake, 15 inches was observed on the ground Christmas 2000 morning. No additional snow fell on Christmas Day (nor was anymore really wanted with the surplus already at hand). In any event, for Detroit and surrounding communities, the six inches at Detroit Metro Airport is the official snow depth used for the area.

The snowiest Christmas (most snow falling on Christmas), occurred in 1915 when 6.4 inches fell with a snow depth of seven inches on the ground. The timing of this snowfall was impeccable for Christmas with it actually starting Christmas Eve around sunset. Then, it continued to snow through the night into Christmas day. Actually, even more than the 6.4 inches fell from the entire storm with an additional 1.6 inches falling on Christmas Eve. This gave a snowstorm total of eight inches.  A little light rain did mix with the snow during the forenoon hours of Christmas but with a high temperature of only 33, it did little to mar the "Christmas card" scene. Speaking of "Christmas card" scenes, another heavy wet snowfall blanketed the area just after the turn of the century early on Christmas in 1901. The scene is described in the historical weather books as follows:

    "Night of the 24 - 25 cloudy; moist snow continued,
     heaviest between hours of 1:30 and 4:30 am, ended
     at 6 am. amount of precipitation .62 inches. The
     street cars ran all night to keep the tracks open.
     the snow adhered to trees etc, and made a very
     beautiful scene. Depth of snow on ground at 8 am,
     5.5 inches".

 This "Norman Rockwell Christmas scene" was further enhanced by a heavy coating of frost deposited on the buildings and windows Christmas Eve due to the moisture-laden air. But just like memories of some Christmases past, this majestic Christmas scene quickly faded (melted) during the day as temperatures climbed to 41 degrees, leaving just slush , slop and water. During the Christmases of 2002 and 2003, the weather was similar to both of the white Christmases mentioned above /1901 & 1915/. Here again in 2003, snow started falling Christmas Eve and lasted into at least part of, if not all of Christmas Day. On Christmas Day 2003, snowfalls ranged from at least an inch in the far southeast corner of Lower Michigan to as much as six inches across Detroit's northern suburbs, extending northward across Flint and Saginaw. On Christmas Day of 2002, total snowfall at Detroit Metro Airport was measured at 6.4” inches for both days (Christmas Eve and Christmas) with 3.4” of it falling on Christmas Day, itself. Across all of Southeast Lower Michigan snowfalls generally ranged from four to seven inches. A picture perfect Christmas was created both years with the freshly fallen snow. Like the Christmas snowstorms of 1901 and 1915, the snow Christmas 2002 was also somewhat heavy and wet with high temperatures in the lower 30s and lows only in the mid 20s.

Probably one of the slushiest and sloppiest Christmas Days happened in 1973. What started out as a white Christmas with a heavy 7 inch snow cover, quickly melted to a meager 2” slush mess by nightfall. To add insult to injury, it rained nearly a half an inch during the day.The wettest Christmas on record occurred in 1945 when 1.16 inches of rain fell. The rain actually began Christmas Eve as a light freezing rain and continued freezing until nearly dawn on Christmas, when the temperature pushed above freezing. Until the ice melted, a few tenths of an inch of ice coated everything by Christmas dawn. Needless to say, walking and driving early the Christmas of 1945 was treacherous but Santa was in and out of town in a flash!

Without a doubt, and still in the memories of long term inhabitants of Southeast Lower Michigan, is the warmest Christmas on record, the Christmas of 1982. It was as though the whole area was shipped to Florida for the holiday! The official record high at Detroit was 64 degrees, while Flint did one degree better at 65! These readings are about normal for Tallahassee, Florida! Scenes of shirt sleeved people with shorts running or riding bikes, instead of visions of sugar plums, made the Christmas of 1982 to some Michigan Christmas traditionalist, very hard to take.  This spring-like day was complete with scattered showers and, of all things, thunderstorms! Ironically, the bitterest cold Christmas came just a year later in 1983! Maybe a payback from Mother Nature for the warm weather we were treated to, the Christmas past? The temperature plummeted Christmas eve to a record low of -9 at Detroit and was accompanied by a stiff west wind averaging 25 to 30 mph, creating life threatening wind chills at times of near 40 below zero! Santa certainly brought the North Pole with him the Christmas of 1983, when he made his rounds very early that morning. In addition to the record low Christmas eve, another record low /-10/ was established during the very early morning hours of Christmas.

These Christmases past discussed are more the extreme than the norm across extreme Southeast Lower Michigan. But they do show the variable weather that can occur at Christmas (or any other time for that matter). The "normal" (or average) highs in extreme Southeast Lower Michigan Christmas Day are in the lower 30s, while lows average in the upper teens.

And now, I'd like to wish all who read this a very Merry Christmas and/or Holiday Season and the best in 2024!  I plan on continuing my blog for the new year if the fates allow and look forward in reaching out to more people (and hear their comments and ideas) across the globe.

Making weather fun while we all learn,
Bill Deedler - SEMI_WeatherHistorian


11/18/23

Winter 2023-24 Outlook for Southeast Lower Michigan ~ Modoki El Nino Winters Versus Typical El Nino's; Let Me Count the Ways (in the Analogues)

While there are generally many influences on our winter weather across the country and Southeast Lower Michigan; this winter has an infrequent addition - what "type" of El Nino will be a key player in our hemispheric circulation? That's right, while generally a strong to moderate El Nino is expected to prevail this winter; very little has been discussed on the type of El Nino expected to evolve. Therefore; the question also this winter should be - will we have a typical El Nino or a Modoki El Nino? A Modoki El Nino has been more on the radar (so to speak) of research climatologists and meteorologists for the past 20 - 25 years or basically this millennium.

Modoki is Japanese for “same but different,” and this is indeed the case. El Nino Modoki events are a rarer subset of regular El Nino’s, and are marked by warming water in the Pacific, but not evolving along the eastern section of the equator. Instead, the warming gradually evolves toward and becomes more focused in the mid-Pacific-equator area and the warming as a whole, is generally not as strong as a strong to "super" El Nino event. Sometimes in a moderate-strong Modoki (as in this El Nino), water actually begins to cool to normal to below normal off the coast of Peru, which is the opposite of a normal El Nino event (and what you see in a typical La Nina event).

Several studies have shown that the ENSO Modoki has become more prominent in recent times (also evidenced by my analogues), as compared to a typical El Nino ENSO, which can result in changes in the teleconnection pattern arising from the tropical Pacific. This change in the peak location of the El Nino affects the downstream Pacific Jet. 
 

Summer into Autumn 

The most radical but not that all atypical change occurred in October with the sharp contrasts in temperature resulting in change of jet stream from the first half to the second. Again, this is an intermittent enough pattern (against the more gradual stair-step down temperature pattern). I've written about radical jet and temperature pattern changes in October. This can set the stage for a very volatile up and down temperature cycle into the winter reflecting a more volatile meridian pattern /sine-wave/. While this fall has reverted to the spring pattern seen with below normal precipitation thus far; due to a wetter summer - the annual precipitation has remained above normal.

Note: I will continue the changes made last year in my Outlook for my third decade of season outlook forecasting. They include an even more thorough analogue chart including previously mentioned patterns in the past such as: Autumnal patterns, Arctic Oscillations, Solar and QBO cycles along with Siberian/Eurasia October snow cover (available since 1998) during the previous analogue winters. This in turn is compared to the upcoming Winter of 2023 - 24 observed or projected patterns. Therefore, much of the information discussed is there for the reader to quickly scan on the chart. I still will provide a brief summary of each indicator but limit the amount of description, while still occasionally connecting the reader to the corresponding website. The overall, Winter Outlook format remains the same as presented in the past. Now on to the Outlook...

Winter Outlook for the Winter of 2023-24


Local Research and Hemispheric Data along with current modeling suggests:  

Temperatures - Normal to Above Normal

As with the majority of winters; look for temperatures during the 2023 - 24 winter to be quite changeable as opposing air masses vie for dominance under a fluctuating jet stream. The ongoing pattern recently experienced this fall is also telegraphed well in the Winter Analogues for 2023 - 24. 

Various computer guidance for the upcoming winter is also having some difficulty with what type of El Nino will occur (see model section). While analogues and some models suggest a typical El Nino pattern, my research also confirms this with somewhat colder temperatures than what is typical in a moderate to strong El Nino. I believe during this winter; the Pacific jet will be fighting against a sometimes aggressive colder northern Polar/Arctic Jet coming in from Canada. This winter's analogues are suggesting a "normal to above normal" winter on the whole but with the strength of the present El Nino (Modoki or not); the variances of above normal to below also work together for a normal winter. With nearly equal amounts of above, below and normal winter results in analogues - the conflicting contrasts are striking! This also takes into account the majority of the colder winters are earlier in the sample and milder climate patterns are also at hand.

In the final analysis; Statistically, I look for Southeast Lower Michigan winter temperatures to average +0.0 to 3.0 degrees above normal depending on the resultant, dominant pattern that evolves. Note: Normal temperatures in my Outlook's denote within one degree of the local norm. 

Precipitation (Rain & Snow water equivalent)  Below

While the jet stream pattern has been busy in spurts as of late; as the El Nino sub-tropical jet revs up into the winter, this is likely to drag the southern, wetter storm track south of the Lakes into the Ohio valley and points south and east - up the Coast. Most analogues and models suggest an average to drier than average winter. Keep in mind however; many times we have a below normal precipitation amount with normal or even above normal snowfalls. Average snowfall to liquid amounts in Southeast Michigan vary somewhat; but an average of 10-12" to 1'' is suitable.

Note: Below normal precipitation; more than /- 1.0"/ of the winter average water equivalent.  Normal precipitation; +/- 1.0" of the winter average water equivalent and above normal precipitation; better than /+1.0"/ of water equivalent above the average.

Snowfall - Normal to Below

The especially tricky part of this forecast is how much of the expected precipitation will be snow and where the storm tracks set up. In the analogues: snowfall in many of the earlier analogue winters ranged from below normal; to a few well above normal in the later winters. This is especially true over the southern sections of Southeast Michigan where a hint of above normal shows up the best. This make perfect sense since the main southern storm track will be closer to that area. Adding more to the complexity is that the later year Analogues (most after 2000) contain the above normal snows, which clouds the prognostication picture even more.  On the flip-side; below normal snows could certainly occur especially if the storm track rides further north or south - or fewer storms affect the region. At this early juncture however; normal to below normal snowfall seems most suitable.

Note - Below Normal snowfall; less than /- 5.0"/ of the winter average snowfallNormal snowfall; +/- 5.0" of the winter average snowfall and above Normal snowfall; better than /+5.0"/ of snow above the average.

Hemispheric Discussion

The upcoming winter's ENSO in the Pacific is expected to fade from an initially strong intensity El Nino to a moderate intensity later in the winter and early spring. As of November; there still is a decent chance the El Nino will evolve into a Modoki El Nino as discussed above. 
 
The analogue winters in this year's study are enhanced in red below. For more on categorization of ENSO; see the following and here. Years before 1950 are added due to estimated data researched.

El Nino -

Moderate Strong

1911-12 1899-00

1940-41 1925-26

1951-52 1930-31

1963-64 1957-58

1968-69 1991-92

1986-87

1994-95

2002-03

2009-10

 ENSO Regions in the Pacific


Current ENSO map conditions and SST anomalies as of early November


While developing the El Nino; the specific CFSv2 model has suggested a more typical El Nino to occasionally a Modoki rather than just a Modoki. Note the warmer departures over the central Pacific and near the coast of South America.  In fact; foreign and stateside models have generally held with a forecast of an El Nino for the winter ranging from east-based to a centrally-based Modoki as the El Nino evolves. This was the case in a number of the chosen analogues but there are various other factors presented here to consider for the winter.


CFSv2
 
Foreign Models Consensus


The Oceanic Nino Index /ONI/ chart below from 1850 into 2023 below;  shows all the El Nino's and La Nina's.
 
                                                              ONI


North Atlantic/Arctic Oscillation - NAO/AO 

Most winters; the phase of the NAO/AO is one of the most important ingredients to the type of winter to be had over the central and eastern part of the country. This is one of the most elusive oscillations to predict for more than a week or two.


One of the more impressive patterns seen this summer was the negative dominance of the NAO /AO state. This was one of the main reasons we had a relatively cool summer with temps averaging slightly below 1991-2020 normals. Since the fall, the pattern has been more variable again with positive and negative oscillations prevailing.The majority of ensemble members below, forecast average to below average for the remainder of November.


POLAR VORTEX WEATHER

So why is all this important? Why do we care about the Polar Vortex every Winter?

The answer is actually quite simple. This stratospheric polar circulation, called the Polar Vortex, can mean the difference between a very cold and snowy winter and a warm and dry Winter.

A strong Polar Vortex usually means strong polar circulation. This usually locks the colder air into the Polar regions, creating milder conditions for most of the United States and Europe. I the Polar regions, creating milder conditions for most of the United States and Europe. In these conditions, the Winter can be mostly warmer than normal across the mid-latitudes.

 
In contrast, a weak Polar Vortex can create a weak jet stream pattern. The colder arctic air is harder to contain, which can now escape from the polar regions into the United States and/or Europe. Image by NOAA.

So, if you are a fan of a warmer winter across the United States and Europe, you will prefer a strong Polar Vortex. But if you like proper winter weather with cold and snow, a weak/disrupted Polar Vortex is your best bet.

 
As each year is different in the story of the Polar Vortex, we will look at the latest data in the Stratosphere and how a new Polar Vortex is starting to emerge for the 2023/2024 Winter season. 

 Siberia/Eurasia Snow Cover 

One of the studies by Dr. Jonah Cohen uses October snow-cover over Siberia/Eurasia to aid in projecting out the main phase of the NAO and likely corresponding temperature pattern for the winter. In my analogues; I've included this past October's coverage and considering the rate of coverage compared to that of the Modoki and typical El Nino's  back to the Winter of  '72-73. Results show; this October had been slower to accumulate snow-cover over that region than some of the analogue years. There was however; a notable increase in snow-cover very late October into early November.
 

(Mr. Cohen's Twitter account.)
 
The high latitude surface forcings that I follow closely are not showing much direction.  In recent winters even when Eurasian snow cover extent has been low, snow depth in Siberia has been high.  Lv et al. (2020) argued that deep snow in Siberia favors a weaker PV.  However snow is shallow in large parts of Siberia as seen in Figure iii but shows up more dramatically in this tweet from the @WorldClimateSvc.  Also Arctic sea ice extent is below normal but it is almost equally distributed in Baffin Bay, the Barents Kara Seas and the Beaufort Seas.  Until the negative anomalies become focused in the Barents-Kara Seas this does not support a large PV disruption but could help support more stretched PV events.
The strongest case that I can present for an eventual weakening of the PV is a notable west to east dipole in snow cover extent anomalies (below normal in the west and above normal in the east) this month across Eurasia (see Figure iv).  As I discussed in the blog from 23 October 2023, research has shown this pattern can favor a weak PV and a negative AO/NAO during the winter.

This update with more snow cover and the larger than average snow cover over Canada may signal a likelihood of a -NAO/-AO  prevailing this winter and thus; colder temperatures.

Here is the latest snow cover over the Northern Hemisphere as of November 11th 2023 - red trace). As you can see, by Nov 11th, this year's Northern Hemisphere trace is near the top of the traces for this particular time period.


Dr. Cohen also notes the latest CFS 500MB projections into  and through December 2023. Be advised these change frequently and should never be taken as gospel, especially this far out.
 

  https://twitter.com/judah47/status/106307828335


Pacific Decadal Oscillation /PDO/ and associated subset EPO

The previous phase Pacific Decadal Oscillation has recently oscillated between positive and negative phase. As of November, a negative phase is more dominant but again, a more mixed signal has also been seen.
 
A typical positive phase of the PDO is represented on the left side and a negative phase on the right of the and can be compared it to the current state (below). As mentioned, a somewhat mixed result can be discerned over the Pacific but with a nod to the negative phase. 
 
Recent Numerical Values 
Pacific Decadal Oscillation (PDO)
Date
PDO
Sep 2023-2.97
Aug 2023-2.47
Jul 2023-2.52
Jun 2023-2.50
 
At this time; the warmer SST's nearer the West coast and up into Alaska and Aleutians /conflicting positive phase/ generally encourages high pressure ridging which may help at times, deliver Polar and Arctic air from the northern Canadian regions into the Lakes. This was especially true during the hard, snowy winter of 2013-14 where the NAO was not always negative.


Eastern Pacific Oscillation /EPO/

The Eastern Pacific Oscillation /EPO/ is a variation in the atmospheric flow pattern across the eastern Pacific many times into Alaska. When the EPO is in a positive phase, mild Pacific air flows straight into the West Coast of North America. When the EPO is in a negative phase, a ridge forms in the upper winds along or off the West Coast over the eastern Pacific. I feel not enough emphasis is put on the EPO for some Winter Outlooks for the Great Lakes and some other regions.


 THE QBO INFLUENCE

The QBO, or Quasi-Biennial Oscillation, is an oscillation in the wind direction in the stratosphere within about 15 degrees of the equator. Over a roughly two-year period, winds tend to oscillate between westward and eastward, with the switch between west and east winds starting high in the stratosphere and then shifting lower in altitude with time. The QBO is the result of waves propagating vertically in the atmosphere that then interact with the mean flow to slowly change wind speeds and direction. These changes influence the overall global circulation patterns, which in turn influence winter weather patterns across North America. 

The amplitude of the easterly phase is about twice as strong as that of the westerly phase. At the top of the vertical QBO domain, easterlies dominate, while at the bottom, westerlies are more likely to be found. At the 30mb level, with regards to monthly mean zonal winds, the strongest recorded easterly was 29.55 m/s in November 2005 and again, in the summer of 2017 when 29.05m/s occurred. The strongest recorded westerly was only 15.62 m/s in June 1995 (Wikipedia).

If you notice on my analogues; I included the QBO's for each available analogue winter and compared it to the upcoming winter's QBO phase and trend. The present and expected QBO this winter is for a peaking, at least to a moderate ,easterly QBO.  The set of maps below show the differing influences of the QBO dependent on phase and trend. The QBO is presently is a weak easterly and increasing and is expected to strengthen further to at least a moderate easterly as the winter opens. Therefore; a clear choice for QBO influence is A. Another contrary pattern seen for a typical El Nino.

QBO and WinterTemperatures Trends

 SOLAR CYCLE /SC/

Solar cycle actual effects on short term weather and longer term climate variability remain a controversial subject. I've read several articles which support or are against their shorter term winter relevancy. Some theorize that both natural solar cycles and man's influence affect our climate. I am in favor of the solar cycle being somewhat relevant and sometimes giving the present winter cycle a "little kick" in regard to hemispheric wind flow patterns and resulting temperatures.  Numerous recent studies for example, do in fact make the connection to our climate and solar activity including wintertime effects. One of the studies stated the following:
 

The Euro–Atlantic sector seems to be a region with a particularly strong solar influence on the troposphere. In fact, significant positive correlations between solar activity and  surface temperature in Europe have been reported in several papers (e.g. Tung and Camp, 2008; Lean and Rind, 2008; Lockwood et al., 2010; Woollings et al., 2010), although long records tend to give very weak signals (van Oldenborgh et al., 2013). We found a weak but significant change in the mean late winter circulation over Europe, which results in detectable impacts on the near-surface climate. Figure 9 suggests that during solar minima more cold air is ad-   vected from the Arctic, thus resulting in a slightly increased probability of colder winters for large parts of the continent. Sirocko et al. (2012) recently reached the same conclusion after analyzing 140 yr in 20CR, although their results bare strongly dependent on their selection criteria for the solar minimum composite (van Oldenborgh et al., 2013), which includes only one winter for each solar cycle".

Comparing solar cycles of the past analogue winters to the present is a possible influence only and not a major contributor. While the solar cycle was in various modes, the tendency is for La Nina's to Neutral winters to occur during the mid to lower part of the cycle or during an overall, weaker cycle. This season's El Nino analogues resulted in about half in the lower/upper part of the sunspot cycle.


Longer Term Solar Sunspot Activity since 1900 (includes this season's Winter Analogues)


 Recent Sunspot chart since 1996

Closest winter position in the solar cycle to 2023-24 in descending order (and there's only a few); 1972-73, 1963-64, 1925-26. 


      WINTER 2023-24 ANALOGUES


     (CLICK ON TO ENLARGE)

Some additional category explanations in the analogue chart from left to right:

AO/SC

AO - The predominant phase of the Arctic Oscillation during that winter. AO- (negative), AO (neutral) or AO+ (positive).

SC -  position of the solar cycle during that winter. Breaking it down (see solar cycle chart):  

SC-- (opposite high cycle compared to the present, least similar) SC+/- (sunspots waning but not near minimum or 2018 low level. Finally, S++ where solar sunspot cycle is at or very close to the low cycle of 2018-19 and/or is at the same decline with 2018...the best comparison and likeness.
          
QBO - W=West wind prevailed that winter or E=East wind prevailed. Trends: -/- (weak and weakening trend), -/+ (weak but strengthening), s (steady trend, no change) +       
moderate and strengthening +/- strong but weakening. The closest QBO likeness years are several; 2009-10, 1991-92, 1986-87, 1972-73, 1968-69 (and earlier analogues are unknown). Therefore, out of the nine known QBO's seven contain at least some sort of easterly component - with five of those, closest to 2023-24.
         
Sib snow - Siberian snow cover in October and rate of change. All previous analogues winters had mixed snow covers compared to this past October's/early November. Notations: WA=Way above, A= above, B=below, % = equal to.


WINTER ANALOGUE SUMMARY 


Temperatures 


One of the first things one notices about this winter's analogues is the variety of winters experienced under the above conditions. As mentioned above the type of winters as far as temperatures were almost evenly divided with normal to below normal temperatures prevailing. As discussed in the past, because of the warmer trends experienced the last several years (and incorporated in the norms) it is logical that the analogue winters would average cooler than the current /1991-2020/ norms. Simply stating; the new norms skew the former year analogues averages lower/cooler and this is accounted for and kept in mind for the temperature outlook.

Precipitation and Snowfall 

Generally with precipitation (both rain and snow); below average amounts dominated. However; there were just enough above normal precipitations and snowfalls to seriously consider - being most occurred in more recent winters. What's curious to  note are the best snows occurred in the earlier and later years of the analogues with a decided drier snow sample mid term.

Temps/Pcpn maps longer term norms (best representation and less skewed) and shorter term for analogue years Nov-Mar /cold season/


Below are the maps from the analogue winters for Temperature and precipitation departures, 500MB Low placement and subsequent likely storm track placement (Nov-Mar). Note the time period encompasses March also (still a winter month in my book). The El Nino pattern aided by blocking in the northern latitudes leaves Southeast Lower Michigan below average. Larger departures in the deep south reflect the colder air is able to push well south. 


  TEMPERATURES  

/USING LONG TERM NORMS 1895-2000/ - Best


/USING RECENT 1991-2020 NORMS/


Precipitation

/USING LONG TERM NORMS 1895-2000/ - Best


/USING RECENT 1991-2020 NORMS/


 500 MB LOW/HIGH HEIGHT PLACEMENT


This map represents the suppressed 500 MB low pressure heights with several El Nino/Modoki analogue winters - not wind maxes/minimums - and the strong high pressure 500 MB heights/blocking centered on Greenland and extending westward into Canada. This pattern tends to push the colder, below normal jets/temperatures south of their normal winter position. 


Storms tracks across the Great Lakes and points south and east should prove interesting. The track projected over the region should vary enough to bring snow and/or mixed precipitation along with rain to Southeast Michigan - like most winters. As warmer air masses are able to push north with troughing west, look for the track to veer to the north and west. Likewise; as colder air engulfs the region and troughing forms southwest and south, the track shoots lows northeast and east into the Lower Lakes and Ohio Valley and points south and east.
 

STORM TRACK PLACEMENT  2023-24


Euro Winter 2023-24 Outlook - Temp


                         Euro Winter 2023-24 Outlook -Pcpn


Making weather fun while we all learn,
Bill Deedler -SEMI_WeatherHistorian