Jan 21, 2014

Powerful Arctic Vortex To Blast The Region Once Again This Weekend!

As mentioned in my last blog; round two of a very similar Arctic air mass to the one earlier this month is slated to plow south into the Great Lakes this weekend and hold over the region well into next week. This bitter Arctic air, straight out of the Polar region and directed by another intense Arctic vortex, will drive due south into the Great Lakes and Southeast Lower Michigan on Saturday. The cold in this air mass should be similar to one experienced back earlier in the month on the 6th through the 8th when temperatures plunged below zero across the region.

What will make this air mass change especially dangerous will be the wind chills created by very strong southwest to west winds that will blow in advance of the Arctic front itself on Friday; this in spite of the warmer air moderation ahead of the Arctic front passage during Saturday. Then, the sharp, bitter colder strong north winds pushing across the land behind it on Saturday into Sunday!  A powerful low pressure system will spin up along Arctic air mass and drive snow and snow squalls along with considerable blowing snow on Friday into Saturday as it approaches. Depending on the atmosphere and wind trajectory Saturday,  snow squalls off the Lakes could be quite aggressive.

More as this system develops and particulars become more evident...


Making weather fun while we all learn,
Bill Deedler -SEMI_WeatherHistorian


Jan 17, 2014

Best Winter Analogue Thus Far; 1981-82...a Closer Look at January Then and Now

As reported in my last blog there in my original analogue set for the Metro Detroit area there were an overwhelming number of analogues that projected a cold winter this go-around for the Winter of 2013-14. As seen below in Fig -1; there were 13 of the original 16 that projected temperatures more than a degree below normal. An extra-ordinary amount when you consider 82% of the selected analogue winters warned of a cold winter. Such a strong signal that I stated; "I can't go against a cold signal this strong and dominant nor from what I'm seeing this fall, therefore below normal it is". 
                                                                                         Fig -1

Then; studying the best performers, I narrowed it down to 5 - 8 analogues that had did a good to great job in projecting December's temperatures for all three cities.

                                                                                            Fig - 2


Finally; up through mid January for the first half of the meteorological winter using Detroit's analogues (largest data set), I narrowed it to six of the eight analogues above (in Fig 3) that projected the first half of the winter best (granted the second half of January is yet to play out - and more on that shortly).


                                                                                          Fig - 3


As the winter plays out, I suspect more cold analogues will step aside revealing the analogues that best performed for the entire winter as far as cold and snow. Remember; these analogues are used only as guidance as NO two winters are ever exactly alike. Think of these majority of players (in the first case; cold and second case; cold & normal to above snow) pointing the direction the upcoming winter is liable to unfold. And in that task, they have done exceedingly well so far into mid winter, one that has performed very well in regard to cold and above normal snow especially in January thus far; 1982...

National View


_________________________________________________________________________________


Note the blocking pattern in the polar arena over Alaska extending south over the far eastern Pacific and east across the Pole to Greenland in January 1982. In addition, ridging along the West Coast helped deliver the cold across mainly two-thirds of the country. This has been the same similar blocking in the high latitudes that delivered this January's brutal cold wave recently. Back in 1982, the cold came in mainly two brutal waves with dangerous cold and wind chills. Many might remember the weekend of the Super Bowl here in Metro Detroit. From Wikipedia;

The game was played on January 24, 1982, at the Pontiac Silverdome in Pontiac, Michigan, a suburb of Detroit. It marked the first time that a Super Bowl was held at a cold-weather city. The domed stadium saved the crowd at the game from the very cold and snowy weather, but the weather did affect traffic and other logistical issues related to the game. 

Also note the preceding weekend in January and even much later in April;


  •       A brutal cold snap sends temperatures to all-time record lows in dozens of cities throughout             the Midwestern United States.
    • Cold Sunday was a meteorological event which took place on January 17 when unprecedentedly cold air swept down from Canada and plunged temperatures across much of the United States far below existing all-time record lows.
    • On April 6 - A blizzard unprecedented in size for April dumps 1-2 feet of snow on the northeastern U.S., closing schools and businesses, snarling traffic, and canceling several major league baseball games.

  • Finallly; check out Detroit's Local Climatic Data from January 1982 and compare it to this January thus far. I remember January of '82 well; the cold combined with the bitter wind chills are in the blue shaded areas, much like we just experienced earlier this January. An important note about January 1982, the cold waves came down in two mammoth plunges with a third "weaker" plunge on Superbowl weekend. In addition; just like this January, the month wasn't always cold. The mildest week actually occurred the first week (pink shades) of the month, not mid-month like this January - which is more typical of a January Thaw. Another difference; snowfalls during January 1982 were mainly light and scattered before the big dump at the close, which brought the snow total up to 20 inches even. This January, several snow events have already brought more snow /26"/ than in 1982.

    Again, remember what I stated earlier - no two months are exactly alike but when you look a little closer, you might see mom nature may be re-running an old show with different players and timing.

    Oh, and what about that second bitter cold plunge that occurred January 1982, is that going to be "re-run" too?


    I'm glad you asked because it is looking more and more a certainly as the giant Arctic refrigerator has been recharging for yet another bitter cold onslaught. Also at this mid-winter time; I'll update any part of the Outlook if need be; so come back to my blog soon.
     
    --------------------------------------------------------------------------------------------------------------------------------------------------------
    000
    CXUS53 KDTX 160800
    CF6DTW
    PRELIMINARY LOCAL CLIMATOLOGICAL DATA (WS FORM: F-6)
    
                                              STATION:   DETROIT MI
                                              MONTH:     JANUARY
                                              YEAR:      2014
                                              LATITUDE:   42 13 N
                                              LONGITUDE:  83 20 W
    
      TEMPERATURE IN F:       :PCPN:    SNOW:  WIND      :SUNSHINE: SKY     :PK WND
    ================================================================================
    1   2   3   4   5  6A  6B    7    8   9   10  11  12  13   14  15   16   17  18
                                         12Z  AVG MX 2MIN
    DY MAX MIN AVG DEP HDD CDD  WTR  SNW DPTH SPD SPD DIR MIN PSBL S-S WX    SPD DR
    ================================================================================
    
     1  17  11  14 -12  51   0 0.30  6.4    3  8.5 16  20   M    M  10 1      28  80
     2  15   4  10 -16  55   0 0.16  4.4   10 15.7 25 360   M    M  10 19     32 360
     3  12  -5   4 -22  61   0    T    T    8  8.7 17 170   M    M   4        23 160
     4  31  10  21  -5  44   0    T    T    8 14.2 29 200   M    M   7        36 200
     5  32  20  26   0  39   0 0.90 10.2    8  7.2 23 320   M    M  10 12     30 320
     6  20 -14   3 -23  62   0 0.06  0.8   16 21.2 32 230   M    M   8 189    38 230
     7  -1 -14  -7 -33  72   0 0.00  0.0   16 18.9 26 210   M    M   4        32 220
     8  16  -7   5 -21  60   0    T    T   15  7.3 16 210   M    M   8 18     17 210
     9  22  -4   9 -17  56   0 0.03  0.6   14  2.3  8 120   M    M   8 18     14 350
    10  38  22  30   4  35   0 0.35  0.1   13  6.0 13 170   M    M  10 12     16 110
    11  42  34  38  12  27   0 0.23  0.0   10 12.8 28 230   M    M  10 12     33 250
    12  37  33  35  10  30   0 0.00  0.0    7 13.2 21 200   M    M   8        29 260
    13  45  34  40  15  25   0 0.00  0.0    5 12.3 22 200   M    M   7        29 200
    14  39  25  32   7  33   0    T    T    4  9.6 29 210   M    M   7 8      37 220
    15  31  21  26   1  39   0    T    T    4 15.7 29 200   M    M  10        38 200
    ================================================================================
    SM  396  170       689   0  2.03    22.5 173.6          M      121
    ================================================================================
    AV 26.4 11.3                              11.6 FASTST   M    M   8    MAX(MPH)
                                     MISC ---->  # 32 230               # 38  230
    ================================================================================
    NOTES:
    # LAST OF SEVERAL OCCURRENCES
    
    COLUMN 17 PEAK WIND IN M.P.H.
    
    PRELIMINARY LOCAL CLIMATOLOGICAL DATA (WS FORM: F-6) , PAGE 2
    
                                              STATION:  DETROIT MI
                                              MONTH:    JANUARY
                                              YEAR:     2014
                                              LATITUDE:   42 13 N
                                              LONGITUDE:  83 20 W
    
    [TEMPERATURE DATA]      [PRECIPITATION DATA]       SYMBOLS USED IN COLUMN 16
    
    AVERAGE MONTHLY: 18.9   TOTAL FOR MONTH:   2.03    1 = FOG OR MIST
    DPTR FM NORMAL:  -6.9   DPTR FM NORMAL:    1.02    2 = FOG REDUCING VISIBILITY
    HIGHEST:    45 ON 13    GRTST 24HR  0.90 ON  5- 5      TO 1/4 MILE OR LESS
    LOWEST:    -14 ON  7, 6                            3 = THUNDER
                            SNOW, ICE PELLETS, HAIL    4 = ICE PELLETS
                            TOTAL MONTH:  22.5 INCHES  5 = HAIL
                            GRTST 24HR  10.2 ON   M    6 = FREEZING RAIN OR DRIZZLE
                            GRTST DEPTH:  16 ON  7, 6  7 = DUSTSTORM OR SANDSTORM:
                                                           VSBY 1/2 MILE OR LESS
                                                       8 = SMOKE OR HAZE
    [NO. OF DAYS WITH]      [WEATHER - DAYS WITH]      9 = BLOWING SNOW
                                                       X = TORNADO
    MAX 32 OR BELOW:  10    0.01 INCH OR MORE:   7
    MAX 90 OR ABOVE:   0    0.10 INCH OR MORE:   5
    MIN 32 OR BELOW:  12    0.50 INCH OR MORE:   1
    MIN  0 OR BELOW:   5    1.00 INCH OR MORE:   0
    
    [HDD (BASE 65) ]
    TOTAL THIS MO.   689    CLEAR  (SCALE 0-3)   0
    DPTR FM NORMAL    99    PTCLDY (SCALE 4-7)   9
    TOTAL FM JUL 1  3168    CLOUDY (SCALE 8-10)  6
    DPTR FM NORMAL   281

    Making weather fun while we all learn,
    Bill Deedler -SEMI_WeatherHistorian

    Jan 3, 2014

    Update 1/6/14 - Snowfall Totals from Major Winter Snowstorm; January 4th-5th, 2014

    Update 1/6/2014 - 5PM
     

    Snowfall Totals from January 4th-5th, 2014

    Snowfall Totals from  January 4th-5th, 2014
    PUBLIC INFORMATION STATEMENT...STORM TOTALS
    NATIONAL WEATHER SERVICE DETROIT/PONTIAC MI
    1056 AM EST MON JAN 6 2014
    
    
    STORM TOTAL SNOW REPORTS
    
    LOCATION                  SNOWFALL     DURATION
                              (INCHES)      (HOURS)        LAT       LON
    
    ...BAY COUNTY...
       PINCONNING              M   5.0           30     43.86N    83.96W
       NE BAY CITY             M   7.0           30     43.59N    83.89W
    
    ...GENESEE COUNTY...
       GOODRICH                M  11.8           30     42.92N    83.51W
       4 N BURTON              M  13.2           30     43.05N    83.62W
       1 SE GRAND BLANC        M  13.9           30     42.92N    83.60W
       FLUSHING                M  14.5           30     43.06N    83.84W
       LINDEN                  M  16.0           30     42.82N    83.78W
       FLINT                   M  17.1           30     43.02N    83.69W
       2 W SWARTZ CREEK        M  18.0           30     42.96N    83.87W
    
    ...HURON COUNTY...
       PORT AUSTIN             M   5.0           30     44.04N    83.00W
       BAD AXE                 M   5.2           30     43.80N    83.00W
       GRINDSTONE CITY         M   7.5           30     44.05N    82.90W
       PORT HOPE               M  13.4           30     43.94N    82.72W
    
    ...LAPEER COUNTY...
       4 W LAPEER              M  16.5           30     43.05N    83.40W
       NORTH BRANCH            M  17.0           30     43.23N    83.19W
    
    ...LENAWEE COUNTY...
       6 ENE ADRIAN            M   8.0           30     41.93N    83.94W
       ADRIAN                  M   8.0           12     41.90N    84.04W
       2 WNW TIPTON            M   8.9           30     42.03N    84.10W
       MORENCI                 M  12.0           30     41.72N    84.22W
    
    ...LIVINGSTON COUNTY...
       3 NW PINCKNEY           M  11.7           30     42.49N    83.99W
       WHITMORE LAKE           M  13.0           30     42.43N    83.75W
       HOWELL                  M  14.0           30     42.61N    83.94W
       HOWELL                  M  15.9           30     42.61N    83.94W
       2 W FOWLERVILLE         M  17.5           30     42.66N    84.11W
    
    ...MACOMB COUNTY...
       MOUNT CLEMENS           M   6.5           24     42.60N    82.88W
       CENTER LINE             M   7.5           30     42.48N    83.03W
       4 NNW RICHMOND          M   8.5           30     42.86N    82.78W
       SSE NEW BALTIMORE       M   9.8           30     42.68N    82.74W
       UTICA                   M  10.0           30     42.63N    83.02W
       1 NNW UTICA             M  10.5           30     42.64N    83.03W
       SHELBY TOWNSHIP         M  11.0           30     42.67N    83.03W
    
    ...MIDLAND COUNTY...
       2 ENE MIDLAND           M   5.2           30     43.63N    84.19W
       MIDLAND                 M   6.0           30     43.62N    84.23W
    
    ...MONROE COUNTY...
       3 SE NEWPORT            M   8.6           30     41.97N    83.27W
       MONROE                  M   8.9           30     41.92N    83.39W
       4 SSE NEWPORT           M   9.6           30     41.95N    83.28W
       MONROE                  M   9.8           30     41.92N    83.39W
       DUNDEE                  M  10.0           30     41.96N    83.66W
       TEMPERANCE              M  11.0            M     41.77N    83.57W
       CARLETON                M  13.0           30     42.06N    83.39W
    
    ...OAKLAND COUNTY...
       FARMINGTON              M   6.7           30     42.46N    83.38W
       2 N FERNDALE            M   7.1           30     42.49N    83.13W
       FARMINGTON HILLS        M   8.1           30     42.49N    83.38W
       3 SW BLOOMFIELD HILLS   M   8.5           30     42.55N    83.29W
       PONTIAC                 M   9.1           30     42.65N    83.29W
       E WHITE LAKE            M   9.9           30     42.65N    83.50W
       5 N ROCHESTER           M  11.1           30     42.76N    83.12W
       CLARKSTON               M  12.0           30     42.74N    83.42W
       4 SSE LAKE ORION        M  12.9           30     42.73N    83.21W
       FARMINGTON HILLS        M  13.2           30     42.49N    83.38W
       WATERFORD               M  14.5           30     42.66N    83.39W
       4 E WHITE LAKE          M  14.6           30     42.65N    83.43W
       CLARKSTON               M  15.3           30     42.74N    83.42W
    
    ...SAGINAW COUNTY...
       5 S MERRILL             M   6.8           30     43.34N    84.34W
       FREELAND                M   8.3           30     43.52N    84.12W
       3 NW SAGINAW            M   8.4           30     43.45N    83.99W
       2 E FREELAND            M   8.8           30     43.52N    84.08W
       BRIDGEPORT              M   9.3           30     43.38N    83.88W
       HEMLOCK                 M  10.5           30     43.42N    84.23W
       3 ESE BIRCH RUN         M  11.0           24     43.23N    83.74W
    
    ...SANILAC COUNTY...
       LEXINGTON               M   9.7           30     43.27N    82.53W
       SANDUSKY                M  13.0           30     43.42N    82.83W
       2 W PECK                M  16.0           30     43.26N    82.86W
    
    ...SHIAWASSEE COUNTY...
       CORUNNA                 M  16.4           30     42.98N    84.12W
       OWOSSO                  M  18.7           30     43.00N    84.18W
    
    ...ST. CLAIR COUNTY...
       2 W PORT HURON          M  10.6           30     42.99N    82.47W
       ALGONAC                 M  10.6           30     42.62N    82.53W
       GOODELLS                M  11.0           30     42.98N    82.68W
       FORT GRATIOT            M  13.0            M     43.01N    82.43W
    
    ...TUSCOLA COUNTY...
       CARO                    M   9.9           30     43.49N    83.40W
       3 E DEFORD              M  14.0           30     43.52N    83.13W
       MILLINGTON              M  16.0           30     43.28N    83.53W
    
    ...WASHTENAW COUNTY...
       MILAN                   M   8.0           30     42.09N    83.68W
       CHELSEA                 M   9.5           30     42.31N    84.02W
       2 WNW ANN ARBOR         M  10.0           30     42.29N    83.77W
       SALINE                  M  10.2           30     42.18N    83.78W
       SE ANN ARBOR            M  10.3           30     42.28N    83.73W
       ANN ARBOR               M  10.4           30     42.28N    83.73W
       DEXTER                  M  11.7           30     42.33N    83.88W
       ENE DEXTER              M  12.0           30     42.33N    83.88W
       CHELSEA                 M  14.0           30     42.31N    84.02W
    
    ...WAYNE COUNTY...
       GROSSE POINTE           M   7.6           30     42.39N    82.91W
       4 NE DEARBORN           M   7.8           30     42.35N    83.16W
       LIVONIA                 M   8.0           30     42.40N    83.37W
       2 NNW LIVONIA           M   8.4           30     42.42N    83.39W
       N LIVONIA               M   8.4           30     42.40N    83.37W
       GARDEN CITY             M   9.4            M     42.33N    83.33W
       BROWNSTOWN TOWNSHIP     M   9.5           30     42.15N    83.26W
       WYANDOTTE               M   9.9           30     42.21N    83.16W
       RIVERVIEW               M  10.5           30     42.17N    83.19W
       ROMULUS                 M  10.6           30     42.22N    83.37W
    
    
    M = MEASURED
    E = ESTIMATED
    
    _____________________________________________________________________________________________

    Update 1/5/2014 - 1230 PM

    Major Winter Storm and Associated Arctic Blast on Schedule!

    Little change in previous thoughts on this major winter storm (see previous blogs). One earlier statement remains especially valid "I expect the storm to be one of the more memorable ones (if not most) this winter because of the combination of snow and bitter cold strong winds on the backside."

    No change in basic snowfall amounts"(8"- 12" and locally higher)" with the locally higher part not locally but more areas of 12" - 16" due to the heavier snow band that fell overnight due to overrunning moisture that generated the snow. Totals of  3" to as much as 7"snow fell mainly over central and portions of northern Southeast Lower Michigan; mainly from the 696/I-96 corridor northward across the Saginaw Valley and portions of the Thumb.

    Strong Arctic winds feeding the system will commence overnight Sunday and be in full force Monday. Considerable blowing and drifting snow will cause near blizzard or blizzard conditions at times on Monday. Temperatures will plunge down to between -10 to + 5 by Monday afternoon with wind chills of -20 to as low as near -40!

    ________________________________________________________________________________________
    Update 1/4/2014 - 1230PM; Latest model reviews and Storm Outlook

    Dangerous Bitter Cold Storm to Impact Southeast Lower Michigan Sunday Into Monday!

    Models continue to vary a bit but general consensus is for a major storm across the areas mentioned in last blog below.

    Set up continues to be quite interesting as far as how much phasing will come together over the eastern Great Lakes. This mornings US guidance now shows the NAM deepening her a bit more as she naturally veers the track to the northwest to compensate for the intensification. This is roughly between yesterday afternoon's UK /British model fig 2/ and this morning's GFS. It's interesting to note the latest British model /00z-UK/ veered her track back east toward Eastern Ohio/West Pennsylvania - got to love these models! Overnight's /00z/ European  is pretty much siding with her sister /UK/ and moving the low center over Eastern Ohio/West Penn.

    I like a track closer to NAM given the strong dynamics that will feed the storm BUT the question is (and like mentioned yesterday), when?  Looking at data now available, I prefer a track/pressure between the NAM (fig -1) and 00z Euro/UK until she rides just northeast of Southeast Lower Michigan in Ontario where she'll rev-up quicker. This would take the center between Sandusky Ohio and Cleveland over Lake Erie to west of Toronto (or the ending of track 3 on my Winter Outlook, over the Eastern Great lakes fig -2).

    FIG - 1


     FIG - 2

    Snowfalls from cold front that slides down Southeast Lower Michigan and storm moving up the Ohio Valley generally will range from 8" - 12" (locally higher) by Monday afternoon. Strong Arctic winds feeding the system will commence overnight Sunday and be in full force Monday. Considerable blowing and drifting snow will cause near blizzard or blizzard conditions at times on Monday. Temperatures will plunge down to between -10 to + 5 by Monday afternoon with wind chills of -20 to as low as near -40!

    -Latest Canadian just in sides closer to NAM with center over northwest Ohio Sunday night.

    Stay Tuned for further updates 'cause it's gonna be a bumpy ride the beginning to the first week of the new year!


    Making weather fun while we all learn,
    Bill Deedler -SEMI_WeatherHistorian

    __________________________________________________________________________________________
    1/3/14
    As mentioned in my last blog; it's been a while since Southeast Lower Michigan has seen such bitter cold temperatures that we actually felt initially this morning (when widespread below zero readings were attained) and are slated to arrive again on strong blustery winds behind an intensifying snowstorm on overnight Sunday into Monday.

    All latest meteorological guidance continues to slam the Great Lakes, Upper Midwest and Ohio Valley Into Canada with a dangerous storm center as far as snow and especially bitter cold air in it's wake. At this early juncture; I expect the storm to be one of the more memorable ones (if not most) this winter because of the combination of snow and bitter cold strong winds on the backside. Worst of the winter weather should be Sunday night into Monday. More at question now is not the bitter cold but as usual; the snow amounts. On the lower side; generally 3 - 7" is possible across all of Southeast Lower Michigan with the heavier amounts over the far southeast corner. On the higher side; generally 6 - 12" could fall (again highest Southeast corner) with a classic heavy snow track (like intimated by some of the models).

    This storm is actually the product of two systems; a low pressure system deepening as it moves from the Texas/Arkansas area - a Texas Hooker - and a Arctic blast of some of the coldest air and wind chills of several winter seasons, out over south-central Canada. The Texas Hooker is projected to track northeast through the Ohio Valley and intensify as it advances into Southern Ontario on Monday as the coldest of Arctic air surges into the system.

    If this storm continues to phase more like is projected then near blizzard or blizzard conditions are a risk on Monday over the region. If phasing develops further northeast into Ontario Canada; then the very worst of the storm will be northeast. Even if this does happen (a lower probability as of this writing Friday afternoon) dangerously bitter cold wind chills will certainly blast the region on Monday along with considerable blowing and drifting snow! Lowest wind chill values of -20 to even down to near -40 are possible behind this storm!

    Updates to follow....

    Making weather fun while we all learn,
    Bill Deedler -SEMI_WeatherHistorian

    Jan 2, 2014

    Cold Winter Unfolding Thus Far Per Outlook as Preferred December Analogue Trajectories Verify


    Analogues Point to a Cold January Likely with Coldest Air of the Season Thus Far Due Early Next Week With Some Moderation Late
     
    After the cold below normal November; December followed November's cue unfolding as expected with mainly colder than average weather and larger departures below normal. All of Southeast Lower Michigan experienced below normal temperatures on average in December. Even with over a third of the month's days /13/ having above normal temperatures; it was the below normal temperature departure days that sunk December's average temperature and subsequent departures. In the end; December averaged 2 1/2 - 4 1/2 degrees below normal across Southeast Lower Michigan with Detroit @ 26.8/-3.3; Flint @ 25.0/-2.5 and Saginaw @ 22.8/-4.5. Snowfall got off to a good start for the first real month of winter with Detroit @ 15.5"/ +5.8"; Flint @ 16.9"/+ 5.1 and Saginaw 18.9"/+ 9.9".


    All inclusive analogue data projected a below normal December on average along with the majority of Decembers more than a degree below average. Researching the years of below average analogue December data, the recent pattern of the autumn including local data and upper wind pattern and past November's analogue data; it was decided to go for a cold December along with a cold general winter in the Winter Outlook.

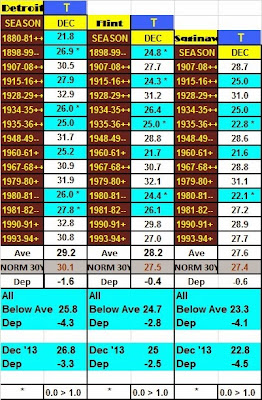
    Reviewing December's temperature data presented by this winter season's analogue's along with December's actual data outcome presented the following:

    Below normal analogue guidance for December dropped the average temperatures for December some 3 - 4 degrees below normal when using the majority (below) of three categories (above, normal, below) normal. December's predominant below normal data in the chart below shows just how close the below normal average (more than a degree and thus, considered below normal for our study - 8 /Detroit/, 7/Flint/, 5/Saginaw/) temperatures verified. All three cities came within a degree or less of the mean for below normal Decembers.  In addition; those individual analogue December's marked with an asterisk* were within a degree or less of December 2013's average. It also should be noted while Detroit came in a degree warmer than below normal analogues; those analogues years included a much less (if at all) heat island. Therefore; one could assume this past December's average temperature would fall closer to the analogue projected 25.8 temperature if the heat island affect was subtracted or diminished.


    In January's analogue guidance; below normal temperature guidance continued to rule but like last month, with some notable moderation breaks. In fact; the pattern this season does suggest the likelihood of a classic January thaw as progressive Pacific upper air jet streams also push inland and transverse the country. Meanwhile; the Polar and Arctic air over Canada will periodically get recharged during the depths of this winter.

    Frigid Blast

    The coldest air of the season thus far is slated to dive across the country later this weekend behind another storm system projected to develop ahead of the Arctic plunge. This storm is expected to move from the Arkansas region northeast into Ohio on it's way to New York state Sunday into Monday. More significant snow is likely to the north of this storm late in the weekend as bitter cold air follows in its wake at the opening of the first full week of January. Below zero temperature lows are expected to be widespread early next week; bringing the coldest air of the season and since January 2009. One might remember during that mid-month January period; Detroit's Flint's and Saginaw's temperatures fell below zero four or five days (depending on location) in a row from the 13th through the 17th. Detroit's coldest temperature cratered to -15 on the 16th and not to be out-done, Flint's fell to -19 on the 14th while Saginaw bottomed at -10. Expect some moderation in temperatures mid to late week.

    An update on the projected storm and frigid air to follow will be sent this weekend then up next; looking at the best performing analogues thus far and January's projections. 


    Making weather fun while we all learn,
    Bill Deedler -SEMI_WeatherHistorian

    Dec 20, 2013

    /Upated 12/22/13/ Significant Mixed Precipition To Hamper Driving This Weekend

    Update...12/22/13
     A damaging ice storm affected a significant portions of north and central Southeast Lower Michigan Saturday into early Sunday. For the particulars; Winter Storm Summary from the National Weather Service White Lake.

    12/20/13
    Periods of rain, freezing rain and some snow will be over Southeast Lower Michigan into the weekend; interfering with holiday shopping and travel in general. A storm center developing over Texas with slide northeast into the Eastern Great Lakes and bring a variety of dangerous winter weather to Southeast Lower Michigan. The worst of the weather will be in the form of freezing rain which will fall over much of the region at some point from Saturday afternoon into Sunday morning.


    This low pressure area will have a lot of moisture to work with as it slides into Northwest Ohio Saturday night, therefore significant icing is likely where temperatures hover in the lower 30s. At this time, it appears the worst of the icing risk will be over central and northern areas of southeast Lower Michigan where up to a 1/4 to around 1/2" of ice could accumulate. This would include at this time, Detroit's northwest-north-northeast suburbs. In the meantime, a straightening high pressure system over south-central and southeast Canada will continue to deliver cold air into to the wet system; gradually changing any residual rain and freezing rain to some snow on the backside later Sunday.

    Much of Southeast Lower Michigan will see more rain and freezing rain from this system with heaviest snow across the Saginaw Valley. Periods of snow, sleet and freezing rain will be confined to the Saginaw Valley and Thumb Region Saturday evening into Sunday, As colder air works back into the region, several inches of snow still could fall over the Saginaw Valley on Sunday.

    Stay abreast for storm updates!

    Making weather fun while we all learn,
    Bill Deedler -SEMI_WeatherHistorian


    Dec 13, 2013

    Low Pressure System Continues to Bring First Significant Snowfall Of The Season To Southeast Lower Michigan

    12/15 - Snowfall totals from the NWS DTX


    _________________________________________________________________________________________
    12/14- 12 Noon
    Our storm continues to unfold with widespread snow and some blowing snow as the system wraps up nicely and precipitates much of the available moisture. This has been increasing snowfall rates across the region and to the south this morning and this will persist this afternoon which helps fine turning snowfall amounts. With a slightly better storm center and very efficient snow producer; I look for mainly 5" - 7" across much of Southeast Lower Michigan south of  I-69 with scattered pockets of 8"+; especially from the Ann Arbor area into Metro Detroit and south to the Ohio border. Some blowing and drifting will also occur do to a stiff northeast to north wind of 10 to 20 mph and gusts occasionally near 25 mph.

    12/13
    A low pressure system moving through the Upper Ohio Valley on Saturday will bring a light to moderate snowfall to the region. Snow will overspread Southeast Lower Michigan later tonight and continue into Saturday evening before diminishing to flurries from west to east overnight Saturday into early Sunday morning.

     Look for snowfall totals to range in the 3 - 6" range across the southern half of the region (basically south of I-69) with the highest totals south of I-94. Some isolated totals of  6"+ are possible in the heaviest falls. Across the Saginaw Valley into the Thumb; generally 2 - 4" can be expected...a bit higher downwind of Lake Huron.  Lowest visibilities during the storm will range from around a 1/2 mile to 1 mile in snow or snow and light fog.


    This is Southeast Lower Michigan's first notable snowfall of the season of advisory criteria and motorists and holiday shoppers will observe poor winter driving conditions and be ready to act accordingly. In addition; the nearly persistent cold below normal temperatures of the past several weeks will continue into at least mid week which will preserve the snowfall and allow winter outdoor enthusiasts and snow lovers in general, time to enjoy it. This snowfall of course will give the region a Christmas scenario look at least before Christmas (see my "Past Christmas's" write-up blog will be online next week).

    Speaking of the holiday; another storm will possibly brew next week at this same time (the Friday into Sunday timeframe) but as of this writing; model trajectories are all over the board with the when, where and type of precipitation occurrence. At this very early date; one should at least be aware there is the risk of some type of winter mess affecting Southeast Lower Michigan next weekend, the weekend before Christmas. This will be a heavier traveled weekend to boot and updates on that system will be forthcoming.

    Making weather fun while we all learn,
    Bill Deedler -SEMI_WeatherHistorian


    Nov 19, 2013

    Second Neutral Winter Leaves Southeast Lower Michigan Out In The Cold

     Winter 2013-14 Outlook for Southeast Lower Michigan  

      William R Deedler; Southeast Michigan Weather Historian


    This being my 17th year of issuing season outlooks reminds me of how quickly the time has past, how variable and many times exciting the winters have been but most of all, how enthusiastic I still become at the challenges forecasting the upcoming season.

    This upcoming season looks to be a more exciting season than the past few (especially 2012-13). The winter of 2012-13 was a boring, slow season with hopes of snowstorms for snow lovers dashed frequently. And, while the Winter of 2012-13 started in that same vein, it did make up for the slow start with an active late season. On to the Winter of 2013-14...


    Local Data and Hemispheric Patterns suggest:

    Temperatures:

    Considering the lack of Pacific Ocean influences across the country this upcoming Neutral ENSO Winter (more below), I look for a more variable temperature winter. That being said; dominant trends of upper hemispheric pattern the past few recent seasons along with selected winter analogues (also below), suggest generally normal to below normal temperatures (but not exclusively) throughout the winter. In addition; winter analogues and resulting final statistical data strongly suggest a colder than normal winter. I look for the final winter statistical departure to range between -1.0  to -4.0 across Southeast Lower Michigan when compared to the 30 year 1981-2010 normals (also included on analogue charts).  

    While the analysis of my winter analogues show mainly below normal (very similar to our recent summer analogues), it is felt the coldest of analogues are too cold and thus, skewing the average down some. However, at the same time, some of the cold outbreaks seen this winter will rival some of the outbreaks seen in recent milder winters leading to a normal to above normal amount of below zero days.


    Expanding on this “normal” idea, it is interesting to note that the 100 year winter mean temperaturefor Detroit is approximately 26.7 degrees with a one standard deviation spread of 3.5 degrees either side of that 26.7. Statistically speaking, based on this data the temperatures could average as low 23.2 degrees or as high as 30.2 and still be considered within a “normal” range of the mean under one standard deviation. Basically, this just supports the idea that winter temperatures in these parts, by nature, have a wide statistical range and this winter should be no exception!

    Snowfall and Rainfall:

    Snowfall patterns this winter - as with most across Southeast Lower Michigan - will be mainly a result of the dominant synoptic storm tracks evolving and a lesser result of Lake Effect snows. However, it should be noted that considering the pattern expected to evolve; this should be a fairly active lake effect season for the Great Lakes as a whole.

    As would be somewhat expected in a Neutral ENSO winter, snowfall amount ranges were more extreme in the analogue years with some of the snowiest to snow-less seasons included this season. Overall, however snowfall means in the analogue years tended to hug the lower end of the normal ranges.  Southeast Michigan was clearly in the sweet spot for heavy snows in first analogue of 1880-81 (snowiest winter on record) and ironically about 100 years later for #3 snowiest in 1981-82.

    Overall, I look for a wider range of snowfalls this winter across the region. Generally normal (to locally above) snowfalls are possible over the southern sections of Southeast Lower Michigan (generally along and south  I-69); while normal to below normal snowfalls can be expected across the northern areas (more specifics can be found in the analogue section). This would be primarily be a result of storms passing near and to the south of the region. This is a difficult call this early since if the dominant storm tracks were to travel a bit further north, then heaviest snow would also be further north into northern areas. At this time though, recent patterns and analogue data suggest chances are higher to the south and updates will be issued if needed.
    Snowfall should average near to above normal (or near normal to 12"above of the normal) across the south half of the region and normal to 12” below  across the northern sections. Keeping in mind that the range considered in the normal category is 6”+/- of the normal statistical value).

    Broad Scale Discussion


    As we move toward the winter of 2013-14; the near normal or neutral sea surface temperatures /SST/ that dominated the past several seasons are expected to continue  to hold sway over the Pacific waters. A brief recollect; the Neutral ENSO pattern expected this winter is a reflection of near normal Pacific sea surface temperatures. In addition, this will be the second Neutral ENSO winter in a row to play out over the Pacific, a major fact considered in analogue selection.

    Therefore; like last winter, little if any influence is expected from the Pacific via La Nina or El Nino with an overall, Neutral pattern. Therefore the region will be dominated by the phases of the North Atlantic/Arctic Oscillation /NOA, AO/, the Pacific Decadal Oscillation /PDO/, the Pacific and North American /PNA/ pattern and the sub-tropical flow from the southwest and south.


    Neutral ENSO


     Checking out the Pacific water temperatures in Nino 1+2, 3 and 4 (Fig-1a, b), show the  
     regions highlighted (1a) and the stable very weak negative to zero SST anomalies (1b). For
     scientific  purposes, area Nino 3.4 is used to determine officially, whether or not a   
     Neutral  phase  exists.  As one can see, the SST’s in area 3.4 have returned right to the     
     0c anomaly (Fig-1b). Various model projections for the next several seasons are under     
     Fig -1c, all basically being Neutral through the winter.
                                                                                                                        Fig - 1a


                                                                                                                         Fig -1b 


    The latest weekly (11/11/13) SST departures are:
    Niño 4       0.3ºC
    Niño 3.4    0.0ºC
    Niño 3      -0.1ºC
    Niño 1+2  -0.4ºC

    Fig -1c
     

    Patterns of ENSO are shown here for the past century, note where more El Nino's and La Nina's prevailed. Recent data shows were are entering a new La Nina dominated period    ( Fig-2a, 2b)
                                                                                                  Fig-2a


                                            Fig-2b (note pattern is flipped with La Nina on the bottom)


    NAO/AO

    One of the most important ingredients in this winter’s weather (like most others) is the trend of the North Atlantic Oscillation/Arctic Oscillation throughout the winter. Of course, this is the biggest challenge to the forecast and potentially, has the biggest bust potential. While some weather trends with La Ninas and El Ninos are seen (and even these aren’t always consistent), the NAO pattern remains highly elusive and generally, trends are seen only a week or two out. Our colder winters in the study surely reflect a predominately negative NAO/AO. The long term trend of the NAO (Fig-3 a, b), clearly shows the oscillations (long and short term) from positive to negative to positive and just recently, settling toward neutral and negative. Note the negative dominant trend of the 1950s, 60s and 70s seem to be returning.

     Fig 3a


     Fig 3b
    The latest trace of the NAO (Fig-3c) reflects the pattern since July 2013. The summer pattern was basically neutral with the cycles meandering about the 0 line. This allowed a more comfortable, near normal to below temperature summer. Since the summer, the NAO oscillations have been more a neutral  (1,-1) to negative. This trend change has allowed more below normal temperatures to dominate the past month with near normal the past three (see maps below).

                                                                                                                                 Fig - 3c
                                                                                                                                  Fig - 3b
                                                                      Oct 10 - Nov 10, 2013                                               Aug 10 - Nov 10, 2013


    The Pacific Decadal Oscillation

    The Pacific Decadal Oscillation (PDO) (Fig - 4a,b) is the long-term ocean fluctuation of the Pacific Ocean. The PDO waxes and wanes approximately every 20 to 30 years. Most scientists think we have just entered the “cool” phase (see Fig -5, below). The cool phase is characterized by a cool wedge of lower than normal sea-surface heights/ocean temperatures in the eastern Pacific and a warm horseshoe pattern of higher than normal sea-surface heights connecting the north. The last time the PDO trended into the negative phase was in the late 1940s, lasting into the late 1970s. There is evidence that during the cooler phase, La Nina’s tend to be more commonplace and last longer (now, compare the current evolution of the PDO pattern to the likeness of the ENSO, NAO phases resembling those of the 1950s -1970s). It will be interesting to see how close our winter weather patterns of the next few decades resemble those of the 1950s-70s.

                                                                                                                           Fig - 4a  


                                                                                                           Fig - 4b


    The cool water anomaly in Fig-4c shows the dominant effect of La Niña patterns back since 2000. The broader area of cooler than normal water temperatures off the coast of North America from Alaska (top center) to the equator is a classic feature of the cool phase of the Pacific Decadal Oscillation /PDO/ talked about above. The cooler waters wrap in a horseshoe shape around a core of warmer than normal water temperatures. (In the warm phase, the pattern is reversed - Image is courtesy of NASA).

                                                                                               Fig-4c


    The Winter 2013-14 Analogues


    These selected analogue winters below, followed a similar sequence of events (though timing may vary a bit) that were recently observed over the Eastern Pacific during the past several seasons. Neutral conditions prevailed for well over a year from at least the previous autumn, winter, spring, summer and again into the second autumn. All winters were selected upon second Neutral winter conditions for just a home base. After that; previous summer and autumn's temperature and precipitation patterns were examined and compared to this past seasons. Many, many seasons resembled the past six monthly with temperatures normal to below and precipitation normal to wet. Even some years monthly patterns were strikingly similar.  I also included the ongoing solar cycle (sc) at the time of the analogues and compared it to the cycle threshold we are presently in (see bottom of Analogues in Legend).

    As stated in my Autumn 2013 Outlook; this fall's analogues showed a wide range of temperature patterns for September and October with mainly normal conditions pevailing. The real only subtle pattern that materialized were notable cold spells (stronger than average) turning up sometime in October into November. November itself had the best chance to be below normal and an overwhelming number of Novembers were just that...cold.

    November's Foreboding

    In this analogue data set, the Novembers where scrutinized for similarity to our ongoing November,  mainly because of the overwhelming colder than normal winters that followed in the data set and basic curiosity. I was amazed to find out that when temperatures averaged normal to below in eleven of the Novembers (most were below) ALL the following winters were below normal. In the remaining four warmer than normal Novembers, two were again followed by a colder winter (for a total of 13 colder winters) with only the remaining two warmer Novembers  followed by a warmer than normal winter (see more about this under the upper air section below). 

    Though this November's temperature departure is well from being decided at this mid junction, early indications are the temperature departure will range from normal to below. I will have to say though; these cold strong polar highs coming out of Canada so early in the season this November have been impressive!


    Temperatures:

    In one of the strongest below normal signals I've seen in the 17 years of Outlooks; you'd think it'd be a slam dunk but not always. Granted most of the time when a temperature trend was even close to this strong, it turned out to be in the right direction. I can recall a few winters however, where that backfired and the minority ruled. One thing that has me concerned is there were no normal temperature winters in the Detroit sample. The two past trends were cold or mild..no normal or average. More often than not this tells me either a cold trough dominated or very infrequently, a flat ridge (or zonal flow) prevailed. I can't go against a cold signal this strong and dominant nor from what I'm seeing this fall, therefore below normal it is. Best below normal chances would be at Detroit but that's only because of the inflated heat island norms.

    As far as timing, while on the whole all months averaged below normal, scattered about each month's column were a few above normal Decembers, Januaries and Februaries. December had the second best chance for an above normal average after the many below normals prevailing. The Decembers that were on the milder side were followed by some brutally cold Januaries and/or Februaries. There also a strong likelihood of a few mild periods or thaws during the winter given the upper air pattern expected (see in Upper Air/Storm Track section) and the scattering of mild analogue months. Of course, timing will be the issue for milder weather but there is enough of evidence to indicate breaks in the dominant cold. This variance would also be supportive of an amplified upper wind pattern that would be at least, somewhat progressive. 

    Snowfall:

    Now this trend result, the analogues are not so kindly instructive with snowfall amounts ranging from well below normal to well above. In the Detroit sample alone; two of our snowiest winters are matched against several "snow-less"! What to do? Well let's attack this first from what we do see...and that's trend and location.

    First off; The analogues are suggesting a back-end loaded winter as far as snowfall with averages hinting toward an above normal February & March. In fact; there were some hefty snowfalls in some Januaries, Februaries and Marches with even some notable late season snows in April and even May...let's hope not! On the flip side; in many other analogues there were seasons with light to very light amounts of snow. Given this mixed snow amounts picture and averages falling in the normal to below normal category, I'm inclined to go overall normal (locally above) to below snowfalls for the snow season.

    Secondly; Best snowfall averages (highest) this season focuses on the southern sections of the region. This would include areas along and south of 1-69...or mainly from the Flint and Port huron areas south throuh Ann Arbor and Metro Detroit to the Ohio border. See below for estimates...

    Overall, I look for a wider range of snowfalls this winter across the region. Generally normal (to locally above) snowfalls are possible over the southern sections of Southeast Lower Michigan (generally along and south  I-69); while normal to below normal snowfalls can be expected across the northern areas of Southeast Lower Michigan including the Saginaw Valley and areas well away from Lake Huron. This would be primarily a result of prevailing storm tracks passing over and to the south of the region. This is a difficult call since if dominant storm tracks were to travel just a bit further north, then heaviest snow would also be further north into northern areas. At this time though, recent patterns and analogue data suggest heavier snow chances are more to the south and updates will be issued if needed.

    Snowfall should average near to locally above normal (or near the statistical normal to locally 8" above of the normal) across the south half of the region; and widespread normal to 8” below the statistical norm across the northern sections. (Keeping in mind that the range considered in the normal category is 6”+/- of the statistical normal value - located on the bottom of analogue data).


    Upper Air and Resulting Storm Tracks

    After a positive NAO/AO and resultant ridging dominated the eastern half of the country during the Winter of 2011-12 and then again, early in the Winter of 2012-13; there was a distinct change in the upper pattern since mid Winter of 2012-13. A more neutral to negative NAO/AO phase took hold at that time and has prevailed since, resulting in more troughing over the eastern half of North America. I look for this to prevail during the up coming winter which would encourage blocking in the upper air pattern and thus, aid in delivering colder air to the region.

    Using my analogue winters upper air reanalyzed patterns and comparing it to recent trends leaves me with this conclusion; a predominantly neutral to negative NAO/AO for the Winter of 2013-14. In Fig- 5a below, there is little doubt of the prevailing cold upper level trough extending from the Arctic south over the Eastern half of North America

                                                                                                       Fig -5a
     In Fig 5b; here will see the dominant upper air jet streams to be key players in the          upcoming winter based on past and present observations.

                                                                                           Fig -5b                                                       
    It's very interesting to note, that this experimental NOA/AO projection also supports the analogue set for the winter.


     Projected Prevailing Storm Tracks

    First off; lets look at the anomalies (departure from normal) of the upper air patterns averaged out for the analogue winters and see if there are similar patterns noted at the present time. In Fig - 6a, one of the first items noticed is the strong above normal heights extending from western Alaska southwest out over the northern Pacific and over Greenland; both representing dominant upper air high pressure or ridging. The other notable feature is the broad troughing extending from Canada southward into the northern half of U.S.


                                                                                                                          Fig - 6a
     Expected Prevailing Storm Tracks for the Winter of 2013-14

     Three main storm tracks are expected to cross the United Stated this winter.

    -The first in order of precedence is the Alberta Clipper type systems bringing the Arctic     
      air crossing the southern prairie lands of Canada and northern Plains of the US into the   
      Great Lakes and East. 

    -The second in precedence involves several main tracks; The clippers that travel further  
      south into the Midwest and Ohio Valley and intensify over the Mid Atlantic region. The   
      British Columbia/Pacific Northwest impulses that drive south-southeast into the US 
      heartland and Southern Plains (Kansas/Texas Hookers-Panhandle Lows) on there way to
      the Great Lakes. Also; The Pacific Ocean driven impulses which ride over the Rockies and
     also energize Southern Plains low centers.

    -The third storm tracks in order of precedence; the Ohio Valley Low taking shape over 
      Arkansas/southern Missouri and deepening as it moves toward the eastern Great  
      Lakes and finally, the Gulf Low that moves into the Ohio Valley/Lakes or up the East 
      Coast.


    Winter Temperature Analogue Composite Map: Dec - Feb


    Winter Precipitation Analogue Composite Map: Dec - Mar (March included for possible better snowfall representation - especially in normally snowfall regions).


    Look for storm and cold alerts during the winter along with updates and possible changes.


    Making weather fun while we all learn,
    Bill Deedler -SEMI_WeatherHistorian