WeatherHistorian-SeMI

WeatherHistorian-SeMI: Celebrating 29 years - Retired NWS Weather Historian after 37 years, Bill Deedler, continues his thoughts and forecasts on evolving weather patterns and Season Outlooks affecting Southeast Lower Michigan.

Feb 4, 2018

Flaky Winter Thus Far - And I Don't Mean Just The Snowfall - And What About the Rest of the Winter?


Well Punxsutawney Phil brought two messages this Ground Hog Day. First; there will be six more weeks of winter (he must be looking at my Outlook). Second; with the ups and downs in the temperature department this winter, he doesn’t know whether to come out for the spring or scurry back into his warm hut before freezing to death and thus:


Certainly the most notable trend seen (and felt) this Winter of 2017-18 thus far, have been some impressive, but thankfully intermittent Arctic cold outbreaks. The worst of the cold arrived in time for Christmas; accompanied by a snowstorm with the cold persisting right into the the first week of the New Year.

This winter's snowfall across Southeast Lower Michigan hasn't been absent but the associated pattern of storms that produced much of it have been rather mediocre and infrequent, especially in January. There have been almost predominantly clipper-type systems this winter with the moisture rich Gulf helping to create Texas/Arkansas Lows being mainly absent. 

Over Southeast Lower Michigan; areas around and south of I-69 to the Ohio border have received normal to above normal snowfall with the heaviest core extending from the I-69 corridor including Flint, south into the far north and northwest suburbs of Detroit. Strangely enough, areas just a bit further north across the Saginaw Valley have only seen about half the norm.  Earlier projections of above normal snows for the Saginaw Valley doesn't look likely unless that region receives a some good snowfalls into spring.

Best snows fell in December thus far with two notable storms - the 13th and Christmas Eve into Christmas Day. While creating a picturesque Christmas, the resultant snow also created horrible driving conditions for holiday travelers. Finally; even with some rain storms during January thaws, overall precipitation remains clearly below normal across the entire land. 

On the whole, temperature have averaged below normal but that certainly doesn't even begin to reflect the roller-coaster ride they've been on to get there. Want proof ? Just take a drive on many of the local paved roads - the assortment of old and newly eroded crop of potholes will attest to it. This has been an extraordinary pot-hole creating winter with its frequent deep freezes and notable thaws. Just looking at the Local Climatic Data /F6/ from Detroit thus far, displays the up/down roller-coaster pattern well. Days with above normal temperature departures are depicted/shaded in red, while below are in blue. Obviously, up/down departures happen daily but the persistence and magnitude (especially below normal) is what catches ones eye.


PRELIMINARY LOCAL CLIMATOLOGICAL DATA (WS FORM: F-6)

                                          STATION:   DETROIT MI
                                          MONTH:     DECEMBER
                                          YEAR:      2017
                                          LATITUDE:   42 13 N
                                          LONGITUDE:  83 20 W

  TEMPERATURE IN F:       :PCPN:    SNOW:  WIND      :SUNSHINE: SKY     :PK WND
================================================================================
1   2   3   4   5  6A  6B    7    8   9   10  11  12  13   14  15   16   17  18
                                     12Z  AVG MX 2MIN
DY MAX MIN AVG DEP HDD CDD  WTR  SNW DPTH SPD SPD DIR MIN PSBL S-S WX    SPD DR
================================================================================

 1  49  31  40   5  25   0 0.00  0.0    0  3.3 12 250   M    M   5        13 250
 2  50  31  41   6  24   0 0.00  0.0    0  4.2 14 200   M    M   9 1      16 190
 3  55  30  43   9  22   0 0.00  0.0    0  4.5  9 170   M    M   4 18     13 250
 4  56  36  46  12  19   0 0.02  0.0    0 12.5 26 190   M    M  10        33 180
 5  58  30  44  10  21   0 0.02    T    0 23.4 32 240   M    M   9        45 210
 6  41  27  34   1  31   0 0.00  0.0    0 18.5 32 230   M    M   4        40 270
 7  32  25  29  -4  36   0 0.02  0.6    T 12.6 21 240   M    M  10 8      27 250
 8  33  19  26  -6  39   0    T    T    T 13.9 25 210   M    M   4        30 210
 9  30  24  27  -5  38   0 0.10  1.5    T  9.0 18 200   M    M  10 8      23 200
10  30  24  27  -5  38   0    T    T    1 12.3 23 220   M    M   9        27 220
11  31  24  28  -3  37   0 0.27  3.8    4  5.0 14 310   M    M  10 18     20 310
12  32  16  24  -7  41   0 0.01  0.2    4 14.9 29 310   M    M   8 169    36 330
13  26  14  20 -11  45   0 0.42  6.3    4  9.6 21  10   M    M  10 129    27  10
14  21  10  16 -14  49   0 0.01  0.2    9  8.4 16 360   M    M   6 89     19 350
15  28  16  22  -8  43   0 0.01  0.3    7 11.8 24 220   M    M  10        29 240
16  36  21  29  -1  36   0 0.02  0.7    7  9.3 17 220   M    M  10 8      23 220
17  36  21  29   0  36   0 0.00  0.0    6  6.0 12  70   M    M   9 18     15  70
18  41  30  36   7  29   0 0.01  0.0    5 12.5 20 230   M    M  10 18     23 240
19  48  37  43  14  22   0 0.00  0.0    T 15.1 23 240   M    M   6        28 230
20  38  28  33   4  32   0 0.00  0.0    T  6.5 22 300   M    M   5        29 310
21  35  28  32   4  33   0    T  0.0    0  7.5 16  70   M    M  10        22  60
22  36  33  35   7  30   0    T  0.0    0  5.3 15  70   M    M  10 18     20  70
23  37  28  33   5  32   0 0.07  0.7    0  7.9 17 310   M    M   8 1      23 300
24  28  20  24  -4  41   0 0.34  4.4    1  8.0 17 290   M    M  10 1      20 290
25  22  11  17 -11  48   0 0.03  1.0    5 15.8 29 250   M    M   8 189    36 260
26  14   3   9 -18  56   0 0.02  0.7    6  8.1 18 250   M    M   9 19     22 250
27  13  -4   5 -22  60   0 0.00  0.0    5  7.0 16 320   M    M   3 18     19 280
28  14  -3   6 -21  59   0 0.04  1.2    5  3.7  9 170   M    M   7 18     11 170
29  19  10  15 -12  50   0 0.05  0.6    6  9.2 17 250   M    M   9 18     20 230
30  17   4  11 -16  54   0 0.02  0.3    6 11.3 22 290   M    M   7 18     31 280
31  17   2  10 -16  55   0 0.00  0.0    6  5.0 10 300   M    M   6        13 330
================================================================================
SM 1023  626      1181   0  1.48    22.5 302.1          M      245
================================================================================
AV 33.0 20.2                               9.7 FASTEST   M    M   8    MAX(MPH)
                                 MISC ---->  # 32 240               # 45  210
================================================================================
PRELIMINARY LOCAL CLIMATOLOGICAL DATA (WS FORM: F-6)

                                          STATION:   DETROIT MI
                                          MONTH:     JANUARY
                                          YEAR:      2018
                                          LATITUDE:   42 13 N
                                          LONGITUDE:  83 20 W

  TEMPERATURE IN F:       :PCPN:    SNOW:  WIND      :SUNSHINE: SKY     :PK WND
================================================================================
1   2   3   4   5  6A  6B    7    8   9   10  11  12  13   14  15   16   17  18
                                     12Z  AVG MX 2MIN
DY MAX MIN AVG DEP HDD CDD  WTR  SNW DPTH SPD SPD DIR MIN PSBL S-S WX    SPD DR
================================================================================

 1  13  -2   6 -20  59   0    T    T    6  9.2 24 290   M    M   9 18     32 280
 2  13   0   7 -19  58   0    T    T    6 15.3 22 210   M    M   8        26 220
 3  17   0   9 -17  56   0 0.01  0.5    6 13.4 21 220   M    M  10 1      26 220
 4  17   1   9 -17  56   0    T    T    6 10.9 21 300   M    M   6 8      26 330
 5   6  -4   1 -25  64   0 0.00  0.0    6 10.8 23 300   M    M   1 8      29 330
 6  10  -5   3 -23  62   0 0.00  0.0    6  5.5 15 320   M    M   2        20 330
 7  30  -6  12 -14  53   0 0.01  0.2    6 12.3 24 210   M    M   9        31 210
 8  37  29  33   7  32   0 0.24  2.2    8 14.7 22 230   M    M   7 149    28 250
 9  37  25  31   5  34   0 0.00  0.0    6  6.6 13 170   M    M   6 18     16 250
10  46  25  36  10  29   0 0.08    T    6  6.9 16 180   M    M   9 16     19 180
11  57  43  50  24  15   0 0.02  0.0    2 14.6 22 170   M    M  10 1      27 170
12  55  14  35  10  30   0 0.19  0.7    0 17.1 28 360   M    M  10 146    38 360
13  19  11  15 -10  50   0    T    T    1 10.1 26 340   M    M   7        35 330
14  20   8  14 -11  51   0    T    T    1  5.8 17 200   M    M   8        20 160
15  22  15  19  -6  46   0 0.06  1.9    T  7.3 15 140   M    M  10 1      19 130
16  22   7  15 -10  50   0    T  0.2    2 11.1 16 230   M    M  10 18     18 230
17  24   2  13 -12  52   0    T  0.1    2 11.9 24 220   M    M   7 18     31 230
18  28  13  21  -4  44   0 0.00  0.0    2 16.4 21 230   M    M   5        29 230
19  36  21  29   4  36   0 0.00  0.0    1 17.2 29 220   M    M   4        36 220
20  43  31  37  12  28   0 0.00  0.0    1 12.6 24 230   M    M   7        34 230
21  42  33  38  13  27   0    T  0.0    T  2.8 12 180   M    M  10 12     14 170
22  55  38  47  22  18   0 0.40  0.0    0  7.2 22 190   M    M  10 12     26 190
23  47  29  38  13  27   0 0.12  0.0    0 16.2 29 210   M    M  10 13     36 240
24  30  25  28   3  37   0    T    T    0  6.5 17 310   M    M  10 8      22 310
25  35  25  30   5  35   0    T  0.0    0  6.7 16 200   M    M   8 1      19 200
26  53  27  40  15  25   0 0.00  0.0    0 11.6 26 200   M    M   4        32 200
27  50  31  41  16  24   0    T  0.0    0 17.4 30 210   M    M   8        39 220
28  47  27  37  11  28   0 0.00  0.0    0  5.6 17  60   M    M   4        23  50
29  31  18  25  -1  40   0 0.23  3.4    T 12.3 22 360   M    M  10 12     27  10
30  23  13  18  -8  47   0    T    T    3  8.5 15 280   M    M   9         M  M
31  41  22  32   6  33   0 0.00  0.0    3 15.4 31 220   M    M  10        37 220
================================================================================
SM 1006  516      1246   0  1.36     9.2 339.9          M      238
================================================================================
AV 32.5 16.7                              11.0 FASTEST   M    M   8    MAX(MPH)
                                 MISC ---->  # 31 220               # 39  220
==============================================================================

Looking at the analogues the past few months and their predominant temperature and snowfall prognostications below; served us very well thus far this winter. I already blogged about December's actual and projected numbers and performance, therefore let's check January to give an idea how I check performance.

Looking at the top temperature chart (below) we see basically January's actual temperature average mirrored the analogues projections. First off, January's analogue temperature projections were more mixed and evenly divided though; still had a slight biased to colder than average /-1.1/. This was less of a departure than Decembers predominately below normal projections and results. December's prevailing colder than normal numbers and the average is depicted in blue on this chart. On it's performance, I used the below normal average added to the general average of all the 14 Decembers and divided by two to be fairer in using all the set of analogues. This therefore, gives the weighting to the strongest forecast indicators but still accounts for all the data in the analogue temperature forecast.

Since January's set of analogues contained seven below and seven above; I use the usual mean of all those numbers as a comparison number since neither was dominant. The average of all the January analogues came in at 24.5, or -1.1 below the January norm average of  25.6. Outstandingly, this January's average came in nearly identical to that projected number - 24.6!  You will fine the average for all the January temperature years and the January 2018 actual temperature (the white number at the bottom) in the January column.


DETROITTEMPS
P
SEASONDECJANFEBWNT AVEWINTERAO / SCSEASON
1890-9127.328.830.628.91AO+/SC++1890-91
1893-9427.729.923.627.11AO-/SC--1893-94
1898-9926.924.019.823.61.AO-/SC++1898-99
1910-1123.327.428.826.52AOn/SC++1910-11
1917-1821.913.224.519.93AO-/SC--1917-18
1950-5125.427.827.727.02AO-/SC+-1950-51
1955-5627.326.428.127.33AO-/SC--1955-56
1971-7233.323.824.627.24AOn/SC+-1971-72
1975-7629.119.233.327.25AO+/SC++1975-76
1984-8534.02323.4274AO-/SC++1984-85


1999-20
32.024.631.929.52AO+/SC--
1999-20
2000-0119.326.226.724.15AO+/SC--2000-01
2008-0927.417.328.524.46AOn/SC++2008-09
2011-1235.530.732.632.93AO+/SC--2011-12
Ave25.624.527.426.6
26.5Ave
NORM 30Y30.125.628.127.9100YR -26.7Norm
Dep-4.5-1.1-0.7-1.3
-0.2Dep
2017-1826.624.6


DETROITSNOWFAL
SEASONOCTNOVDECJANFEBMARAPR
1890-91T2.511.91.5


27.0
1893-94T2.716.61.4


45.5
1898-99T8.916.04.2


60.2
1910-11T2.320.15.8


50.2
1917-18T0.99.218.6


38.4
1950-510.09.26.515.4


42.2
1955-56T4.84.811.0


45.2
1971-720.04.22.67.9


29.0
1975-7606.519.815.1


55.9
1984-850.04.16.220.9


55.1
1999-200.0T4.39.6


23.7
2000-01T1.325.13.4


39.0
2008-0902.221.425.2


65.7
2011-1200.65.79.3


26.0
AveT3.912.210.7


30y Norm0.11.49.712.5


Dep-0.12.52.5-1.8


2017-18

22.59.29.27


ColorTempsDegrees
RainInches
Snow
Legend:Below1.0>
Below1.00>
Below

Normal0.0-1.0
Normal0.00-1.00
Normal

Above1.0>
Above1.00>
Above


January’s actual snowfall (above) for Detroit /9.2"/ was 1 1/2" below the mean average of all the analogues at 10.7" (and also below the norm of 12.5"). Since snowfall amounts have such a wide potential outcome down to the tenths, I’m more concerned with the trend found rather than the actual number above or below. I check the performance by first waiting for the actual number for the month and then, compare its respective category (above, below, normal) it falls into from the analogue s set. I consider the predominant trend found -in this case below normal- and lean more heavily on that and less at the actual number. If we add all the predominant below normal January snows and divide by the number of below (nine) we get 6.0”; lower than the actual number of 9.2” and quite a bit lower than the actual norm of 12.5”. Therefore; snow or rainfall projections in the analogues are handled mainly as prevailing trends and secondary to the actual number.

Outlook

Well, why this is fine and dandy for the past - what about the future, the rest of the winter into mid spring? On the surface it looks as though analogues, models and even the ground hog all agree on six more weeks winter into mid March anyway.

A quick glance at the analogues pretty much continues the trend with a slight edge /-0.7/ to normal to below normal temperatures (albeit via roller-coaster) through February. Then; a more mixed opinion for March (warmer with nine above) and April (colder with nine below). March's data is extraordinarily wide ranging and speaks volumes for what March is known for: wild with big temperature gyrations! Analogue March temperature ranges(*) from 29.3 to 50.7! Anyone recall that March of 2012 with that exceptionally warm average of 50.7? The transition seasons as I call them (Spring, Autumn) generally a more difficult to peg because of timing issues between Winter and Summer and also associated big temperature fluctuations.

In my original Winter Outlook; I went with a decidedly colder trend for the overall winter with temperatures averaging normal to below (up to 3.0 degrees below). Thus far through January; Detroit is averaging close to 2 1/2 degrees below normal.

Snowfall and rainfall continue the below normal trend (Detroit area) for February in the analogues but with a pick up somewhat in March and April. As noted however; snowfalls for the entire season across Southeast Lower Michigan came in around normal (within 5" of the norm - 43.4") from the metro Detroit area south to Ohio - and above normal from the north/northwest suburbs into Flint and Port Huron. Earlier projections of above normal snows for the Saginaw Valley doesn't look likely unless that region receives a some good snowfalls.

 It must be noted however; though the trend is for below normal snows in the analogues in February for the Detroit area there were some hefty snows as outliers in both February and March. In addition, this season looks to have the appearance of a snowier beginning with a snowier end - occasionally seen with the front/back end loaded winters /U shaped/. The later part of the winter into early spring is notorious for that as more moisture returns to the region from the south. As with all projections besides trends, timing issues can cause problems with overall cold/wet or warm/dry trends overlapping months.

_____       Analogues into Spring 


FEBMARAPR
1890-9130.630.848.3
1893-9423.640.447.6
1898-9919.829.3*45.4
1910-1128.833.750.5
1917-1824.539.644.6
1950-5127.736.546.0
1955-5628.132.445.7
1971-7224.632.644.6
1975-7633.340.450.0
1984-8523.438.451.0
1999-200031.944.048.0
2000-0126.735.151.2
2008-0928.538.749.8
2011-1232.650.7*49.4
AVE27.436.948.0
NORM28.137.249.2
DEP-0.7-0.3-1.2


FEBMARAPRSEA TOT
2.67.90.627.0
14.64.26.045.5
6.524.10.560.2
13.37.51.250.2
4.84.30.638.4
4.46.50.242.2
10.613.30.745.2
9.32.52.529.0
4.97.52.155.9
16.96.10.955.1
8.11.10.623.7
2.95.40.939.0
8.51.07.465.7
10.20.2T26.0
8.46.54.043.4
10.46.91.742.3
-1.4-0.10.10.7
7


_______Computer projections for the remainder of winter into spring.


Note the resilient prevailing blocking pattern set up for February. Impressive troughing appears to be reloading over eastern Canada and occasionally pushing well south into the eastern US. 


____________CFS Model Projections 

Current CFS model projects a colder and drier February (total precipitation, not necessarily snowfall).


March (below) holds on to normal to below for temperatures while precipitation is normal to above. The last two maps reflect the three month temperature period and prevailing upper air pattern. The huge trough over eastern Canada meanders further east with time.


 Making weather fun while we all learn,
Bill Deedler -SEMI_WeatherHistorian

Posted by WeatherHistorian_SeMI at 3:38 PM No comments:
Email ThisBlogThis!Share to XShare to FacebookShare to Pinterest

Jan 20, 2018

"A GREAT STORM IS UPON MICHIGAN" THE GREAT BLIZZARD OF 1978 - 40TH ANNIVERSARY!

"A GREAT STORM IS UPON MICHIGAN"
THE GREAT BLIZZARD OF 1978!

Written by: William R. Deedler, Weather Historian - Southeast Lower MI

While I worked countless snowstorms in my long career with the NWS; the two most impressive storms were in order: the January 26-27, 1978 Blizzard and the December 1st, 1974 snowstorm. The huge snowstorm of December 1974 was quite noteworthy in the amount of snow that fell continuously for hours over the Detroit Metro area and portions of Southeast Lower Michigan.

A more powerful (in terms of intensity/extent) storm and remains of strong interest to all meteorologists who have studied winter storms in the Great Lakes is the January 1978 Blizzard. This storm is also of interest and remembrance to many longtime residents of the Great Lakes, the Upper Ohio Valley and Ontario, Canada who had to deal with winter's full fury late in January of 1978. In addition, the storm certainly casts many memories for those of us (author included) who were on duty and worked during the storm while observing in tremendous awe the development and subsequent immense strength of this great monster. With the 40th anniversary of this Great Blizzard at hand, it is worth taking a step back in time to re-live this monumental example of nature's fury.

While there are several contenders for the worst blizzard ever to hit the Great Lakes in relatively modern times (since 1870 when records began in Detroit), the immense and intense Blizzard of January 26-27th 1978 must rank at or near the top along with the Great White Hurricane of 1913 with its similar track and powerfulness.

The incredible Blizzard of January 26-27th, 1978 evolved out of a winter that was infamous for cold and storms. The Winter of 1977-78 thus far had been one the coldest, since records began, in many areas from the Rockies eastward to the Appalachians. Mammoth blizzards occurred late in January and early February from the Midwest to the East Coast as strong Arctic plunges dove south into the country and met up with the warmer winds from the deep south. The winter of 1977-78 was similar to its predecessor (1976-77) in terms of cold. The main difference between the two winters, however, came in February. In 1977, temperatures moderated rapidly during February, while in 1978, the cold actually worsened - with several locations reporting their coldest recorded February to date. The Winter of 1977-78 is written down in the record books as Detroit's seventh coldest winter, Flint's fifth coldest and Saginaw's sixth. West of the Rockies, it was a different story as a dominant upper ridge of high pressure provided a relatively mild winter, with some stations even reporting one of their warmest winters on record.

The Great Storm

Since there were some forecasting variances of the intensity and track of the storm, and considering the primitive model of the day (LFM - Limited Fine Mesh), forecasters did an admirable job in forecasting one of the most severe winter storms ever to hit the Great Lakes Region.

A Winter Storm Watch was posted as early as Tuesday night, the 24th, for the southern half of the Lower Peninsula for Wednesday Night into Thursday. Gale Warnings for the Great Lakes were hoisted the following Wednesday morning, along with the Watch. A weaker system had moved through the region earlier during the day on Tuesday and already dropped some snow on the region (a Winter Storm Watch had been issued for this system as well, earlier on Monday, the 23rd). After Tuesday's snow, the headline on the Special Weather Statement that was issued by the NWS Tuesday evening read as follows: "Another Winter Storm Threatens Lower Michigan" and thus, a second Winter Storm Watch was officially posted.

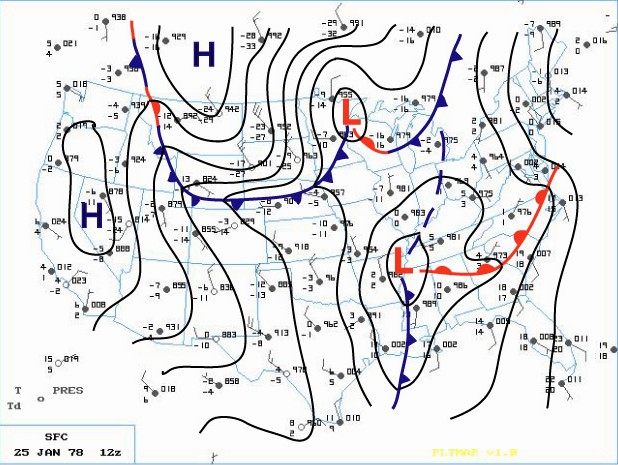
Meanwhile, the ingredients of what would later prove to be a truly fascinating yet vicious winter storm were coming together from different parts of the country. As with the "White Hurricane of 1913," the massive storm actually began as two smaller but distinct storms. A strong low pressure with an attending arctic air mass was entering the Northern Plains by way of Northern Minnesota on Tuesday evening (24th). At the same time, another developing low pressure system was taking shape over the eastern Texas/Louisiana area.

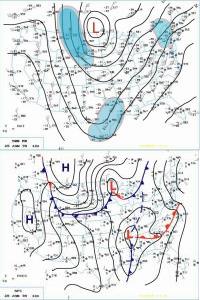
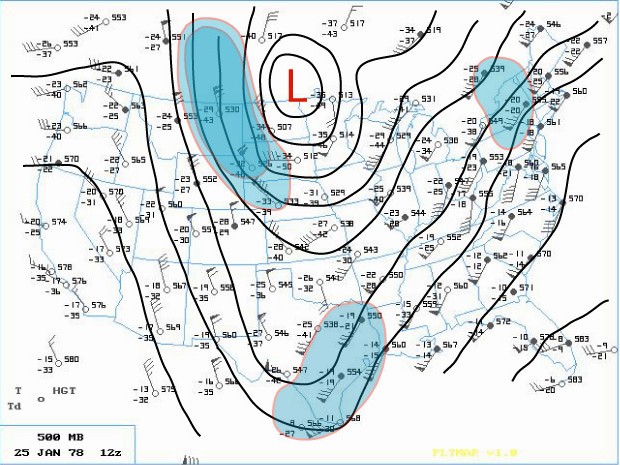
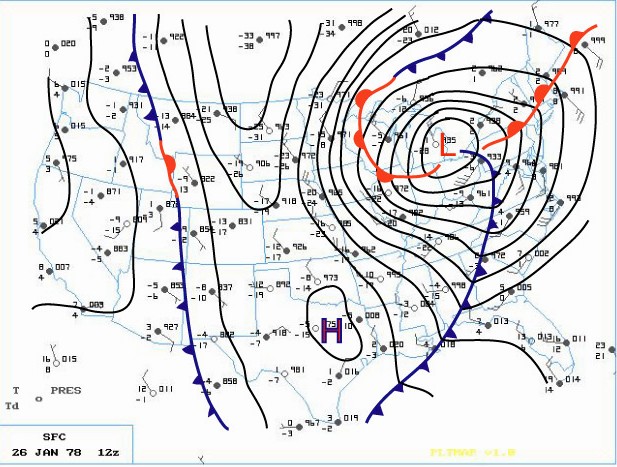
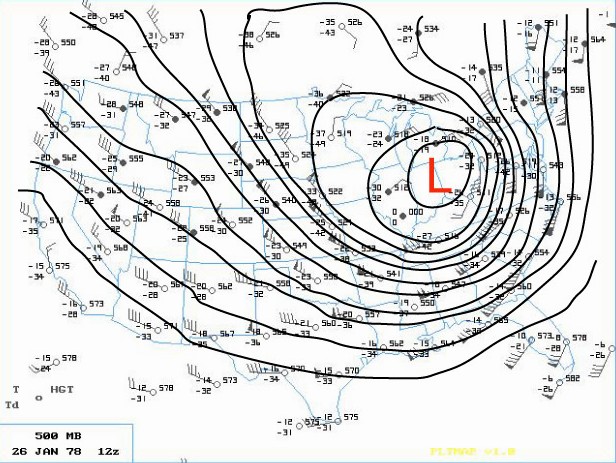
The phasing of two distinct jet streams aloft proved to be the key as to the subsequent strength and massive extent of the storm. A very strong and energetic Arctic impulse surged almost due south and plowed the Arctic front through the Northern Plains late on the 24th. At the same time, another very strong upper wind impulse surged south through southern Arizona. These two jet streaks made up the larger North American jet stream as a huge upper ridge of high pressure along the West Coast of the U.S. diverted the powerful Pacific Jet north into Northern Canada. This northern jet (containing a wind max of 110 knots) then dove due south, like on a giant roller coaster, across the western U.S. as the second, subtropical jet (with an even stronger wind max of 130 knots) surged across southwestern states. On Wednesday (25th), a deepening area of low pressure made its way east across the Gulf States into Georgia by evening (surface | 500mb). Meanwhile, across the north, the Arctic front barreled east across the Upper Midwest into the Western Lakes by Wednesday evening.
Earlier that Wednesday morning, the Winter Storm Watch for Southeast Lower Michigan was changed to a Heavy Snow Warning, while a Travelers Advisory was issued for Western and Northern Lower Peninsula. Later, at the issuance of the evening forecast, the entire Lower Peninsula was upgraded to a Heavy Snow Warning. Meanwhile, a rapid deepening of the surface low over the southeast portion of the country also commenced on Wednesday evening. As the low intensified over Alabama and Georgia, Atlanta registered its lowest barometric pressure ever late on the 25th. At the same time, further north in Michigan, snow was falling over much of the Lower Peninsula. In and around the Ann Arbor and Metro Detroit, the snow mixed with or changed to light rain Wednesday night as slightly warmer air surged northwest into that area ahead of the deepening storm.

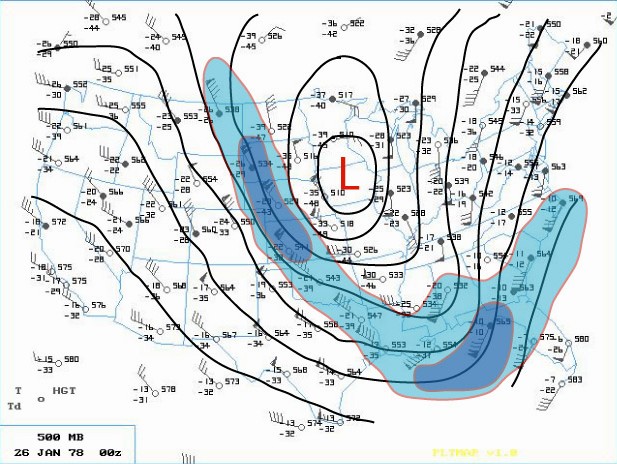
While the storm was organizing in the lower levels of the atmosphere over Georgia, the Subtropical and Arctic jet aloft began to merge and phase over the Southeast part of the country. This merging of jet streaks contained a wind max of 150 knots which helped induce a rapid intensification of the Georgia Low as it surged northward into West Virginia early on the 26th. Record low barometric pressures were set all along its path as an ominous track (trough) began to materialize toward the Eastern Great Lakes.

Bands of heavier snow spread north into much of Southern Lower Michigan during the very early morning hours of the 26th. Rain continued to fall, however, over the extreme southeast corner of Lower Michigan. At 1 AM EST, rain was observed at Detroit Metro Airport with the temperature comfortably above freezing at 36 degrees. Further north at Flint, however, sleet and freezing rain were falling as the temperature hovered around freezing. Air pressure tendencies were noted as falling rapidly /PRESFR/ and continued that way for several hours (in fact, several stations in this storms path had to re-adjust their barographs for station pressures traces that were BELOW initial chart scale).

The aforementioned Arctic cold front that was across the Western Great Lakes advanced steadily east into Lower Michigan as the main southern low underwent explosive deepening (this low's central pressure fell 40 millibars in 24 hours)! The central pressure was recorded at 28.28 inches as it tracked north across eastern Ohio, just west of Cleveland, at 7AM EST. As the low moved out over Lake Erie, the Arctic cold front over Southeast Lower Michigan was pulled sharply east into it's mammoth cyclonic circulation. Any residual rain over Southeast Lower Michigan quickly changed to heavy snow and blowing snow during the pre-dawn hours of the 26th. As the Arctic front plowed through the Cleveland area, the wind gusted to an incredible 82 mph! As the Arctic air flooded the Cleveland area, the temperature dropped from a relatively balmy 44 degrees at 4AM EST to a bitterly cold 7 degrees by 1000 AM EST.

Blizzard Warnings were hoisted across much of the Great Lakes and Upper Ohio Valley Region by daybreak Thursday. The center of the huge storm (surface | 500mb) continued to trek north northwest across Southwest Ontario (roughly between Chatham and London) while Detroit measured its lowest pressure reading at 28.34 inches at 650 AM EST. The incredibly deep center made its way north along the St. Clair River with Sarnia ON reporting the lowest pressure on land at 28.21 inches. Not only was the depth of this mammoth storm's center very impressive, so too was the extent of low pressure from its center. Even locations that were far removed from the storm's center also reported record low pressures. Stations such as Cincinnati OH, Rochester NY and Toronto ON and even as far east as Wilmington N.C., all recorded record low pressure readings from this monster. In fact, at Toronto, where records go back as far back as 1840, the lowest pressure reading of 28.40 inches broke the old record of 28.57 inches by 0.17 inches. In addition, dozens of other cities, with records going back a century, also recorded their lowest pressure reading of all time or, for at least the month of January. This massively intense storm was responsible for strong wind gusts as far away from the center as Boston /72 MPH/ and Chesapeake Bay Bridge /90 MPH/ with even damaging winds reported as far south as Tallahassee FL.

As the Arctic air circulated throughout the storm while it made its way over Lake Huron, the lowest pressure was reached around 950 millibars or a hurricane-like 28.05 inches! "A Great Storm is Upon Michigan" read the headline of the 800 AM EST Special Weather Statement issued by the National Weather Service Forecast Office in Ann Arbor that Thursday /26th/ morning. Heavy snow and blizzard conditions were extensive as wind gusts in excess of 35 mph whipped the snow into huge drifts across much of Southeast Lower Michigan. Other areas of Eastern Michigan, Indiana and Ohio reported near hurricane-force winds, heavy snow and temperatures hovering between zero and 10 above, resulting in extreme blizzard conditions. These conditions later expanded further east into Pennsylvania and West Virginia and prevailed into the night (26-27th) across much of the Eastern Great Lakes, Southern Ontario and the Upper Ohio Valley. With the storm generating copious amounts of snow and very strong winds, whiteout conditions were widespread. All land and air traffic came to a stand still in the affected regions. Several major roads were closed for at least two to three days, if not longer, while clean up got underway. Numerous NWS employees were stranded at work, home, or on the road somewhere between the two. Several employees worked double shifts into at least Friday (some longer) because of the impassable roads with others simply unable to get to work.

The Blizzard Warnings were allowed to die across Michigan during the forenoon hours of Friday, the 27th. Record 24 hour snowfall totals from the storm included, 16.1 inches at Grand Rapids, 15.4 inches at Houghton Lake and 12.2 at Dayton, OH. Snowfalls for the entire storm (25-27th) included a whopping 30.0 inches at Muskegon (some of which was Lake Michigan enhanced), 19.3 inches at Lansing and 19.2 at Grand Rapids. Snowfalls were less over Southeast Lower Michigan (mainly because of the rain that fell for a period) and included 9.9 inches at Flint and 8.2 inches at Detroit.

The following is a quote from the summary written about the storm by Meteorologist in Charge, C.R. Snider on January 30th, 1978 at the National Weather Service Ann Arbor:
"The most extensive and very nearly the most severe blizzard in Michigan history raged throughout Thursday January 26, 1978 and into part of Friday January 27. About 20 people died as a direct or indirect result of the storm, most due to heart attacks or traffic accidents. At least one person died of exposure in a stranded automobile. Many were hospitalized for exposure, mostly from homes that lost power and heat. About 100,000 cars were abandoned on Michigan highways, most of them in the southeast part of the state."
The employees of the National Weather Service Forecast Office in Ann Arbor had just set up shop at the new quarters at the Ann Arbor Federal Building a WEEK before the storm hit. The forecast staff had transferred from the Detroit Metropolitan Airport Office while the observing and radar staff remained at the airport. The majority of employees still lived in and around the metro Detroit area and all major roads between Detroit and Ann Arbor were blocked for approximately 18 hours due to the storm. Several employees put forth efforts beyond the call of duty, stated Mr. Snider in his storm report.

Yet, as mentioned earlier, the Winter was not yet over by any means as the month of February (after the storm) was brutally cold across much of country. The below normal temperature departures of February 1978 were strikingly similar to that of January 1978 (and in some places, February was actually colder). The average temperature for Detroit that winter came in at just 20.5 degrees /normal 27.1/ which again, made it the seventh coldest winter on record. Snowfall totaled a hefty 61.7 inches which made the winter of 1977-78 the ninth snowiest winter on record at Detroit. Flint's average temperature of 19.1 degrees made it the fifth coldest winter on record, but Flint received less snow than Detroit with 50.6 inches. Saginaw's winter average temperature of 17.9 degrees made it the sixth coldest winter on record and was accompanied by 55.6 inches of snow. The 1977-78 snow season at both Flint and Saginaw has since dropped off the top 20 snowiest winters list.

More on the storm in surrounding areas can be found here.

https://www.ncdc.noaa.gov/news/using-regional-snowfall-index-evaluate-great-blizzard-1978
http://www.mlive.com/news/grand-rapids/index.ssf/2017/01/surreal_snow_scenes_from_the_b.html

https://www.youtube.com/watch?v=YuAMWRtT4NY
http://nbc4i.com/2017/01/25/remembering-the-blizzard-of-1978/


Making weather fun while we all learn,
Bill Deedler -SEMI_WeatherHistorian


Posted by WeatherHistorian_SeMI at 3:26 PM 2 comments:
Email ThisBlogThis!Share to XShare to FacebookShare to Pinterest

Jan 14, 2018

A Brief Comparison of Model Performance for Storm Projected Sunday Jan 21st 2018

After my last post on model projections and some wild posts on the internet; I thought it would be interesting to post three model solutions - the /American/GFS, European/ECMWF and the Canadian/GEM each day of the 00Z model projections for the same time period; 00z 01/22/18  (Jan 21st, 2018 Sunday 7PM). Obviously then; model projections will likely change (less hopefully as the time period grows closer) at each successive 00z model run as I post the 500MB position along with the surface for 00z 01/22/18.

All models are projecting some storm with a variety of solutions for the exact time period. Again; the main concern here will be the map projections of the 500 MB jet and associated storm at each day interval for the next week for the time period; 00z 01/22/18. The maps will be from the 00z map projections of all three models with brief comments will be made throughout.


DAY 1; 8 days out (00z - 01/14/18 model run; Sat Jan 13 7PM)

As you note; the postings will be GFS, ECMWF & CMC

1-The GFS has the main low over Northern Indiana, The Euro over Arkansas while the Canadian has placed it over extreme Northern Lower Michigan.

 DAY 2; 7 days out (00z - 01/15/18 model run; Sun Jan 14 7PM)

General trend is slower (this continues on today's 12z also) with storm while high to the NE becoming stronger & more prevalent on most model trends. The Euro has joined the general trend with main low now further north while the GEM is the fastest with the low up in the NW Lakes.
DAY 3; 6 days out (00z - 01/16/18 model run; Mon Jan 15 7PM)

The GFS has basically held the low over E-SE Iowa while weakening it from 993 to 998 MB as the Euro actually backtracked the low to SE Nebraska/NE Kansas and also weakened the low from 990 to 996 MB. GEM has also backtracked the most dropping the low from Northern Wisconsin down to NE Missouri as pressure weakened from 995 to 1002 MB. In actual fairness, it actually elongated the low from Wisconsin down into Missouri with the center in NE Missouri and is similar in position to the GFS.
 DAY4; 5 days out (00z - 01/16/18 model run; Tue Jan 16 7PM)

Interesting how the models subtly shift the low, sometimes similar to the former time-period of another model the day before. All focus has come around to the from the Central Plains/Western Midwest. While the GFS focuses on the Iowa/Missouri area, the Euro remains the furthest sw over E Kansas and the GEM is furthest NW in NW Iowa/NE Nebraska. The GFS hangs on to a 998 MB low intensity while the Euro weakens the low from 996 MB to 1001 MB and the GEM reverses that: deepens the low back to 997 from 1002 MB.

DAY 5; 4 days out (00z - 01/16/18 model run; Wed Jan 16 7PM) and GIF for the the 5 days

Since all models have converged on a Central Plains/West Midwest position and not affect SE Michigan with warm air advection snow; I've decided to end the comparison project with a GIF for each model for the 5 Days running up until 00z Thu, Wed Jan 16, 7PM.


It's very interesting to note the GFS/American model appears to have the least variance for position of the low for the same forecast hour (22/00z Jan 21, 7PM Sun) especially after Day-1. The Euro/ECMWF comes in second while the GEM was all over the place and most variant. However; it must be mentioned that the GIF cycle of the GFS contains all runs (00z,06z,12z,18z) and not just the 00z, while the Euro and Gem contain the 00z and 12z. Therefore, the GFS has the most GIF positions which can be confusing. Comparing just the 00z daily runs of all three models is the best and fairest way to look at it....which was done above for 5 days. Of course, the final analysis won't be available until the Mon, 00z when the initial run for Jan 22, 2018 is done and posted.


Posted by WeatherHistorian_SeMI at 3:15 PM No comments:
Email ThisBlogThis!Share to XShare to FacebookShare to Pinterest

Jan 10, 2018

Winter Storm Brewing - But for Who - Now THAT is the question?

Latest plausible indications continue to push a strong cold front through Southeast Lower Michigan slowly overnight Thursday into Friday morning. Rain with become mixed with/and changes to sleet and then over to snow as the atmosphere column thickens with the colder, snow supporting air. At this time; the front will slide east and southeast as a developing low pressure and storm rides north northeast along the front pushing heavy snow and mixed precipitation through the Ohio Valley and on into the Northeast. In the colder air behind the front over Southeast Lower Michigan; up to a couple of inches are possible on Friday.

Beside the upper air support for the low pressure and storm, it must be noted the High pressure pushing southeast into the northern plains will exude a strong push of Arctic air, once again, southeast into the country. This too will aid in pushing the storm out to the east-northeast. I drew a dotted line as of this writing the snow still could push along that "buffer-zone" if the storm develops faster, high weaker or upper air isn't sampled well enough but the above scenario seems most likely.

Now here's the caveat: model sampling of the atmosphere from upper air, satellite and radar is still not complete as the energy and subsequent phasing is still ongoing. Yes, things can change but again at this time the above seems the most plausible. If dramatic changes evolve from better model sampling and data, I'll surely update.


Finally:
Let me just say; again with some models predicting an Armageddon snowstorm for the Ohio Valley and at times extending into the Southern Lakes, I've stayed out of it with nothing written on it. The crap put on various web-sites pumping an almost certainty fictitious amount of snow for some areas was ridiculous! Those posting 2 or even near 3 foot snowfalls across portions of Southern Michigan into the northern Ohio Valley; especially when many records for 100+ years would be shattered is complete disregard to the general public. I'm not talking about various weather forums that are a mix of all interests...these extreme model solutions hopefully stay with those members, who generally know the "problems" with model output.

Every time there is a hint of a "big" storm, several of these snowstorm enthusiast (spelled N.U.T) start posting the most extreme solutions. Several have questionable educational backgrounds - if any in meteorology - and never even worked in the weather field. And, this happens EVERY winter with the advent of the internet. I can't tell you how many times before and after I retired from the NWS, I was asked: "I heard we are getting this "huge amount of snow" is it true, what do you guys say - and it really has blossomed the past 10 years.

Model forecasting has improved phenomenally in the past 20 years, especially the past 10 but they still get it wrong as all forecasters do. Sometimes during a season, one or two models will have the inside track for accurate forecasting that particular winter - and days out - only to lose it off at times.

I've certainly gotten it wrong on individual events and my Outlooks, nobody is infallible but I try to be reasonable and write various articles and blogs the most objective and limit, to use the in-vogue vernacular -  "Fake News".  Many times when something I forecast is wrong or out of bounds with what happen, I do talk about what went wrong and I wish more would do that because I try to...

Make weather fun while we ALL learn,
Bill Deedler - SEMI_WeatherHistorian
Posted by WeatherHistorian_SeMI at 1:59 PM 2 comments:
Email ThisBlogThis!Share to XShare to FacebookShare to Pinterest

Jan 9, 2018

Early Winter Unfolding Along With Prevalent Analogue Pattern Seen

Officially, we've only been into winter a little better than a month and the cold season /Nov -Mar/ two months. There still is, by historical terms, plenty of winter left - and looking keeping on eye on the hemispheric meteorological patterns and the other on the Winter 2017-18 Outlook issued back in November, can attest to that. After a brutal introduction to 2018 with a continuation of bitter cold temperatures and wind chills; we managed to squeak out a record number of days with temperatures below 20 - twelve days at Detroit and Flint. The old record for Detroit was eleven and was set twice back in 1936 /Jan 23-Feb 2/ and 1979 /Feb 8-Jan 18/. The below 20 streak was tied at Flint with 12 which tied with Feb 8-19 1979. Saginaw did not hold below 20 the entire streak, hitting 21 on the 2nd and thus messed up the record there. More on the cold streak can be found here.

The dominant analogue winters for December were a good predictor for this December in all temperature projections and two out of three snowfalls calling for cold and snowy. Saginaw;'s snowfall came up lower than the higher December snowfall winters but still appreciably above the average.

What is most striking is how close the temperature averages from the analogues for December came  to the actual December 2017 numbers, at all three sites using the colder winter averages added to all the winter averages and dividing by two. I used both numbers; the average of all the analogue Decembers and add that to DOMINANT trend (below normal or coldest Decembers) to get a fair projection for the actual month (see below) which is reflective of the Winter Outlook.

Detroit's temperature analogue data contained a whopping 10 out of 14 below normal Decembers. The average for those 10 winter's came in at 25.6. Even the December temperature average for all 14 winter's came in notably below normal at 27.9 /norm 30.1/. Adding the averages of the coldest December winters and then all the Decembers gives an average of  the two /25.6 + 27.9/ of 26.7. The actual temperature average for December 2017 ironically fell between the two average data projections with the actual 26.6 - just one tenth lower than the average of the two. I'd say the December projection for temperatures was very telling and fits nicely into the other dominant 10 winters (71% of the analogue sample)!

Snowfall projections for December at Detroit were also telling with the dominant analogue December snowfalls having an average of the 7 winters at 18.7". The extremes for December snowfall due to the storm track establishing itself was problematic in the outlook from the start with the range being from 4.3" to 25.1"! However, the pattern of dominant snowfalls (7 out of 14; 50% and 1 December being in the normal range and 6 below normal) did revel itself in the study as likely a snowy December. Actually out of the 7 snowy Decembers, there were 4 where that snowfall averaged around 20" or more...a fairly strong showing in itself and right up there with the 22.5" recorded this past December. That 4 out 8 very snowy winters showed that when there was a snowy December; there was a 50% chance that it would be at least more than double the normal amount /9.7/.

All in all; stepping back to all the dominant; prevailing Decembers in the study for Detroit showed an average temperature of 25.6 degrees with 18.7" of snow...and this past December verified the prevailing pattern.


                                 Detroit Analogue Breakdown For December


Likewise; Flint's average for the all the sample analogue December temperatures came in at 25.4; 1.6 degree below the 27.4 normal. Using the dominant 7 (out of 12) coldest Decembers at Flint gave a projection of 21.6; this compares to Flint's actual December 2017 average of 22.6. Then again; adding both the 25.4 for all of Decembers analogues to the coldest December analogues at 21.6; gives an average of 23.5 Flint's actual temperature came in between the two at 22.6.

Flint's actual heavy snowfall in December followed right along with the heaviest snowfalls in the study. Using the snowiest but not dominant snowfall trends in the analogues finds: the largest snowfalls projected 28.5" out of three very snowy Decembers and well above the normal of 11.8". Flints projected snowfalls in the analogues were much more variable than even Detroit's in December; partly due to the variable placement of the storm track that sets up. It was noted on the Winter Outlook analogue chart that Flint's snowfall for 1910 -11 was highly suspect since both Detroit and Saginaw measured considerable higher amounts (20.1" and 17.4" respectively) as compared to Flints 11.5" so it was not used. Flint's December 2017 snowfall totaled at 23.5" more than double the norm /11.8"/ and almost double the analogue average at 12.8". There is a huge gap between the analogue average and analogue snowiest Decembers in Flint; ranging from 12.8" to 28.5". Looking at the average between the two (12.8" to 28.5") gives 20.6" and not far off the actual total. Even wider were the analogue December snowfalls all together: from 4.4" to 35.3"! Predicting the December 2017 snowfall for Flint was difficult to say the least but still landed in the heaviest snowfall categories like Detroit.

Up at Saginaw gives the following results; the average December temperature for the analogues came in at 25.5; while the average for the below normal or coldest Decembers came in at 21.6. Using the average of the two numbers leads us to the exact number Saginaw recorded in December 2017 - 23.5! Snowfall at Saginaw was the only lacker in the group. The actual snowfall for December did come in above normal with 13.2" /norm 9.0"/ and close to all the December analogue snowfall average at 14.7". But the snowiest Decembers average number was quite a bit higher at 22.1" This was highly skewed by two Decembers with around 40" not unlike Flint.


The overall precipitation thus far this winter has been lacking however with about half of the normal (1.49", -1.33") falling through January 6th. In Detroit's study there were 3 drier than normal winters, 3 wetter than normal and a dominant 8 normal precipitation winters. If we are to have a normal precipitation winter in alignment with the prevailing winters in the study, we're gonna have to step up the precipitation - and recent models indicate as much. While on the subject of future weather; latest indications are that January will make up some of that below normal departure with more moderate to even milder weather at times between long cold spells. This short thaw ongoing is more than welcome for most after temperatures averaged 20 degrees below normal at around 6 at Detroit through the 6th. The first week or so is reflected in the departure map below...

One of the other notable pattern trends of the analogues was the more than average roller-coaster temperature pattern, reflecting the amplified and variable jet. This pattern occasionally locked into the prevailing pattern - cold - but with relief from the cold breaks throughout the winter and early spring. Thus far; there are several analogue years being tagged as similar in our winter pattern thus far with a few very similar.

Next Up: Winter Storm Brewing - But for Who?

After Mid Month - Part Two: A Mid Winter Update - What Do the Best Performing Analogue Winters Thus Far Suggest About the Rest of the Winter and Cold Season?

Making weather fun while we all learn,
Bill Deedler - SEMI_WeatherHistorian


Posted by WeatherHistorian_SeMI at 5:49 PM No comments:
Email ThisBlogThis!Share to XShare to FacebookShare to Pinterest

Dec 20, 2017

The Whitest of Christmases and Other Christmases Past

The Whitest of Christmases and Other Christmases Past 
 
By: William R Deedler; Southeast Michigan Weather Historian
Date: 12PM Wednesday Dec 20th, 2017
 

Frequently during the Christmas Season, meteorologists are asked; Are we going to have white Christmas?  Generally, it is agreed among meteorologists that in order to "officially" have a white Christmas, an average of an inch of snow must cover the ground, but not necessarily have to fall on Christmas. 

At this time /20th/, warmer temperatures and light rain have really did a number on our heavy snow-cover received just last week. Many areas have fallen to just a trace to a few inches. Moderate temperatures the next few days before the straight-out colder weather due Christmas weekend, will continue to slowly eat away at any remaining snow. A system moving across Friday into Saturday may bring some light rain and snow before the cold surges in and then; some light snow and snow showers may fall Christmas eve or Christmas day.  At stage; the likelihood of a white Christmas is questionable even with just the inch of snow necessary to meet the requirement by Christmas morning. Also; as Christmas approaches, early indications very cold air is slated to engulf Southeast Lower Michigan with temperatures estimated to falling into the teens that day.

*Update -  A weak low pressure will move across the southern Great Lakes and northern Ohio Valley and slowly develop over the eastern Lakes into the Northeast. This system will bring mainly light snow to much of Southeast Lower Michigan Christmas Eve and snow showers on Christmas Day along with colder blustery winds. This will provide a white Christmas to the region with generally 2-4" through Christmas. Merry White Christmas!

Over the years, extreme Southeast Lower Michigan has averaged about a 50 percent chance for a white Christmas.  Some years it's already on the ground, some years not, some years it melts while other years it falls on the day. However, theoretically, you could actually have nothing on the ground Christmas morning and have a snowstorm dump a foot on the region during the day and still have NO official white Christmas under the standing morning rule. It works the other way too; you could have a several inches on the ground at 7am 12/25 but warmer air and/or rain melts it away by afternoon or evening and still officially have a white Christmas.

Even with mild weather with temperatures in the 30s; Southeast Lower Michigan was able to hold on to a white Christmas even with last year's moderate temperatures as the snow (generally 2-5") slowly melted. In fact; the day after Christmas, warm air surged into the region and pushed temperatures into mainly the 50s and took care of any remaining snow! Back in December /2015/; it was a mild and snowless Christmas with a high temperatures near 50. Of course, the year before, /2014/ contained our record breaking warm El Nino December, therefore the hopes for a white Christmas were low anyway. Back on Christmas 2014, the chances for a white Christmas were very similar to 2015 with record setting low amounts of snow for the month (in the top 5 snowless). Officially on 12/25/14 at 7am; no snow was on the ground with a trace of light rain on the date. Only a TRACE of snow had fallen up to that day in December /0.1 for the entire month/.  Most areas over the remainder of Southeast Lower Michigan had a few tenths of snow Christmas eve or Christmas but with less than the amount needed and mild temperatures rising into the upper 30s to around 40...none of the area saw a white Christmas. 

Previous recent Christmases:

In 2013;  even with all the snowfall throughout last winter, officially on 12/25/13 at 7am Detroit Metro Airport had only a TRACE of snow on the ground. Most areas into the remainder of Southeast Lower Michigan had some residual snow and ice on the ground for a white Christmas. Back in 2012, enough snow did fall at Detroit Metro Arpt (an inch of fresh snow Christmas Eve) to make it an official white Christmas was on the ground as of 7AM. The necessary inch or more was also on the ground at both Flint and Saginaw. Ironically the day after Christmas, the best snowstorm of the winter season hit the region...a day late and several inches short for Christmas. A year earlier in 2011, it was a relatively mild Christmas with temperatures in the 40s and no snow on the ground; so no white Christmas. However back in 2010; residents across Southeast Lower Michigan did enjoy a white Christmas with generally 1” to 6” of snow across as temperatures hovered in the 20s. Then further back in 2009, much of the Detroit area south did not have a white Christmas but points north across Flint, Saginaw and the thumb region generally had a 1” to 3” snow cover. Back in 2008, we saw a “sloppy, melting white” Christmas. That white Christmas involved the melting of a heavy snow cover from past snows that accumulated throughout December. The best of the snowstorms came before Christmas on the 19th (with another, lesser intense snow falling on the doorstep of Christmas, 23rd -24th). After, however, the heavy snow cover melted in earnest as milder air overspread the region Christmas Eve right through the 26th. Christmas of 2007, saw temperatures rise into the mid 40s to mid 50s a couple of days prior to Christmas and that, combined with light rain, pretty much took care of any hopes for a white Christmas as then, like the later Christmas of 2008, the  previous heavy snow cover melted (but this time in its entirety before Christmas). Some scattered light snow did return, skirting the landscape on Christmas Eve but most areas around Southeast Lower Michigan still only had a trace of snow for Christmas. At White Lake and Saginaw, however, the official inch of snow to make it a white Christmas was barely attained in 2007.

Going back further to the Christmas of 2006; it was also mild and therefore, there was no white Christmas. In 2005, we just barely squeaked out a white Christmas (at Detroit Metro Airport, anyway) as a mild spell moved in just before Christmas along with rain, melting the snow down from 4” to 1” by Christmas morning. Originally, there had been 8” of snow on the ground on the 15th. The last really scenic (no slop)  with fresh white snow for Christmas occurred in 2004. A snowstorm brought heavy snow (ranging from 8”at Detroit to around 4” in Saginaw and Flint) on the 23rd, which left the region with a nice white cover for Christmas. It was also a cold Christmas also with highs only in the teens and overnight lows below zero. 


Looking over historical weather records of Christmases past since 1900, a wide range of weather conditions were found. While most people would like to believe that Christmas in the Detroit area should be snowy-white and picturesque, more often than not, they're not. Over the past 117 (including 1900) Christmases in Detroit, 55 (47%) have been what would be called "white" with an inch or better of snow on the ground. Keep in mind however, these records are for Detroit; farther north in Flint, the chance of a white Christmas jumps to 56 percent, while in Saginaw and the Thumb region it rises to 61 percent.

Based on the Detroit records, the Santa award for the "whitest" (most snow on the ground) and also the second snowiest Christmas (snow falling on Christmas) goes to the Christmas of 1951! Just over a foot /13 inches/ of snow was recorded on ground late Christmas day with 6.2 inches of the snow falling on Christmas. Temperatures held well below freezing (HI-26/LOW-18), so what snow did fall, remained. A close second to the "whitest" Christmas, occurred the Christmas after the big stock market crash in 1929. Eleven and a half inches of snow was measured December 25th, 1929 at Detroit but only three tenths /.3/ fell on Christmas. Recently, the Christmas of 2000 was very white indeed, but as to how much of a white Christmas (snow depths) is where the confusion came in. Let me elaborate, officially at Detroit Metro Airport, just six inches of snow was recorded on the ground at 7AM Christmas Day. However, just about anywhere west/north and in the city of Detroit itself, amounts were considerably higher with generally 8 to at least 15 inches. At the National Weather Service in White Lake, 15 inches was observed on the ground Christmas 2000 morning. No additional snow fell on Christmas Day (nor was anymore really wanted with the surplus already at hand). In any event, for Detroit and surrounding communities, the six inches at Detroit Metro Airport is the official snow depth used for the area.

The snowiest Christmas (most snow falling on Christmas), occurred in 1915 when 6.4 inches fell with a snow depth of seven inches on the ground. The timing of this snowfall was impeccable for Christmas with it actually starting Christmas Eve around sunset. Then, it continued to snow through the night into Christmas day. Actually, even more than the 6.4 inches fell from the entire storm with an additional 1.6 inches falling on Christmas Eve. This gave a snowstorm total of eight inches.  A little light rain did mix with the snow during the forenoon hours of Christmas but with a high temperature of only 33, it did little to mar the "Christmas card" scene. Speaking of "Christmas card" scenes, another heavy wet snowfall blanketed the area just after the turn of the century early on Christmas in 1901. The scene is described in the historical weather books as follows:


    "Night of the 24 - 25 cloudy; moist snow continued,
     heaviest between hours of 1:30 and 4:30 am, ended
     at 6 am. amount of precipitation .62 inches. The
     street cars ran all night to keep the tracks open.
     the snow adhered to trees etc, and made a very
     beautiful scene. Depth of snow on ground at 8 am,
     5.5 inches".


 This "Norman Rockwell Christmas scene" was further enhanced by a heavy coating of frost deposited on the buildings and windows Christmas Eve due to the moisture-laden air. But just like memories of some Christmases past, this majestic Christmas scene quickly faded (melted) during the day as temperatures climbed to 41 degrees, leaving just slush , slop and water. During the Christmases of 2002 and 2003, the weather was similar to both of the white Christmases mentioned above /1901 & 1915/. Here again in 2003, snow started falling Christmas Eve and lasted into at least part of, if not all of Christmas Day. On Christmas Day 2003, snowfalls ranged from at least an inch in the far southeast corner of Lower Michigan to as much as six inches across Detroit's northern suburbs, extending northward across Flint and Saginaw. On Christmas Day of 2002, total snowfall at Detroit Metro Airport was measured at 6.4” inches for both days (Christmas Eve and Christmas) with 3.4” of it falling on Christmas Day, itself. Across all of Southeast Lower Michigan snowfalls generally ranged from four to seven inches. A picture perfect Christmas was created both years with the freshly fallen snow. Like the Christmas snowstorms of 1901 and 1915, the snow Christmas 2002 was also somewhat heavy and wet with high temperatures in the lower 30s and lows only in the mid 20s.

Probably one of the slushiest and sloppiest Christmas Days happened in 1973. What started out as a white Christmas with a heavy 7 inch snow cover, quickly melted to a meager 2” slush mess by nightfall. To add insult to injury, it rained nearly a half an inch during the day.The wettest Christmas on record occurred in 1945 when 1.16 inches of rain fell. The rain actually began Christmas Eve as a light freezing rain and continued freezing until nearly dawn on Christmas, when the temperature pushed above freezing. Until the ice melted, a few tenths of an inch of ice coated everything by Christmas dawn. Needless to say, walking and driving early the Christmas of 1945 was treacherous but Santa was in and out of town in a flash!

Without a doubt, and still in the memories of long term inhabitants of Southeast Lower Michigan, is the warmest Christmas on record, the Christmas of 1982. It was as though the whole area was shipped to Florida for the holiday! The official record high at Detroit was 64 degrees, while Flint did one degree better at 65! These readings are about normal for Tallahassee, Florida! Scenes of shirt sleeved people with shorts running or riding bikes, instead of visions of sugar plums, made the Christmas of 1982 to some Michigan Christmas traditionalist, very hard to take.  This spring-like day was complete with scattered showers and, of all things, thunderstorms! Ironically, the bitterest cold Christmas came just a year later in 1983! Maybe a payback from Mother Nature for the warm weather we were treated to, the Christmas past? The temperature plummeted Christmas eve to a record low of -9 at Detroit and was accompanied by a stiff west wind averaging 25 to 30 mph, creating life threatening wind chills at times of near 40 below zero! Santa certainly brought the North Pole with him the Christmas of 1983, when he made his rounds very early that morning. In addition to the record low Christmas eve, another record low /-10/ was established during the very early morning hours of Christmas.

These Christmases past discussed are more the extreme than the norm across extreme Southeast Lower Michigan. But they do show the variable weather that can occur at Christmas (or any other time for that matter). The "normal" (or average) highs in extreme Southeast Lower Michigan Christmas Day are in the lower 30s, while lows average in the upper teens.

And now, I'd like to wish all who read this a very Merry Christmas and/or Holiday Season and the best in 2018! I plan on continuing my blog for the new year if the fates allow and look forward in reaching out to more people (and hear their comments and ideas) across the globe.

Making weather fun while we all learn,
Bill Deedler - SEMI_WeatherHistorian

Posted by WeatherHistorian_SeMI at 12:45 PM No comments:
Email ThisBlogThis!Share to XShare to FacebookShare to Pinterest

Dec 12, 2017

Another Day...Another Clipper? However: there are differences this time...Including Update

12/13/17 - 300PM

Epilogue:

The forecast and clipper system behaved very well. In fact; the anticipated strengthening deeper than even the models projected came to pass with the central pressure diving to 992-994 MB. On much of the the 12z guidance 12/12/17, central pressure was deepening to around 996-997 MB. Snowfall forecast overall also went well issued 245 PM. Nit picking; I could have said areas of 8" and isolated higher amounts but I'm happy with the overall forecast outcome.

From original forecast below;

"This system has all the ear-marks of a possible over-achiever in the latest guidance compared to  
the earlier runs. All models are leaning toward a bit of a wetter system considering the classic clipper system. This has me concerned and as we have seen; the past few have been achievers-overachievers. The Great Lakes are wide open which won't hurt and the dynamics /vorticity/ projections were notable and getting even stronger".

"At this point the max amounts of snow may very well be in the 6" to pockets of 8" totals with 3-6" encompassing that area."


Snowfall Map below: Courtesy of the NWS DTX


 Individual amounts and more can be found here

-----------------------------------------------------------------------------------------------------------

12/12/17 - 245PM

More snow will move into Southeast Lower Michigan during the forenoon hours of Wednesday. Generally speaking this system appears to have more "uumph" with it than the last one. Simply meaning; depending you location, the same or better amounts of snow than Monday night's & gusty winds while it's falling. In addition; the band of snow will orientate Northwest-Southeast as it moves into the region before leveling off again west-east like Monday night.

At this point the max amounts of snow may very well be in the 6" to pockets of 8" totals with 3-6" encompassing that area. Points further north-northeast will see the least with this system in the 1-4" range. I see no reason to deviate with the models upping amounts seeing the upstream wave impulse and projected track. This system has all the ear-marks of a possible over-achiever in the latest guidance compared to the earlier runs.

The main models are in remarkable agreement on the general snowfall with a snow to water equivalent averaging 2.0"/.15". I believe that's a bit low as the the environmental air initially is quite cold and dry; a 15/1 to 20/1 (2.0"/.10") doesn't seem too outrageous. Then however, one must account for evaporational cooling initially and moistening/saturating the column of air before the snowfall can accumulate much. All models are leaning toward a bit of a wetter system considering the classic clipper system. This has me concerned and as we have seen; the past few have been achievers-overachievers. The Great Lakes are wide open which won't hurt and the dynamics /vorticity/ projections were notable and getting even stronger.

Since the models are very close with this system and they look reasonable at this time with the track; I've decided to post the snowfall amounts generated by some of the pertinent ones. One caveat in the forecast would be main the track and its deviation from the track forecast. Further north, less snow south, more snow north; further south, less snow most areas except near Ohio border. Also of course; true available moisture and speed at which she tracks.will also affect the outcome.


 GFS                                   CAN      


3K NAM                              NAM                                      


Weatherhistorian_SEMIMaking weather fun while we all learn,
Bill Deedler - SEMI_WeatherHistorian


Posted by WeatherHistorian_SeMI at 2:59 PM 10 comments:
Email ThisBlogThis!Share to XShare to FacebookShare to Pinterest
Newer Posts Older Posts Home
Subscribe to: Posts (Atom)

Followers

Total Pageviews(Best viewed in Mozilla Firefox or Google Chrome browsers)

About Me

My photo
WeatherHistorian_SeMI
WeatherHistorian_SeMI: Recently retired NWS Weather Historian, Bill Deedler, continues his thoughts and forecasts on evolving weather patterns affecting Southeast Lower Michigan - along with adapting Season Outlooks for Southeast Lower Michigan since 1997.
View my complete profile

Browsers

Best viewed in Mozilla Firefox or Google Chrome

The Oakland Press : Serving Oakland County

WeatherHistorian_SeMI

WeatherHistorian_SeMI: Recently retired NWS Weather Historian, Bill Deedler, continues his thoughts and forecasts on evolving weather patterns affecting Southeast Lower Michigan.

Blog Archive

  • ▼  2026 (2)
    • ▼  June (1)
      • ▼  Jun 02 (1)
        • Cool & Dry May Reflective of the Upcoming Summer's...
    • ►  January (1)
      • ►  Jan 02 (1)
  • ►  2025 (11)
    • ►  December (1)
      • ►  Dec 24 (1)
    • ►  November (1)
      • ►  Nov 16 (1)
    • ►  October (1)
      • ►  Oct 08 (1)
    • ►  September (1)
      • ►  Sep 28 (1)
    • ►  July (1)
      • ►  Jul 21 (1)
    • ►  June (1)
      • ►  Jun 08 (1)
    • ►  April (1)
      • ►  Apr 07 (1)
    • ►  February (2)
      • ►  Feb 15 (1)
      • ►  Feb 02 (1)
    • ►  January (2)
      • ►  Jan 16 (1)
      • ►  Jan 01 (1)
  • ►  2024 (7)
    • ►  December (1)
      • ►  Dec 24 (1)
    • ►  November (1)
      • ►  Nov 27 (1)
    • ►  October (1)
      • ►  Oct 23 (1)
    • ►  July (1)
      • ►  Jul 08 (1)
    • ►  June (1)
      • ►  Jun 06 (1)
    • ►  February (1)
      • ►  Feb 04 (1)
    • ►  January (1)
      • ►  Jan 15 (1)
  • ►  2023 (7)
    • ►  December (2)
      • ►  Dec 24 (1)
      • ►  Dec 21 (1)
    • ►  November (1)
      • ►  Nov 18 (1)
    • ►  September (1)
      • ►  Sep 25 (1)
    • ►  July (1)
      • ►  Jul 10 (1)
    • ►  May (1)
      • ►  May 26 (1)
    • ►  January (1)
      • ►  Jan 25 (1)
  • ►  2022 (18)
    • ►  December (4)
      • ►  Dec 22 (1)
      • ►  Dec 21 (1)
      • ►  Dec 19 (1)
      • ►  Dec 02 (1)
    • ►  November (2)
      • ►  Nov 13 (1)
      • ►  Nov 04 (1)
    • ►  September (1)
      • ►  Sep 17 (1)
    • ►  June (3)
      • ►  Jun 21 (1)
      • ►  Jun 05 (1)
      • ►  Jun 01 (1)
    • ►  May (1)
      • ►  May 08 (1)
    • ►  April (1)
      • ►  Apr 01 (1)
    • ►  February (2)
      • ►  Feb 14 (1)
      • ►  Feb 02 (1)
    • ►  January (4)
      • ►  Jan 31 (1)
      • ►  Jan 26 (1)
      • ►  Jan 23 (1)
      • ►  Jan 17 (1)
  • ►  2021 (8)
    • ►  November (1)
      • ►  Nov 20 (1)
    • ►  September (1)
      • ►  Sep 21 (1)
    • ►  July (1)
      • ►  Jul 14 (1)
    • ►  June (1)
      • ►  Jun 01 (1)
    • ►  May (2)
      • ►  May 27 (1)
      • ►  May 05 (1)
    • ►  April (1)
      • ►  Apr 06 (1)
    • ►  January (1)
      • ►  Jan 30 (1)
  • ►  2020 (12)
    • ►  December (1)
      • ►  Dec 23 (1)
    • ►  November (2)
      • ►  Nov 26 (1)
      • ►  Nov 08 (1)
    • ►  October (1)
      • ►  Oct 20 (1)
    • ►  July (1)
      • ►  Jul 04 (1)
    • ►  June (2)
      • ►  Jun 18 (1)
      • ►  Jun 11 (1)
    • ►  May (1)
      • ►  May 05 (1)
    • ►  April (1)
      • ►  Apr 07 (1)
    • ►  February (2)
      • ►  Feb 23 (1)
      • ►  Feb 04 (1)
    • ►  January (1)
      • ►  Jan 30 (1)
  • ►  2019 (17)
    • ►  December (2)
      • ►  Dec 31 (1)
      • ►  Dec 20 (1)
    • ►  November (2)
      • ►  Nov 19 (1)
      • ►  Nov 12 (1)
    • ►  September (1)
      • ►  Sep 20 (1)
    • ►  July (1)
      • ►  Jul 01 (1)
    • ►  June (2)
      • ►  Jun 21 (1)
      • ►  Jun 03 (1)
    • ►  May (2)
      • ►  May 22 (1)
      • ►  May 05 (1)
    • ►  April (1)
      • ►  Apr 23 (1)
    • ►  February (1)
      • ►  Feb 20 (1)
    • ►  January (5)
      • ►  Jan 29 (1)
      • ►  Jan 27 (1)
      • ►  Jan 24 (2)
      • ►  Jan 13 (1)
  • ►  2018 (19)
    • ►  December (1)
      • ►  Dec 19 (1)
    • ►  November (2)
      • ►  Nov 25 (1)
      • ►  Nov 03 (1)
    • ►  September (2)
      • ►  Sep 23 (1)
      • ►  Sep 10 (1)
    • ►  July (1)
      • ►  Jul 14 (1)
    • ►  June (3)
      • ►  Jun 17 (1)
      • ►  Jun 12 (1)
      • ►  Jun 02 (1)
    • ►  May (1)
      • ►  May 19 (1)
    • ►  April (1)
      • ►  Apr 10 (1)
    • ►  March (1)
      • ►  Mar 31 (1)
    • ►  February (3)
      • ►  Feb 28 (1)
      • ►  Feb 10 (1)
      • ►  Feb 04 (1)
    • ►  January (4)
      • ►  Jan 20 (1)
      • ►  Jan 14 (1)
      • ►  Jan 10 (1)
      • ►  Jan 09 (1)
  • ►  2017 (17)
    • ►  December (2)
      • ►  Dec 20 (1)
      • ►  Dec 12 (1)
    • ►  November (1)
      • ►  Nov 18 (1)
    • ►  October (1)
      • ►  Oct 16 (1)
    • ►  September (3)
      • ►  Sep 26 (1)
      • ►  Sep 20 (1)
      • ►  Sep 05 (1)
    • ►  June (3)
      • ►  Jun 24 (1)
      • ►  Jun 08 (1)
      • ►  Jun 05 (1)
    • ►  May (1)
      • ►  May 08 (1)
    • ►  April (1)
      • ►  Apr 05 (1)
    • ►  February (3)
      • ►  Feb 22 (1)
      • ►  Feb 20 (1)
      • ►  Feb 06 (1)
    • ►  January (2)
      • ►  Jan 30 (1)
      • ►  Jan 22 (1)
  • ►  2016 (30)
    • ►  December (4)
      • ►  Dec 20 (1)
      • ►  Dec 16 (1)
      • ►  Dec 12 (1)
      • ►  Dec 02 (1)
    • ►  November (1)
      • ►  Nov 20 (1)
    • ►  October (3)
      • ►  Oct 31 (1)
      • ►  Oct 18 (1)
      • ►  Oct 03 (1)
    • ►  September (4)
      • ►  Sep 19 (1)
      • ►  Sep 07 (1)
      • ►  Sep 01 (2)
    • ►  July (1)
      • ►  Jul 10 (1)
    • ►  June (3)
      • ►  Jun 30 (1)
      • ►  Jun 16 (1)
      • ►  Jun 03 (1)
    • ►  May (2)
      • ►  May 27 (1)
      • ►  May 11 (1)
    • ►  April (3)
      • ►  Apr 30 (1)
      • ►  Apr 27 (1)
      • ►  Apr 01 (1)
    • ►  March (1)
      • ►  Mar 09 (1)
    • ►  February (5)
      • ►  Feb 29 (1)
      • ►  Feb 23 (1)
      • ►  Feb 22 (2)
      • ►  Feb 08 (1)
    • ►  January (3)
      • ►  Jan 29 (1)
      • ►  Jan 24 (1)
      • ►  Jan 09 (1)
  • ►  2015 (37)
    • ►  December (3)
      • ►  Dec 26 (1)
      • ►  Dec 19 (1)
      • ►  Dec 09 (1)
    • ►  November (3)
      • ►  Nov 18 (1)
      • ►  Nov 15 (1)
      • ►  Nov 01 (1)
    • ►  September (3)
      • ►  Sep 30 (1)
      • ►  Sep 08 (1)
      • ►  Sep 03 (1)
    • ►  August (1)
      • ►  Aug 02 (1)
    • ►  July (3)
      • ►  Jul 15 (1)
      • ►  Jul 12 (1)
      • ►  Jul 08 (1)
    • ►  June (4)
      • ►  Jun 23 (1)
      • ►  Jun 21 (1)
      • ►  Jun 10 (1)
      • ►  Jun 06 (1)
    • ►  May (3)
      • ►  May 31 (1)
      • ►  May 13 (1)
      • ►  May 02 (1)
    • ►  April (5)
      • ►  Apr 22 (1)
      • ►  Apr 19 (1)
      • ►  Apr 08 (1)
      • ►  Apr 06 (1)
      • ►  Apr 01 (1)
    • ►  March (2)
      • ►  Mar 10 (1)
      • ►  Mar 07 (1)
    • ►  February (3)
      • ►  Feb 18 (1)
      • ►  Feb 09 (1)
      • ►  Feb 01 (1)
    • ►  January (7)
      • ►  Jan 31 (1)
      • ►  Jan 30 (1)
      • ►  Jan 26 (1)
      • ►  Jan 22 (1)
      • ►  Jan 17 (1)
      • ►  Jan 02 (1)
      • ►  Jan 01 (1)
  • ►  2014 (41)
    • ►  December (4)
      • ►  Dec 27 (1)
      • ►  Dec 21 (1)
      • ►  Dec 15 (1)
      • ►  Dec 03 (1)
    • ►  November (3)
      • ►  Nov 16 (1)
      • ►  Nov 09 (1)
      • ►  Nov 08 (1)
    • ►  October (1)
      • ►  Oct 27 (1)
    • ►  September (4)
      • ►  Sep 21 (1)
      • ►  Sep 09 (1)
      • ►  Sep 06 (1)
      • ►  Sep 01 (1)
    • ►  August (3)
      • ►  Aug 22 (1)
      • ►  Aug 11 (1)
      • ►  Aug 02 (1)
    • ►  July (4)
      • ►  Jul 24 (1)
      • ►  Jul 16 (1)
      • ►  Jul 09 (1)
      • ►  Jul 02 (1)
    • ►  June (1)
      • ►  Jun 09 (1)
    • ►  May (3)
      • ►  May 31 (1)
      • ►  May 10 (1)
      • ►  May 05 (1)
    • ►  April (3)
      • ►  Apr 28 (1)
      • ►  Apr 16 (1)
      • ►  Apr 02 (1)
    • ►  March (4)
      • ►  Mar 26 (1)
      • ►  Mar 21 (1)
      • ►  Mar 10 (1)
      • ►  Mar 02 (1)
    • ►  February (4)
      • ►  Feb 22 (1)
      • ►  Feb 19 (1)
      • ►  Feb 17 (1)
      • ►  Feb 04 (1)
    • ►  January (7)
      • ►  Jan 31 (1)
      • ►  Jan 28 (1)
      • ►  Jan 22 (1)
      • ►  Jan 21 (1)
      • ►  Jan 17 (1)
      • ►  Jan 03 (1)
      • ►  Jan 02 (1)
  • ►  2013 (41)
    • ►  December (2)
      • ►  Dec 20 (1)
      • ►  Dec 13 (1)
    • ►  November (4)
      • ►  Nov 19 (1)
      • ►  Nov 14 (1)
      • ►  Nov 13 (1)
      • ►  Nov 04 (1)
    • ►  October (1)
      • ►  Oct 12 (1)
    • ►  September (4)
      • ►  Sep 18 (1)
      • ►  Sep 09 (2)
      • ►  Sep 03 (1)
    • ►  August (1)
      • ►  Aug 28 (1)
    • ►  July (3)
      • ►  Jul 18 (1)
      • ►  Jul 16 (1)
      • ►  Jul 11 (1)
    • ►  June (3)
      • ►  Jun 24 (1)
      • ►  Jun 11 (1)
      • ►  Jun 02 (1)
    • ►  May (1)
      • ►  May 07 (1)
    • ►  April (5)
      • ►  Apr 24 (1)
      • ►  Apr 23 (1)
      • ►  Apr 16 (1)
      • ►  Apr 10 (1)
      • ►  Apr 08 (1)
    • ►  March (6)
      • ►  Mar 27 (1)
      • ►  Mar 19 (1)
      • ►  Mar 17 (1)
      • ►  Mar 12 (1)
      • ►  Mar 07 (1)
      • ►  Mar 03 (1)
    • ►  February (4)
      • ►  Feb 26 (1)
      • ►  Feb 23 (1)
      • ►  Feb 13 (1)
      • ►  Feb 05 (1)
    • ►  January (7)
      • ►  Jan 29 (1)
      • ►  Jan 27 (1)
      • ►  Jan 26 (1)
      • ►  Jan 18 (1)
      • ►  Jan 15 (1)
      • ►  Jan 09 (1)
      • ►  Jan 02 (1)
  • ►  2012 (60)
    • ►  December (7)
      • ►  Dec 27 (1)
      • ►  Dec 24 (1)
      • ►  Dec 22 (2)
      • ►  Dec 16 (1)
      • ►  Dec 05 (1)
      • ►  Dec 01 (1)
    • ►  November (7)
      • ►  Nov 30 (1)
      • ►  Nov 28 (1)
      • ►  Nov 22 (2)
      • ►  Nov 13 (1)
      • ►  Nov 11 (1)
      • ►  Nov 03 (1)
    • ►  October (2)
      • ►  Oct 24 (1)
      • ►  Oct 05 (1)
    • ►  September (6)
      • ►  Sep 30 (1)
      • ►  Sep 25 (1)
      • ►  Sep 13 (1)
      • ►  Sep 11 (1)
      • ►  Sep 10 (1)
      • ►  Sep 03 (1)
    • ►  August (2)
      • ►  Aug 16 (1)
      • ►  Aug 09 (1)
    • ►  July (5)
      • ►  Jul 17 (1)
      • ►  Jul 16 (1)
      • ►  Jul 08 (1)
      • ►  Jul 03 (2)
    • ►  June (3)
      • ►  Jun 30 (1)
      • ►  Jun 19 (1)
      • ►  Jun 01 (1)
    • ►  May (5)
      • ►  May 31 (1)
      • ►  May 28 (1)
      • ►  May 22 (1)
      • ►  May 14 (1)
      • ►  May 03 (1)
    • ►  April (6)
      • ►  Apr 30 (1)
      • ►  Apr 25 (1)
      • ►  Apr 21 (1)
      • ►  Apr 06 (1)
      • ►  Apr 03 (1)
      • ►  Apr 02 (1)
    • ►  March (7)
      • ►  Mar 24 (1)
      • ►  Mar 20 (1)
      • ►  Mar 16 (2)
      • ►  Mar 12 (1)
      • ►  Mar 11 (1)
      • ►  Mar 02 (1)
    • ►  February (4)
      • ►  Feb 28 (1)
      • ►  Feb 21 (1)
      • ►  Feb 07 (1)
      • ►  Feb 03 (1)
    • ►  January (6)
      • ►  Jan 25 (1)
      • ►  Jan 22 (1)
      • ►  Jan 18 (1)
      • ►  Jan 12 (1)
      • ►  Jan 09 (1)
      • ►  Jan 08 (1)
  • ►  2011 (34)
    • ►  December (7)
      • ►  Dec 29 (1)
      • ►  Dec 26 (1)
      • ►  Dec 25 (2)
      • ►  Dec 18 (1)
      • ►  Dec 02 (1)
      • ►  Dec 01 (1)
    • ►  November (2)
      • ►  Nov 29 (1)
      • ►  Nov 17 (1)
    • ►  October (5)
      • ►  Oct 25 (1)
      • ►  Oct 20 (1)
      • ►  Oct 12 (1)
      • ►  Oct 11 (1)
      • ►  Oct 01 (1)
    • ►  September (4)
      • ►  Sep 28 (1)
      • ►  Sep 27 (1)
      • ►  Sep 09 (1)
      • ►  Sep 04 (1)
    • ►  August (3)
      • ►  Aug 26 (1)
      • ►  Aug 06 (1)
      • ►  Aug 05 (1)
    • ►  July (7)
      • ►  Jul 26 (1)
      • ►  Jul 25 (1)
      • ►  Jul 21 (1)
      • ►  Jul 17 (1)
      • ►  Jul 13 (1)
      • ►  Jul 09 (1)
      • ►  Jul 01 (1)
    • ►  June (2)
      • ►  Jun 04 (1)
      • ►  Jun 03 (1)
    • ►  May (4)
      • ►  May 30 (1)
      • ►  May 24 (1)
      • ►  May 23 (1)
      • ►  May 17 (1)
4/23/11. Simple theme. Powered by Blogger.