Oct 27, 2014

10/31/14 Update - The Ole' Witch May Not Be the Only Thing Flyin' This Halloween

Update - 10/31/14

...Little Change To Earlier Post as One of the Worst Halloween Evening's is on Tap for the Great Lakes and Southeast Lower Michigan...

A very strong Polar plunge of unseasonably cold air for Halloween is ongoing across the Great Lakes and Michigan. Increasingly stiff, strong north winds will drive bone-chilling rain showers mixing with and then changing to snow showers as evening approaches. Temperatures will be steady to slowly falling through the 30s and be in the upper 20s to mid 30s by trick or treat time in the early to mid evening. Readings will bottom out in the mid 20s to lower 30s overnight. What will make it even more brutal will be the "straight out of Arctic north winds" at their highest, 25 to 35 mph gusting into the 40s!

A Hallow's Eve not fit for man nor beast! Well, maybe a Polar Bear or Penguin. ;-)

Halloween Time Records

Looking at records at Detroit for Halloween shows the record low MAXIMUM is a cold 34 degrees/1917/ for the 31st; while the record low is a very cold 21 back in 1988. Neither will be realized at Detroit today, since the timing of the cold air allowed an early in the day high.  Later, the low before midnight tonight, Halloween night will hold well above 21 degrees. At Flint, the record low maximum on Halloween is 37 /1993/ and the record low is 20 degrees in 1925; while Saginaw's record low maximum is 32 /1917/ and record low for Halloween is 19 /1925/.
______________________________________________________________________
Original post 10/27/14 -
An impressive shot of Polar air has been projected for days now to slam into the Upper Midwest and Great Lakes, then push on into the Northeast during the 31st, Halloween. While models of course, have been varying somewhat on intensity and location, they are now just getting a better "feel" for this cold plunge. This should be easily the coldest air thus far this autumn season with temperatures diving down into the 30s by early Friday morning and then; holding steady to slowly falling for the balance of the day!  By trick or treat time, readings may be as low as the mid 20s to lower 30s range across Southeast Lower Michigan. Along with this early "Polar Express" will be rain and snow showers, then just snow showers will be flyin' along with the blustery cold weather.

If this system comes down as intense as I feel it could be, with some models intimating a weak low pressure over the Eastern Lakes, there may even be some scattered areas of light accumulations of snow on grassy surfaces in the coldest locations. In any event, the weather will be more appropriate for Christmas than Halloween. Well, I guess if the stores can mix up the seasons with merchandise - why not mom nature? :-) Winter-like gear will be appropriate this Halloween.


Halloween Time Records

Looking at records at Detroit for Halloween shows the record low MAXIMUM is a cold 34 degrees/1917/ for the 31st; while the record low is a very cold 21 back in 1988. At this time, I feel neither will be realized at Detroit on the 31st since the timing of the cold air will allow a midnight /30th/ or early morning high.  Later, the low before midnight on the 31st, Halloween night should hold above 21 degrees. At Flint, the record low maximum on Halloween is 37 /1993/ and the record low is 20 degrees in 1925; while Saginaw's record low maximum is 32 /1917/ and record low for Halloween is 19 /1925/.

The records for November 1st at Detroit show a record low maximum of 30 way back in 1879 - along with a record low that year of 21 degrees. Flint on the 1st, has a record low maximum of 36 /1966/ with the record low occurring not long ago, 2010. Saginaw record low max for November 1st is 38 degrees in 2002, while the record low in 21/1949.


The biggest question on this Polar plunge is where exactly, the coldest of the air will settle over - here in Southeast Lower Michigan and the Northeast, or mainly the Northeast. Just keep the winter garb handy for the chillins (and yourself) because Mom Nature will be chillin!

Making weather fun while we all learn,

Bill Deedler -SEMI_WeatherHistorian

Sep 21, 2014

Great Stretch of Early Fall Weather Through Much of The Remainder of September!

Frequently I post about bad or inclement weather that's up and coming; but at times, I'll also post about nice or great weather in the offing...this is one of those times.

Over the next week to 10 days, a large blocking pattern in the atmosphere will evolve over the eastern half of the country; diverting most storm or rain systems well west and north of Southeast Lower Michigan. This will be our first Indian Summer-like pattern since much of the region has as of yet, experienced a killing frost or freeze. It's actually still a bit too early for a killing frost/freeze to encompass the region, even though most areas have fallen into the 30s at least once. This is why I use the term Indian Summer-like, since the overall pattern expected to evolve the next week is clearly reminiscent of what typically happens during an Indian Summer pattern - but with most areas lacking the forerunner killing frost/freeze. True, there is the brief cool down now in progress over the area that will last into early this week, but I don't look for any colder weather than what has been already realized. As the Autumn progresses, a killing frost/freeze will of course be realized over all of Southeast Lower Michigan but even then, it's usually a bit more of a gradual process. For more on what is a true Indian Summer, see my quoted article written early in my Weather Historian career with the NWS back in 1996.

As stated above; the upper air pattern projected by many atmospheric models display quite massive high pressure block developing over the eastern half of the country. This block with time, phases into the Bermuda High out over the Atlantic later in the week. The building surface and upper high pressure ridge is then expected to hold at least through the last weekend of September. There is some risk of rain but not until possibly early the following week (at the close of the month). As you can see on the prognostic maps;  the Polar Jet will also be pushed well north into Canada during the upcoming week as the general ridging grows and overtakes the eastern half of the country and western Atlantic.

The warmest of the weather should arrive later in the week into the weekend; possibly extending as far as early the next week. Many of the days from mid week on, will see high temperatures push back up into the 70s. As the weekend gets underway, readings will likely flirt with the 80 degree mark.

Something tells me the cider mills will be doing a brisk business - along with maybe even some beaches for a late season swim? Try to enjoy September's nice side for a change!


Teachers & Interest Groups: Maybe you were thinking you'd like a guest speaker on weather topics for your students or members this fall? In my free time, I would be open to scheduling a talk. Send me your name, school or group, location and topic(s) you wish to discuss via the comment section of this post/blog.  Talk subjects, times and fees are negotiable. Must provide visual aid equipment. 

Contact me here in comment section or at:

wxhstrn7414@gmail.com

Making weather fun while we all learn,
Bill Deedler -SEMI_WeatherHistorian 


Sep 9, 2014

*Update 9/1014 - Powerful Dynamic System Wednesday May Bring Round Two of Severe Weather in Less Than a Week

*Update 9/10

The GFS/Euro models continue to portray a weaker system than the NAM in regards to the severe risk on Wednesday and Wednesday evening. While lower and upper winds remain strong with the system, the marginal instability is being enforced by warmer air in the mid levels along with added tropical moisture. Strong to severe limit winds remain the primary focus with any convection that does manage to take hold with the marginal instability. As stated below yesterday, I continue to feel the NAM is on the strong side of actual outcome with this system. Still, if more instability is realized and is able to entrain into the system, then severe weather will be more likely.

_________________________________________________________________

Original post - 9/9/14
A deepening low pressure system similar to last Friday will churn over the upper Mississippi Valley, Midwest and Great Lakes this Wednesday into Thursday. While the last storm center on Friday 9/5 had much better instability to work with, this one appears it will have better or stronger dynamics and wind fields, quickly turning clockwise winds at low heights (helicity) and powerful bulk shear force winds to compensate for weaker instability. Both bulk shear winds /Surface - 18,000 ft/ and heights as low as 925 MB /2500ft/ and 850 MB /5000ft/ are forecast to have winds estimated 50 - 70 knots. With that kind of wind just aloft, it won't take much to bring it down to the surface even with lesser instability this time.

This projected storm, better suited for late October or November with its projected depth (on NAM guidance which may be a bit strong), will take aim on the region Wednesday into Wednesday Night. Not unlike the last storm, the main threat will be damaging winds but in addition, there will be some risk of isolated tornadoes because of the spin in the lower atmosphere.

Maps are for Wednesday afternoon:


By Wednesday evening (below); the center of the low is slated to move into northern Michigan and while doing so, it will bring the most unstable air north into lower Michigan and thus, continuing the threat of severe weather into the first part of the night as the cold front swings across Lower Michigan into Southeast Lower Michigan.


Keep abreast of weather forecasts and potential of severe Outlooks, watches and warnings with this system especially if development continues to unfold as projected. The plotted model is that of the NAM which has been the stronger model with this system.

Making weather fun while we all learn,
Bill Deedler -SEMI_WeatherHistorian 

Sep 6, 2014

Autumn 2014 Outlook for Southeast Lower Michigan: A Tumultuous Fall?


It seems we just got started with summer and here it is, fall again. And, with the cool July this past summer, it even feels more that way this fall. 


Temperatures  


I look for temperatures to average around normal...or within two degrees of the normal. In my research, the normal range (or one standard mean deviation) for an average fall is in fact, about two degrees. At Detroit the 137 year mean now is 52.2... while the 30 year normal is a bit higher at 52.8. (see more, below).


Precipitation


The busy pattern of the summer looks like it will continue into the fall with normal to above normal rainfalls (see more below).


Fall is cited for its wild swings in temperatures and this fall certainly should be no different as impressive upper lows in Canada dive south and southeast into the U.S. The aggressiveness of this overall, now common-place pattern shows little change in the last year. Both upper air and analogues also do suggest typical to strong cold outbreaks along with some contrasting upper ridging to bring classic Indian Summer weather. Generally with stronger El Ninos, the risk of not having common Indian summers rises as the jet remains stronger across the south and less ridging/blocking is likely.


 Pacific Water's in Transition

The ENSO state continues to "ebb and flow" toward an El Nino state. The problem is just how much of an El Nino state will be recognized? Earlier this year; many dynamic and statistical models were gun-ho on at least a moderate El Nino but have since backed-off on this more aggressive state. This will definitely have an effect on the upcoming autumn and especially winter. Weak El Nino's can bring - or aid - in a variety of scenarios for the upcoming seasons.

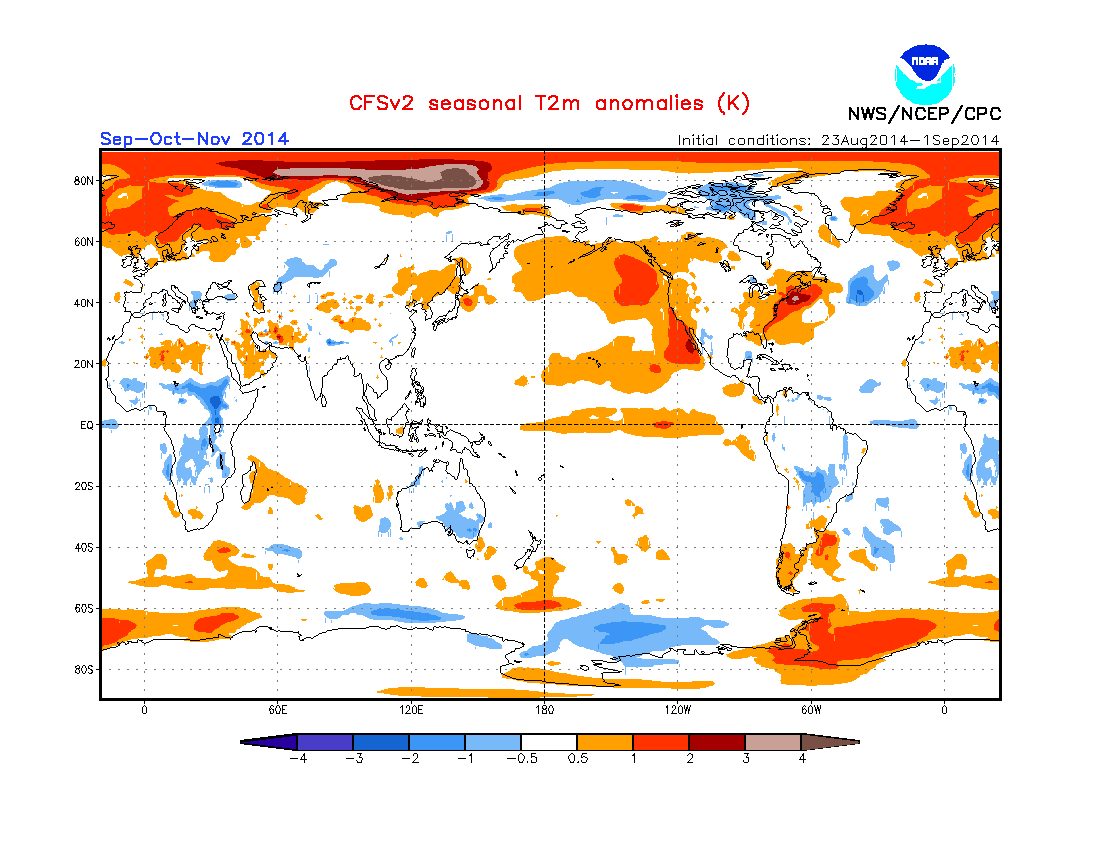
Here is the CFS projections for the upcoming El Nino and its when and where positions into th winter. Notice the projections move from a general Pacific basin El Nino to an east base. This too, if accurate, would have repercussions on our winter.


                                                                     CFS Projected Temperatures


Pacific ENSO Sea Surface Temperature Projections


Latest run of the assortment of models project the following;


The most likely scenario realistically is a range (tan shading) between 0.6 and 1.1 which would place it as a weak El Nino. Therefore, the upcoming fall and winter while influenced somewhat by the El Nino state, will not be ruled by it. Of course, this opens the door to a whole realm of possibilities as to the outcome of the upcoming winter, but first lets take a look at one season at a time, autumn.


Upper/Surface Patterns 


Oscillations of upper and related surface patterns with a preference toward troughing and cooler than normal weather should be balanced out somewhat, leaving us with an average or normal fall with notable sharply contrasting patterns. That being said; it will be prudent to keep a watch on evolving phases of the NAO and AO...and once again and just as important, like the last several seasons; the EPO. While there is no projection of the EPO that I'm aware of; there is for the NAO/AO. 


The latest experimental projections of these oscillations are below, from Kyle MacRitchie, a Ph.D. candidate in Atmospheric Science at the University at Albany


Projections for North Atlantic Oscillation /NAO/  (above) this fall are fairly tame with of course in time, wider variations in ensemble projected data from October on into the opening of December.


Investigating the encompassed Arctic Oscillation /AO/ (below) proves to be more interesting. More negatively biased data output rules in the Arctic Oscillation during the autumn months. In addition; more wider swings in the ensemble package.


 Autumn 2014 Analogues


Temperatures

Autumn analogues continue the same trends seen in the summer analogues with the majority /5/ of the seasons containing normal temperatures; with two below normal and two above. The problem is the averages are the mean of the extremes, in some years! Look for some notable contrasts during the falls. October is highlighted with above normal temperatures but we know how monthly trends have been working recently. The actual temperature trends have been reliable but not timing. All I can gather from this is that warmer than normal temperatures are likely, likely creating some Indian Summer weather mid fall.


Preciptation 

Rainfall is very similar to summers analogues with a wild variety of outcomes with a tilt toward normal to below. I feel this is a bit too low given the trend we are in and likelihood of busy frontal activity. I look for normal to above rainfall across the region.

While the chances of a frost/freeze occurring near or before the average dates were good, the dates when the first snow flakes (trace) flew were more variable. October historically sees at least a trace of snow by the end of the month.


Get out and enjoy the good fall weather!


Important Dates

Autumn arrives: Mon  - Sep 22nd @ 10:29PM

Harvest Moon; Mon - Tue Sep 8-9th

Hunter's Moon: Wed - Oct 8th

Halloween:  Fri - Oct 31st

Thanksgiving Thu - Nov 27th


Making weather fun while we all learn,
Bill Deedler -SEMI_WeatherHistorian

 ________________________________________________________________________________________


Teachers & Interest Groups: Maybe you were thinking you'd like a guest speaker on weather topics for your students or members this fall? In my free time, I would be open to scheduling a talk. Send me your name, school or group, location and topic(s) you wish to discuss via the comment section of this post/blog.  Talk subjects, times and fees are negotiable. Must provide visual aid equipment.


Links:

2014 temperature extremes: U.S. runs hot and cold

Farmers almanac's signs of a hard winter?


Sep 1, 2014

Summer of 2014; Was it Really So Cool? You Might Be Surprised! And, Was it Wet? No Surprise Here!

Overall summer across Southeast lower Michigan averaged right on normal across Southeast Lower Michigan when you average the three main climate sites.  What?

Yes, that's right! The one degree /-1.1/ below normal at Detroit is purely a function of the warmer 30 year normals for Detroit (as compared to Flint and Saginaw who actually averaged normal to slightly above - see stats below) The warmer normals at Detroit are mainly due to the expansion of Detroit's heat island out into the suburbs including Detroit Metro Arpt. In addition (and more proof of the heat island affect); the 70.6 degree average at the Detroit landed squarely on the 100 year normal for Detroit before the artificial heating /70.6/.

Want more proof that backs up the heat island affect at Detroit; look at the normal temperatures and this summer's averages at both Flint and Saginaw (below) whose sites have negligible heat island affects. Flint actually averaged about a degree /+0.9/ above normal, why Saginaw averaged almost right on normal /+0.2/. In fact at Flint, both June and August averaged close to 2 1/2 degrees above normal! Therefore, none of the climate sites in Southeast Lower Michigan landed anywhere near the top 20 coolest for the summer.


Reasons it felt even cooler:


Oh there were cooler statistics; the notable less than normal 90s across the entire region!
Detroit felt only three 90 degree or better temperatures. One each month, with the highest at 94 on 7/22/14. Flint only felt one 90 degree day on 6/17/14 during the summer season while Saginaw also felt a 90, on 6/28/14. These recorded 90s are far below the normal or average across Southeast Lower Michigan where 8-12 are routinely seen in a year (it is still possible yet to catch one or two in September).

Another big reason (if not the biggest) was the notably cooler than normal July. All three stations rallied on below normal statistics there! As far as my opinion, if temperatures are gonna be below normal...JULY is the welcome month!


Top 20 Coldest/Warmest Julys in Southeast Lower Michigan
 
Rank Detroit Area* Flint Bishop** Saginaw Area***
Coldest Warmest Coldest Warmest Coldest Warmest
Temp Year Temp Year Temp Year Temp Year Temp Year Temp Year
1 67.1 1891 79.3 2011 65.6 2009 78.0 1921 66.0 2009 77.5 1921
2 68.8 1992 79.0 1955 66.9 1992 77.7 1935 66.2 1992 76.8 1916
3 68.9 2009 79.0 2012 67.3 1967 76.8 2011 67.1 1924 76.4 2012
4 68.9 1967 79.0 1921 67.3 1962 76.7 1934 67.2 1920 76.2 1935
5 69.6 1971 77.9 1916 67.4 1971 76.5 1955 67.3 1945 76.1 2011
6 69.6 1875 77.7 1931 67.4 1960 76.1 2012 67.5 1962 76.0 1931
7 69.7 1920 77.1 1988 67.5 2000 76.1 1931 67.5 1956 75.9 1955
8 69.9 2014 76.8 1999 67.6 1996 75.9 1936 67.8 1950 75.9 1936
9 69.9 1924 76.8 1901 68.3 2014 75.8 1933 67.9 2000 75.8 1988
10 69.9 1884 76.6 2010 68.3 1950 75.5 1987 68.2 1965 75.5 1934
11 70.2 2000 76.5 2002 68.4 2004 75.2 1988 68.4 2014 75.3 1933
12 70.3 1882 76.5 1952 68.4 1965 74.9 2002 68.4 1985 74.3 2010

Still another reason it felt cooler; it's been hotter in recent years and thus, comparatively it  "felt" cooler. And finally to a lesser extent it felt cooler; it rained a lot - more than average at all three sites.

Analogues/Outlook?

My analogues and outlook temperatures and projected averages performed well and right from the get go when I dismissed the projection's of a notably cool summer...

Temperatures :


Overall; a comfortable summer is on tap as I look for temperatures to average around normal to slightly below for the summer. That being said I don't anticipate a notably cool summer. I look for temperatures to average between +1.0 degree and -2.0 degrees of the summer norms across Southeast Lower Michigan (see a more thorough discussion under Analogues). Many others are calling for a cooler than normal summer across the Great Lakes; including Southeast Lower Michigan.


Since late fall of 2013, we have had a couple of years which take full marks for past prediction of the past few seasons; 1880-81 and 1981-82. And, maybe not surprising; 1881 contained a normal summer while 1982 had a cool summer (like our two prevalent trends seen). Another year; 1899 joins these analogue ranks as a decent performer during the winter and a good parallel this spring. All three analogues projected a cool spring with the temperature pattern we've seen this spring with time; below normal - normal - above normal. These analogue springs averaged below normal because of a very cold beginning to the season but will a gradual trend change from below to normal to above (Mar; Apr, May). The Summer of 1899 turned out to have a normal summer, therefore we have two normal summers and one below for the recent better performing analogues.


While the summer temperature and averages performed well; the pattern unfolded slower than prevailing analogues...just like the spring. May's above normal warmth held through much of June while June's expected coolness showed up by July. The sine-wave pattern returned to normal and above in August. While overall temperatures pattern trends and numbers/averages for the summer are realized, the timing remained somewhat elusive. And as stated before, temperature patterns most of the time don't come neatly wrapped in monthly intervals in the real meteorological world, therefore this signal is least important.


Wet and Wetter!


It was the 19th wettest summer at Detroit with 12.75"; 17th wettest at Flint with 12.04" and Saginaw just missed 20th spot with 10.52 (20th 10.63").

Of course the big news of the summer around metro Detroit was the big flash flooding event on August 11th with 4.57" of rain officially at Detroit. Other totals were higher and lower for a complete write up see here. The rainfall total at Detroit in August was 6.32", which made it the 9th wettest! Had that on day of flooding rains not occurred, August would have been drier than normal with just 1.75" falling the remainder of the month.

That 4.57" of rain in a calendar day was also quite noteworthy! After researching my records from Detroit, I noted that amount was the second highest amount of rain ever to fall on a calendar day in Detroit!  "Previous record was back in 1926 with nearly the same... 4.51" on August 17th, 1926. However this is NOT the record of all time for a date...that record also occurred in the 1920s...occurring back on July 31, 1924 with 4.74". 

You might remember last summer around metro Detroit was also a wet one; actually wetter than this one with its rainfall total; a whopping 16.13" of rain fell making it the third wettest summer of all time records in Detroit. However; Flint and Saginaw were decidedly drier and not placing in the top 20 wettest list.

Analogues/Outlook?

Rainfall:

I look for rainfall to be quite variable as mixed data presents conflicting results but this is not unlike many summers. Taking all data (past and present) into account; rainfall is expected to be around normal over the southern sections of Southeast Lower Michigan and normal to below across the Saginaw Valley and Thumb Region.

Rainfall projections for the summer, are really a mixed bag, as it frequently is in the summer with four normal rainfalls, four below and two above with the average skewed on the drier side. A notable trend from many of the summer analogues are wetter conditions early and/or mid summer with drier weather later summer.

No doubt about it, my call for normal rains south and normal to below north was too dry. While lesser rains did fall in the far northern sections of the region, most areas still received above normal rain. This was primarily do to just a day or couple days of torrential rains. In addition; the jet stream remained active across southern Canada and the Mid West as expected see Stormy Weather, below.


Stormy Weather?

All in all, severe weather seemed rather normal to maybe somewhat above for severe thunderstorm activity/warnings but well below for tornadoes with just two confirmed this summer. Don't quote me on these statistics since they aren't out.

Analogues/Outlook ?

Stormy Weather?

As mentioned above; the data to me depicts a notable confrontation zone and I believe we have just recently entered it as of late May. Typically, the busiest times for severe weather in these parts is June into July; with mid June to mid July prime-pickens. I've included the severe weather stats for Southeast Lower Michigan since 1980. Looking above at our analogue summers since then are 1982, 1991, 1997 and 2002 and all but 1982 contained normal to above normal (or busy) severe seasons. That's not surprising given the jet stream that's been dominant in Canada this year. Were this upper jet continued to be aggressive, notable wind events, squall lines and possibly a derecho event or two across the country would be the risk. 

This confrontation zone held well  (too well) through the summer as the upper low/northwest jet stream remained active all summer and thus, the parade of cold fronts, warm fronts and resulting heavier rains. 

Epilogue;  

Overall when considering both temperatures and precipitation, two analogue years held us in good stead for the summer; 1957 and 1968. Both were wet with temperatures averaging close to this summers (see analogue chart)

Next Up...The Autumn Outlook. 

Note; this summer data is preliminary and has not been released by the NWS
as of 900pm Monday, Sep 1st 2014.


Making weather fun while we all learn,
Bill Deedler -SEMI_WeatherHistorian

Aug 22, 2014

Death and Unprecedented Damage From the Flood of 1986 in Central Lower Michigan Along With Other Notable Floods!

Because of the serious flooding over Southeast Lower Michigan in mainly
the metro Detroit area seen in August 2014; I've decided to run one of my
earliest articles with the NWS in regard to a more widespread serious
flooding event that took place over central Lower Michigan nearly 30
years ago on September 10-12th, 1986. I've added additional information
on it and other notable floods. 
 
From reports and wiki on the '86 Flood:
"Damage was unprecedented. Dam failure abounded with a total of 14 dams 
undermined and an addition 19 dams at risk during the event. Four major 
bridges failed. Thousands of acres of sugar beets, beans, potatoes, 
corn, and other vegetables were in ruin. A total of six people perished 
during the flood. Damage totaled US$500 million (1986 dollars), and 30 
counties were declared Federal disaster areas."


I was well into my career when this took place with much of the activity 
taking place over the NWS Flint's jurisdiction of Southeast Lower Michigan.
However; the NWS Forecast Office in Ann Arbor and NWS Detroit also aided 
this region with river warnings and radar information. I've also included
some historical news items on the storm at the end. 

 
 ...A Thumbnail Sketch of a Great Flood in Southeast Michigan... 
  By: Bill Deedler, Southeast Lower Michigan Weather Historian 
September, being somewhat of a transition month between summer 
and fall, generally brings a taming of the summer heat and
thunderstorms. Normal rainfall amounts drop off from the summer 
maximums and the weather, more often than not, goes into more of
a tranquil period before the fall storms begin to rage. But this
was not the case on September 10-12th, 1986 in the "Thumb Region"
of Southeast Lower Michigan.
In the worst flood devastation in 50 years, total damage was
estimated between 400 and 500 million dollars. Of that total,
around $120 million was crop damage, since the flood came near
harvest time. The entire flood area covered generally a 60 mile
wide band across the central portion of Lower Michigan. The
central axis of the flood area extended from north of Muskegon,
near Rothbury, east across all of Central Lower Michigan to near
Port Sanilac, in Southeast Lower Michigan's "Thumb Region". Some
major cities in Southeast Lower Michigan affected by the flood
included Saginaw, Bay City and Midland. It is interesting to note
that the city of Flint actually experienced more severe flooding
in September 1985 than it did in September 1986. 
Several estimates about the likelihood of such a flood like the
one in 1986 were tossed about such as, it was a "100 year flood"
or even a "500 year flood". But to the people of the flood
stricken area it is known as "The Flood"! A number of rain events
plagued this area through September but the main one occurred
September 10-12th, 1986. The flooding rains were triggered by
a nearly stationary front which, like the flood area itself,
stretched east-west across Central Lower Michigan. Warm,
moisture-laden air from the Gulf of Mexico (enhanced by a
moisture plume from remnants of a tropical system over the
Eastern Pacific), streamed north and east out of the Midwest,
across the stationary front into Central Lower Michigan. To the
north, cooler, drier air remained entrenched over Upper Michigan.
The upper wind pattern across the Great Lakes was conducive in
holding the surface front nearly in place, resulting only in a
slow drift to the north through the entire period. This, in turn,
caused any available moisture pushing north across the front to
be wrung out and dumped persistently over the same general area.

An extensive area of heavy rain and severe thunderstorms with
torrential rains developed just north of the front and extended
west from Michigan into Wisconsin. As the moisture from the south
overran the front and fell as heavy rain over Central Lower
Michigan, it also traversed the same area from west to east
during the two day period. This process of precipitation
developing and repeatedly moving over the same area is known
all too well by meteorologists and hydrologists as "train-
echoing". This was the primary mechanism for the persistent 
heavy rainfall during this particular flood event. 
The rain began late Tuesday night, September 9th, over West-
Central Lower Michigan and steadily moved east across Central
Lower Michigan and into the "Thumb Region" of Southeast Lower
Michigan overnight. Rainfall during the September 10-12th period
over Central Lower Michigan averaged an incredible 6 to 12
inches, with even isolated reports of up to 14 inches. Much of
this deluge fell in a 12 hour period on the 11th. The heaviest
band of rain over Southeast Lower Michigan for the two day period
extended from the Alma area, east across Saginaw into Vassar. As
a result of these monsoon-like rains, several rivers surged over
their banks and established record heights (see table below). 
 
River Flood Stage Crest  (date) (old) Record  (date)
Tittabawassee
(Midland)
24 33.94  (9/13/1986) 29.70   (3/28/1916)
Saginaw
(Saginaw)
19 *24.16   (9/15/1986) *24.90   (3/30/1904)
Pine
(Alma)
8 12.82   (9/12/1986) 10.81   (3/13/1948)
Cass
(Vassar)
14 24.82   (9/12/1986) 20.80   (3/30/1948)
Cass
(Frankenmuth)
17 27.52   (9/12/1986)
23.30   (5/22/1996)
22.83   (3/6/1976)
*  Saginaw River at Saginaw did not establish a new record height
 
The Cass River at Vassar with a flood stage of 14 feet, rose to
an unprecedented (and almost unbelievable) 24.82 feet, or better
than 10 feet above flood stage! This level of nearly 25 feet is
even more astonishing, when you consider the normal height of the
river is about 4.5 feet. Likewise, the Cass River at Frankenmuth
rose to around 10 feet above its flood stage with a 27.52 feet
reading (flood stage is 17 feet). Coincidentally and interesting
to note, the Cass River at both Frankenmuth and Vassar has had
record (or near record) flooding every 10 years since 1976.
Like many locations in and near rivers and drainage areas, the
flooding in the town of Vassar was a nightmare! It was definitely
one of the hardest hit areas with all the downtown businesses and
about 50 homes being flooded. The flood waters reached to the
intersection of Main and Huron St. on the northwest side of the
Cass River and extended to the intersection of Huron and East St.
on the southeast side. The river rose so quickly and forcefully,
that some people barely had enough time to get out. Several
people awoke in Vassar to find their streets and cars covered 
in rushing water as the raging river surrounded their homes and
businesses. But further downriver on the Cass, at Frankenmuth,
vigorous sand bagging on top of permanent levees protected the
downtown area from any serious flooding. 
Several people lost their lives either directly or indirectly
due to the flood. Looking through newspaper articles and
related storm reports, at least 10 people died. The body of
a hunter was found on the bank of the Muskegon River, a woman
who drove her car off a flooded road into the Cass river, two
children playing near flooded streams were swept away, two more 
people drowned while in boats, falling overboard; and another 
two men were electrocuted while using sump pumps in flooded
rooms. Sadly, the flood also took its toll on human life in
another, devastating way. Two farmers, after seeing all their 
crops under water, committed suicide. Close to 100 people were
injured in the flood, whether it be during preventive flood
procedures or during cleanup activities.
 Across Central Lower Michigan, 22 counties were declared disaster
areas. This encompassed nearly 14,000 square miles and where 1.8
million people lived.  Even though damage was estimated between
400 to 500 million dollars, it hard to put a dollar figure on the
huge amount of personal items these people lost and also, the
emotional scars some still carry with them. To give an idea the
volume of water that fell over Saginaw River basin, it was
estimated by the state hydrologist (at that time) that if that
water could be drained into Lake St. Clair, it would raise its
level 10 feet!  The Bay City Times, in retrospect, summed up
"The Flood" well by telling their readers to just scan the "D"
listings in the dictionary,"its all there, Downpours, Drenching,
Devastation and Disaster"! 
Two key elements that contribute to flash flooding are rainfall
intensity and duration. Other factors that play important roles
include soil conditions, topography and ground cover. Flash
floods cause more deaths each year in the United States than
either lightning, tornadoes or hurricanes! In the 20 year
period from 1972-1991, on an average, 146 people were killed
every year from flash flooding. Lightning claimed 80 lives per
year during the period, tornadoes 69, and hurricanes 17.
The National Weather service issues Flash Flood Warnings when
flash flooding is occurring or imminent. Remember the following
when you are in a flood situation...
 
1)  Get out of areas subject to flooding, including terrain low
    spots, dips, canyons, washes, etc.
2)  Avoid already flooded and high velocity flow areas. Do not
    attempt to cross flowing streams
3)  If driving, be aware that the road bed may not be intact
    under flood waters. Turn around and go another way. NEVER
    drive through flooded roadways!
4)  If your vehicle stalls, leave it immediately and seek
    higher ground. Rapidly rising water may engulf the vehicle
    and its occupants and sweep them away.
5)  Be especially cautious at night when its harder to recognize
    flood dangers.
6)  Do not camp or park your vehicle along streams and washes,
    particularly during threatening weather conditions.
7)  Do not let children play around high water, storm drains
    rivers or creeks.
8)  If advised to evacuate, do so IMMEDIATELY!
9)  Move to a safe area before its access it cut off by high      
      water.
10) Monitor NOAA Weather Radio, television or radio for the
      latest warnings and information.
 
 
Other information and news items on this great flood & other notable floods 

Flood of the century devastated area in '86

Hundreds Flee Flood After Heavy Rain Bursts Dam in Michigan

The page below also discusses the historic floods of 1904 (after our coldest winter and heavy  snowfalls) along with the Flood of 1947

Floods; National Water Summary 1988-89 —Floods and Droughts: MICHIGAN

Finally, a "thumbnail sketch" of Floods in the United States: 1901–2000


Will the Autumn of 2014 continue our trend of below normal temperatures and normal to above normal
rains? See my Fall Outlook early September along with my new proposed endeavor for myself and
area teachers. 
 
Making weather fun while we all learn,
Bill Deedler -SEMI_WeatherHistorian 
 

Aug 11, 2014

Historic Rainfall & Flooding Over Areas of Metro Detroit - New Record DAY Rainfall at Detroit for the Month of August But Not for All Time

Day Record Rainfall for Detroit in the month of August with 4.57" was reported at DTW on August 11th, 2014 up to 10 pm. Previous record was back in 1926 with nearly the same... 4.51" on August 17th, 1926. However this is NOT the record of all time for a date...that record also occurred in the 1920s...occurring back on July 31, 1924 with 4.74" That specific  record should hold into midnight. More recently; back in 1998 on July 7th the NWS @ Detroit Metro Arpt recorded 4.34" of rain on that date.

Therefore; the historic rain recorded at DTW today (8/11/14) was the second highest rainfall for any date since records began. The highest again for a day/date; 4.74" on 7/31/24.


                              Record Crest of Clinton River @ near Clinton Twp


The Clinton River broke its all time record flood stage following Monday's heavy rain. At its peak, the flow was approx 12,000 cubic feet per second, which is equivalent to 84,000 gal/s, which is 5 million gallons a minute! /NWS-DTX/


Historic Flooding and Storm/Rainfall Reports for August 11 2014 /DTX/


Making weather fun while we all learn,
Bill Deedler -SEMI_WeatherHistorian

Aug 2, 2014

Extreme Temperature Julys Are Becoming More Commonplace Across Southeast Lower Michigan

In the past five years, three Julys have placed on the top 20 warmest Julys while two have placed on the top coolest! And out of those; three have placed in the top six coolest or warmest Julys. So, basically it's been feast or famine lately for July temperatures over Southeast Lower Michigan.

June and July's temperature statistics are in across Southeast Lower Michigan and while cool, not terribly so. Actually June was above normal so it's really July that we have to contend with...

JULY'S COOL TEMPERATURES
 
DETROIT
AVG. MAXIMUM     79.9              83.4    -3.5
AVG. MINIMUM     59.9              63.9    -4.0
MEAN             69.9              73.6    -3.7    8TH COOLEST
DAYS MAX >= 90      1               4.5    -3.5

FLINT

AVG. MAXIMUM     79.1              81.9    -2.8
AVG. MINIMUM     57.5              59.2    -1.7
MEAN             68.3              70.5    -2.2    9TH COOLEST
DAYS MAX >= 90      0               2.8    -2.8

SAGINAW

AVG. MAXIMUM     78.4              81.8    -3.4
AVG. MINIMUM     58.4              60.2    -1.8
MEAN             68.4              71.0    -2.6    11TH COOLEST
DAYS MAX >= 90      0               3.0    -3.0
 

SOUTHEAST LOWER MICHIGAN /3 CLIMATE SITES/


DTW  FNT  MBS   AVE NOR DEP

69.9 + 68.3 + 68.4 = 68.9 - 71.7 = - 2.8   ~  10TH COOLEST

LAST TIME THIS COOL OR COOLER: 2009

68.9 + 65.6 + 66.0 = 66.8 - 71.7 = - 4.9   ~  2ND COOLEST


So as you can see while cool this July, it was nowhere as cool as in 2009 which was Detroit's 3rd coolest July and Flint and Saginaw's coolest of all record time. One of the main reasons it felt so cool this July is that we are coming down off two back to back hot Julys; 2011 & 2012! Last July /2013/ averaged slightly above normal.


Rank Detroit Area* Flint Bishop** Saginaw Area***
Coldest Warmest Coldest Warmest Coldest Warmest
Temp Year Temp Year Temp Year Temp Year Temp Year Temp Year
1 67.1 1891 79.3 2011 65.6 2009 78.0 1921 66.0 2009 77.5 1921
2 68.8 1992 79.0 1955 66.9 1992 77.7 1935 66.2 1992 76.8 1916
3 68.9 2009 79.0 2012 67.3 1967 76.8 2011 67.1 1924 76.4 2012
4 68.9 1967 79.0 1921 67.3 1962 76.7 1934 67.2 1920 76.2 1935
5 69.6 1971 77.9 1916 67.4 1971 76.5 1955 67.3 1945 76.1 2011
6 69.6 1875 77.7 1931 67.4 1960 76.1 2012 67.5 1962 76.0 1931


Even more notable in the recent past since the millennium, eight out of 15 Julys (including July 2000) placed either in the top 20 coolest or warmest July listings at all three climate sites! Therefore just over half of the last 15 Julys /53%/ made the top 20 lists. Extraordinary when you consider records go back into the early 1900s at Flint and Saginaw and 1870s in Detroit! In additions; temperature deviations during the summer months are less wide or exaggerated by nature. The hotter Julys have it over the cooler ones thus far; about 5 to 3 in the past 15 years anyway.


Top 20 Coldest/Warmest Julys in Southeast Lower Michigan
 
Rank Detroit Area* Flint Bishop** Saginaw Area***
Coldest Warmest Coldest Warmest Coldest Warmest
Temp Year Temp Year Temp Year Temp Year Temp Year Temp Year
1 67.1 1891 79.3 2011 65.6 2009 78.0 1921 66.0 2009 77.5 1921
2 68.8 1992 79.0 1955 66.9 1992 77.7 1935 66.2 1992 76.8 1916
3 68.9 2009 79.0 2012 67.3 1967 76.8 2011 67.1 1924 76.4 2012
4 68.9 1967 79.0 1921 67.3 1962 76.7 1934 67.2 1920 76.2 1935
5 69.6 1971 77.9 1916 67.4 1971 76.5 1955 67.3 1945 76.1 2011
6 69.6 1875 77.7 1931 67.4 1960 76.1 2012 67.5 1962 76.0 1931
7 69.7 1920 77.1 1988 67.5 2000 76.1 1931 67.5 1956 75.9 1955
8 69.9 2014 76.8 1999 67.6 1996 75.9 1936 67.8 1950 75.9 1936
9 69.9 1924 76.8 1901 68.3 2014 75.8 1933 67.9 2000 75.8 1988
10 69.9 1884 76.6 2010 68.3 1950 75.5 1987 68.2 1965 75.5 1934
11 70.2 2000 76.5 2002 68.4 2004 75.2 1988 68.4 2014 75.3 1933
12 70.3 1882 76.5 1952 68.4 1965 74.9 2002 68.4 1985 74.3 2010
13 70.4 1979 76.2 1949 68.6 1956 74.5 1949 68.5 2004 74.2 1930
14 70.4 1965 76.2 1935 68.6 1968 74.5 1939 68.6 1981 74.1 1983
15 70.4 1915 76.1 2006 68.6 1945 74.2 2010 68.6 1925 74.1 1937
16 70.4 1895 76.0 1987 69.0 1969 74.0 1983 68.7 1947 73.9 1987
17 70.6 1996 75.9 1964 69.1 1947 73.8 1977 68.8 1979 73.5 2006
18 70.6 1978 75.9 1887 69.2 1924 73.7 1938 68.8 1915 73.5 2002
19 70.7 1984 75.7 1977 69.4 1997 73.5 1952 69.1 1978 73.3 1998
20 70.7 1945 75.5 1993 69.4 1954 73.4 1940 69.1 1951 73.3 1966
* Detroit Area temperature records date back to January 1874.


Another thing I'll throw out there while on the subject of top 20 lists; the top 20 lists have also been busy in the winter for coldest/warmest months and snowfall. Why? One thing is a more amplified upper jet stream, more blocking and stormier pattern. Global climate change or natural cyclical climate pattern changes /NAO, AO, PDO, AMO, EL NINO, LA NINA,  MJO/ or some of both? Since it is such a short trend where climate change is concerned, I lean more on the side with natural cyclical changes in regard to the past 15 years. Time will tell....


Making weather fun while we all learn,
Bill Deedler -SEMI_WeatherHistorian