12/24/23

Early signs show a Major Shift in the Polar Vortex, with a Strong Stratospheric Warming Wave now likely to bring a more Wintry Weather pattern in January

The Following was issued by the Severe Winter Europe Discussing the Upcoming  Strong Stratospheric Warming Which Will Affect the Northern Hemisphere.

Early signs show a Major Shift in the Polar Vortex, with a Strong Stratospheric Warming Wave now likely to bring a more Wintry Weather pattern in January

A strong Stratospheric Warming event is starting to appear in the forecast for January. It means a weakening or even collapse of the Polar Vortex and could bring a much-expected weather pattern change across the United States and Europe as we head deeper into Winter.

We already discussed a major January weather pattern shift in our recent articles. But we never really got an in-depth look at all the mechanics behind a strong weather shift across the United States.

In this article, we will look at the stratospheric Polar Vortex, one of the main culprits behind mid-winter weather pattern shifts. We will quickly look at what it actually is before focusing on the upcoming stratospheric warming event and potential winter weather outcomes in early January.
polar-vortex-north-hemisphere-winter-2024-january-february-forecast-united-states-canada-stratospheric-warming-brings-cold-weather-pressure-anomaly
 

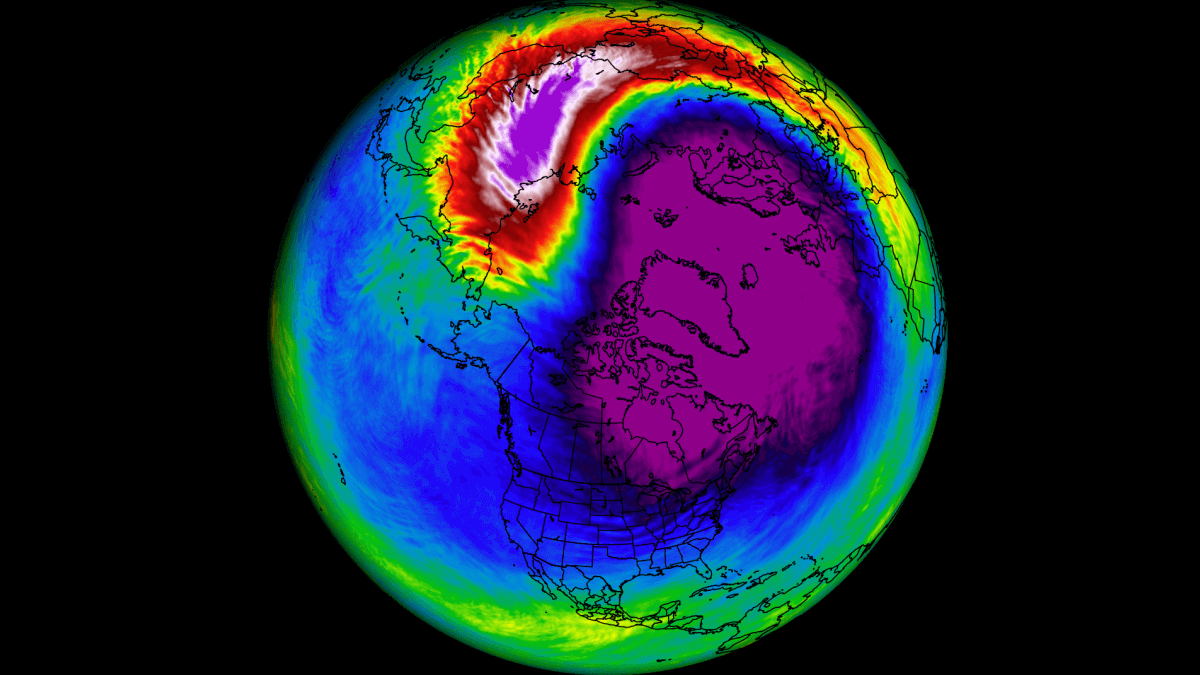
POLAR VORTEX OVER THE NORTH

 
The best way to understand the Polar Vortex is to visualize it. In simple terms, it is just a name that describes the broad winter circulation over the northern (and southern) hemispheres.

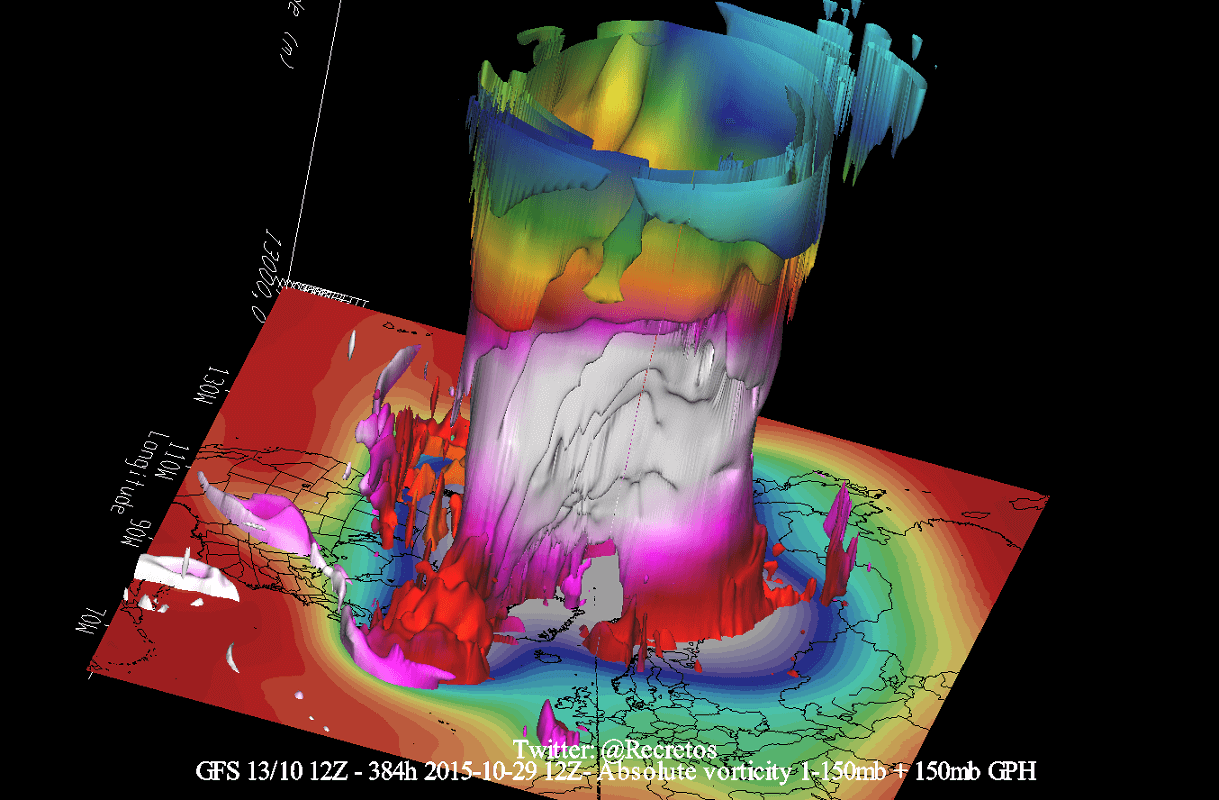
Below, you can see a 3-dimensional image of the Polar Vortex. The vertical axis is greatly enhanced for better visual presentation. It basically shows the actual structure of the Polar Vortex, connecting down to the lower levels and to the pressure systems.
winter-2024-polar-vortex-circulation-warming-collapse-weather-forecast-united-states-north-hemisphere-pressure-3D-structure-cold-snowfall

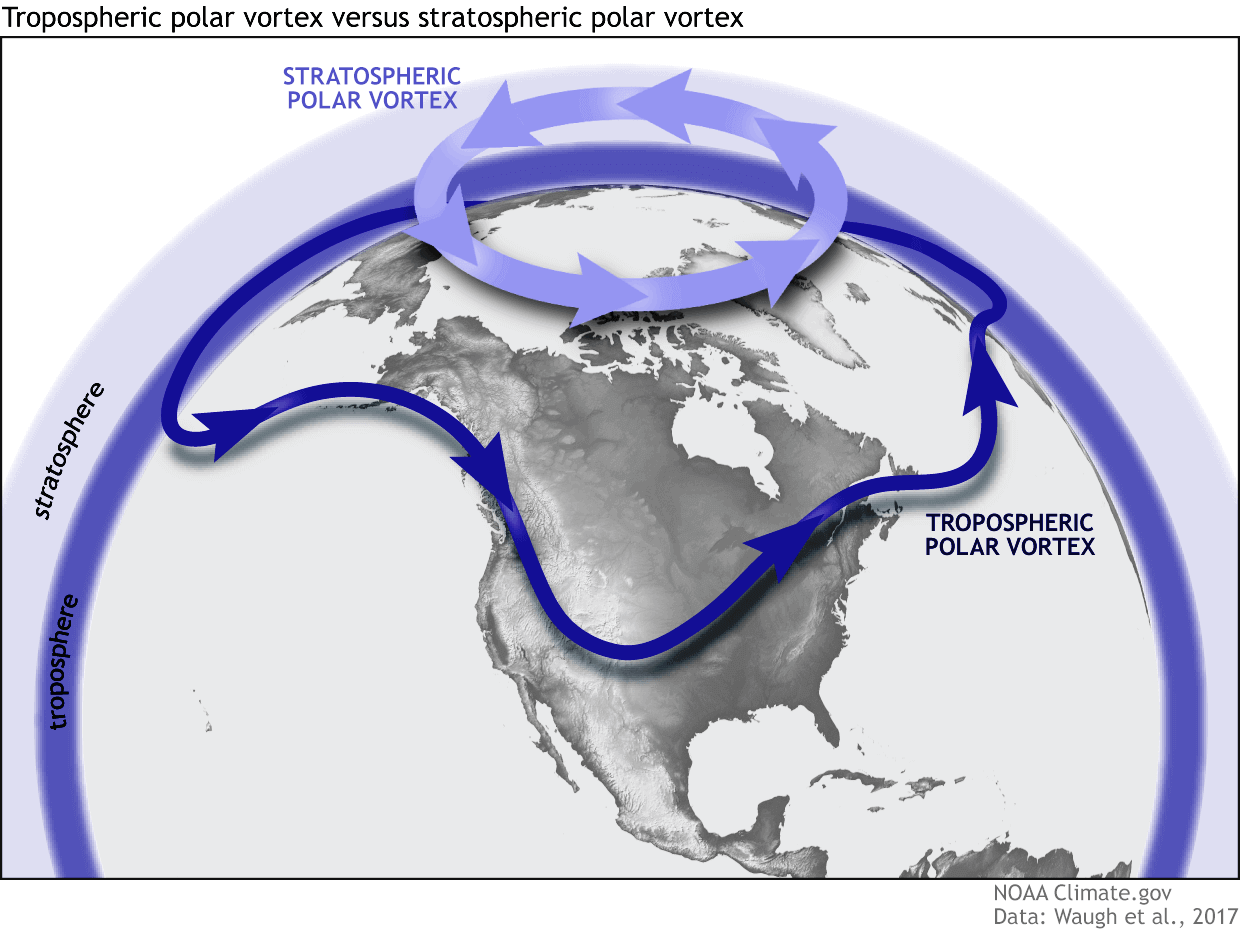
The Polar Vortex extends high up into the atmosphere. The lowest level of the atmosphere is called the troposphere, where all the weather events are. But above that, we have the stratosphere, a deeper and drier layer, and the home of the ozone layer.

For this reason, we tend to separate the entire Polar Vortex into an upper (stratospheric) and a lower (tropospheric) part. They both play their role differently, so we monitor them separately. But both parts together form the winter circulation across the Northern Hemisphere.
polar-vortex-sudden-stratospheric-warming-tropospheric-what-is-it-north-hemisphere-winter-weather-forecast-pattern-snowfall-cold-united-states

To put the Polar Vortex into perspective, we produced a high-resolution video below, which shows the Polar Vortex in 3D, giving you a better idea of what it actually looks like. But note that the vertical size of the vortex was greatly enhanced for visual purposes.

 
The main takeaway from the video should be that the Polar Vortex is not just one winter storm or a cold outbreak that moves from the Midwest into the eastern United States. It is the entire weather circulation over the Northern Hemisphere.

Now that we know what the polar vortex is, we will look at the latest analysis, the forecast for the near future, and also at the extended-range forecast of weather patterns.
 

CURRENT STATE OF THE POLAR VORTEX

 
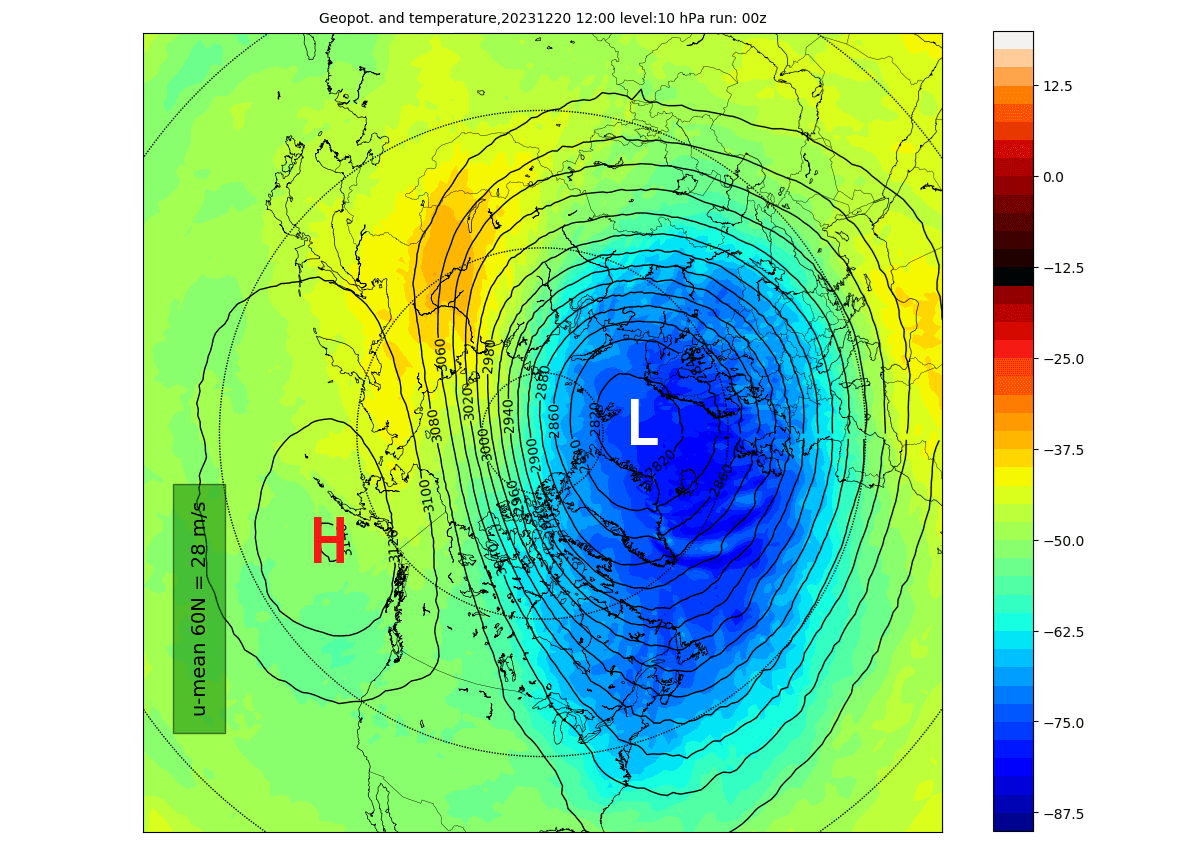
The Polar Vortex is currently normal in size, but it is displaced due to a high-pressure area over the North Pacific. The image below shows geopotential height and temperature in the mid-stratosphere at the 10mb level (30km/18.5miles). The Polar Vortex looks like a “cyclone” with a cold core near its low-pressure center. Image by weatheriscool.com
polar-vortex-north-hemisphere-forecast-analysis-december-temperature-pressure-area-stratosphere

You can see a weak, warm wave on the border between the pressure systems. This is only a small warming wave, with a stronger event expected to develop.

If we look at the 3D structure of the whole Polar Vortex, we can fully see the current compact structure of the Polar Vortex. It is not circular in shape but rather elongated and compressed. That is because a stratospheric high-pressure area is pressing against it.
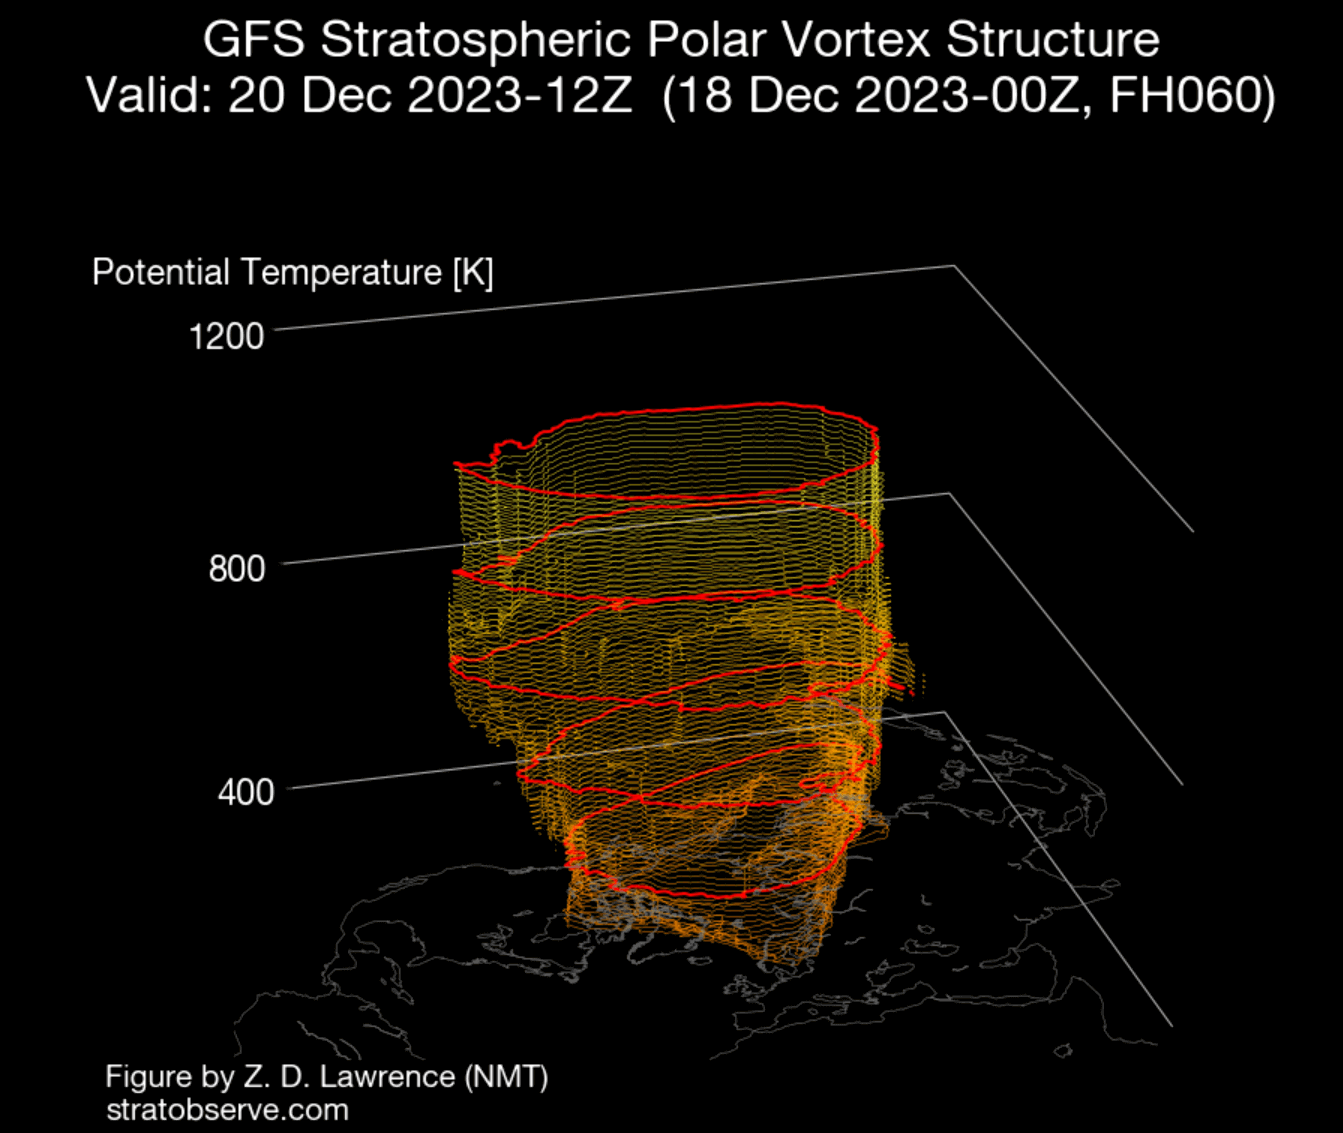
stratospheric-polar-vortex-3-dimensional-structure-north-hemisphere-december-analysis

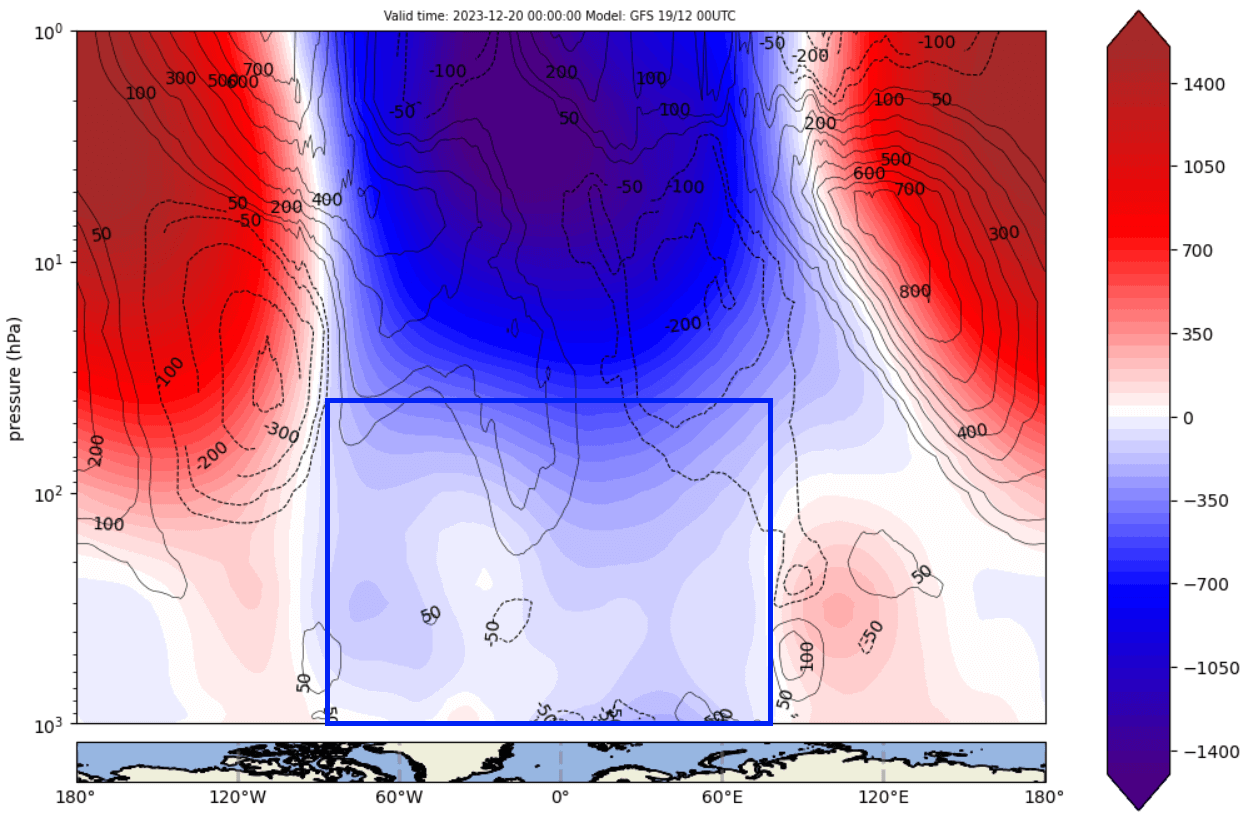
The vertical pressure anomaly structure can directly reveal the connection between the stratospheric polar vortex and the lower levels.

Below is the vertical pressure analysis from the ground up to the top of the stratosphere (45km/28 miles). You can see the strong negative anomalies over Greenland and the polar regions, connected all the way to the surface levels. The strong low-pressure anomaly above is the core of the polar vortex.
weather-forecast-north-hemisphere-united-states-cold-pressure-anomaly-atmosphere-vertical-profile-warming-event

You can also see the high-pressure anomaly surrounding the polar vortex over the entire stratospheric level. This is what is pressing against the polar vortex, also affecting its structure and the weather at lower levels.

This can be seen in the weather pattern analysis below. It shows the pressure anomalies across the Northern Hemisphere. You can see the concentrated low-pressure area over the polar regions, which is acting like the “foot” of the stratospheric polar vortex.
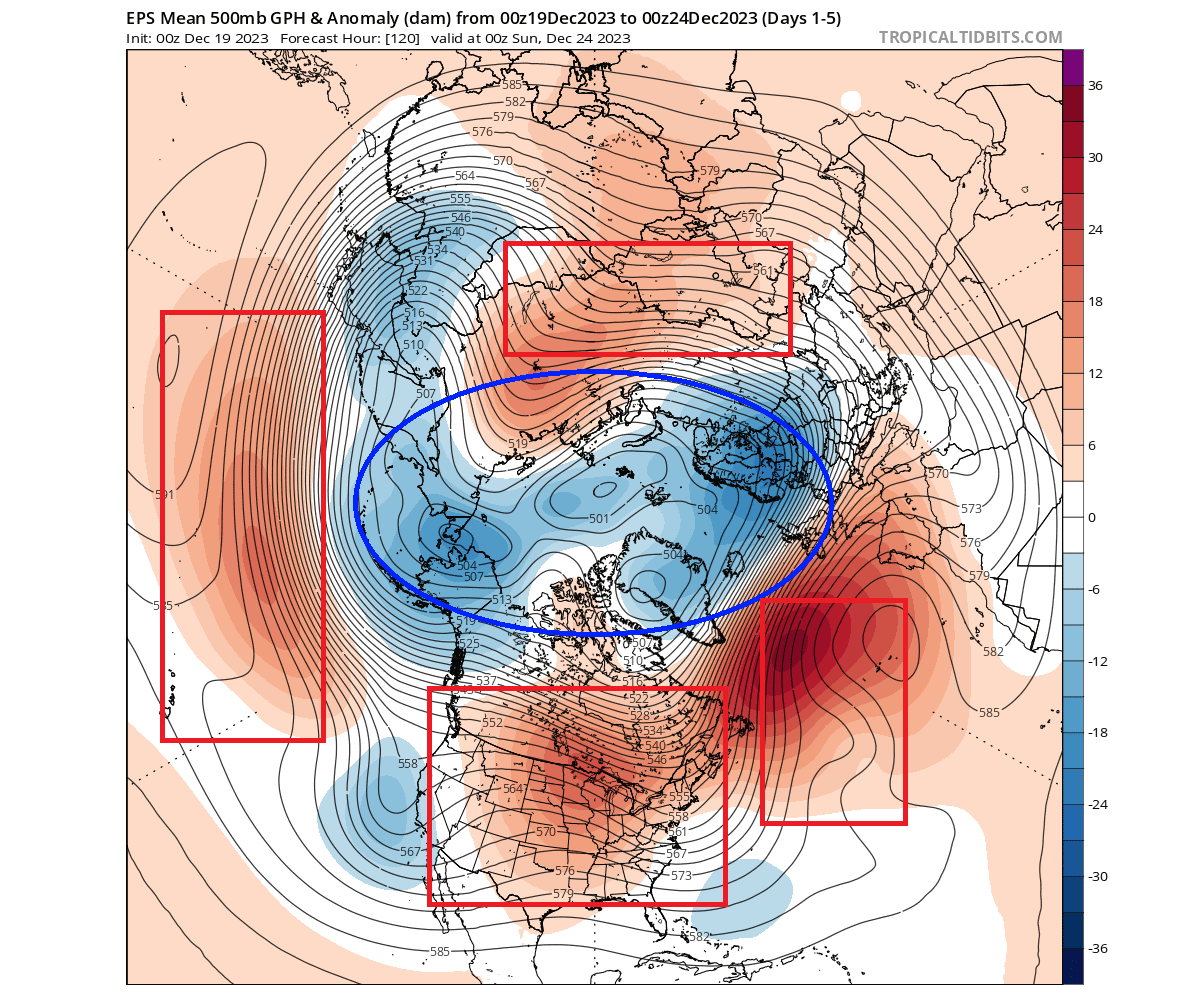
weather-forecast-5-day-december-north-hemisphere-united-states-pressure-pattern-ecmwf-ensemble

That, of course, affects the temperatures around the northern hemisphere. With a “locked-in” low pressure are over the poles, the colder air has a hard time to escape. That allows the unusually warm air to enter the mid-latitudes, creating warmer anomalies across the United States and Europe.
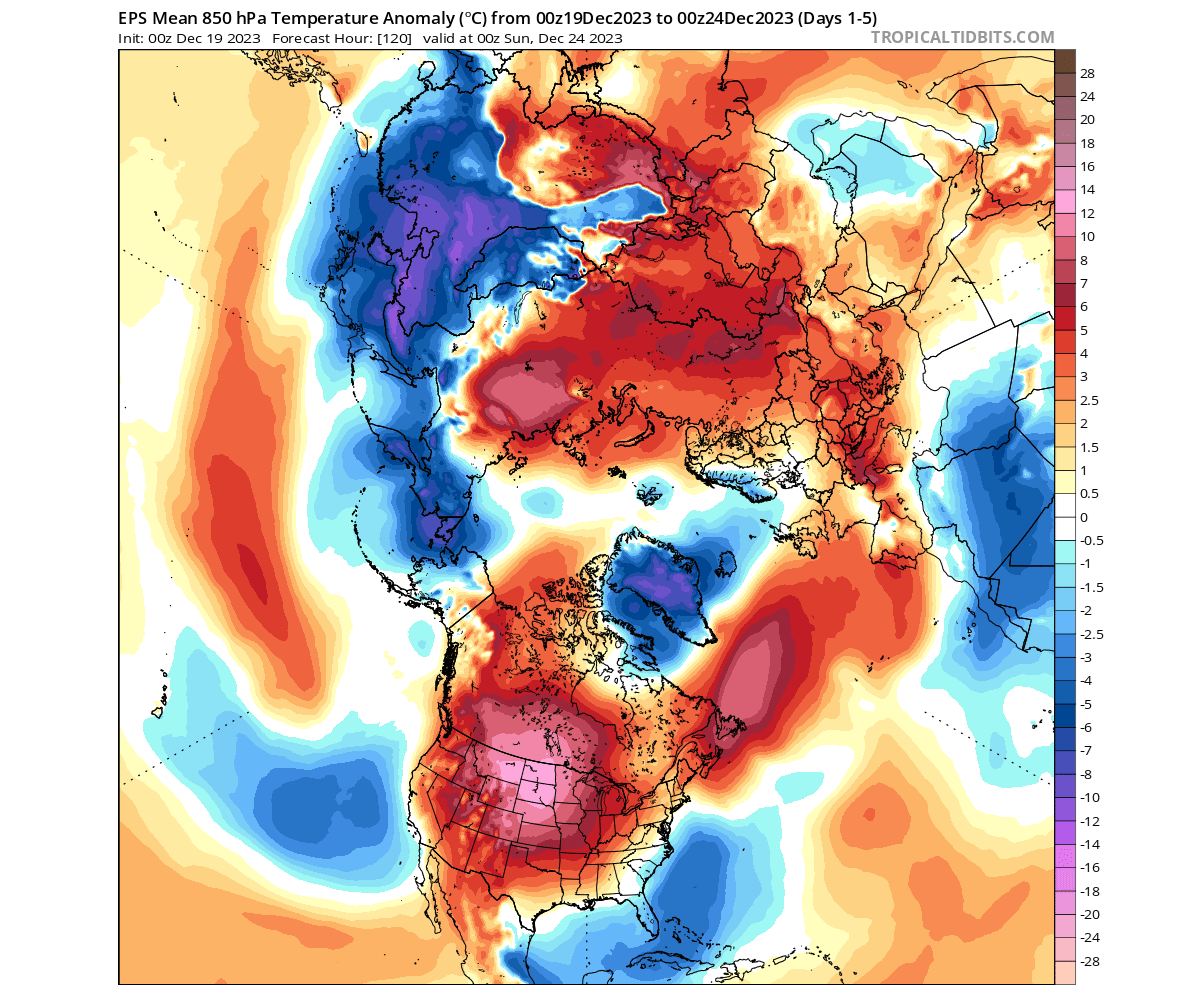
weather-forecast-5-day-december-north-hemisphere-united-states-temperature-pattern-ecmwf-ensemble

The reason we showed you this is to reveal the connection and importance of the stratospheric polar vortex and its link with the weather at the surface.

It is very important that we monitor the state of the Polar Vortex, as it can have a profound impact on our daily weather. We mainly separate the Polar Vortex into two different modes:

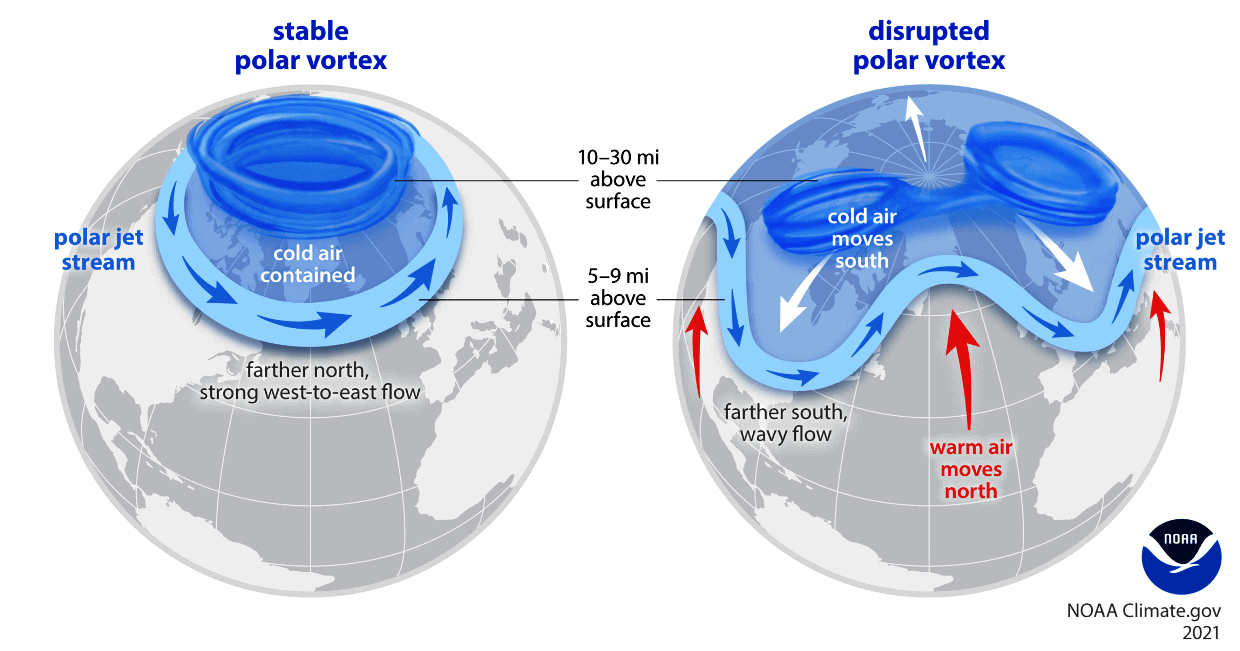
A strong/stable Polar Vortex usually means strong polar circulation and jet stream. This contains the colder air into the Arctic Circle, creating milder conditions for most of the United States.

In contrast, a weak/disrupted Polar Vortex creates a weak jet stream pattern. As a result, it has a harder time containing the cold air, which can now escape from the polar regions into the United States or Europe. Image by NOAA.
weather-forecast-north-hemisphere-what-is-polar-vortex-strong-weak-circulation-winter-pattern-jet-stream-anomaly-stratosphere-and-cold

So, if you want cold and snow during Winter, and you live in the central or eastern United States, your odds are highest with a weak Polar Vortex. In nature, that means a heavy disruption of the jet stream and a release of cold air from the polar regions.

For this reason, we closely monitor the strength of the polar vortex and all the changes around it. This is even more important when there are sudden changes in the strength of the polar vortex, with potential warming events.
 

THE WINDS OF CHANGE

 
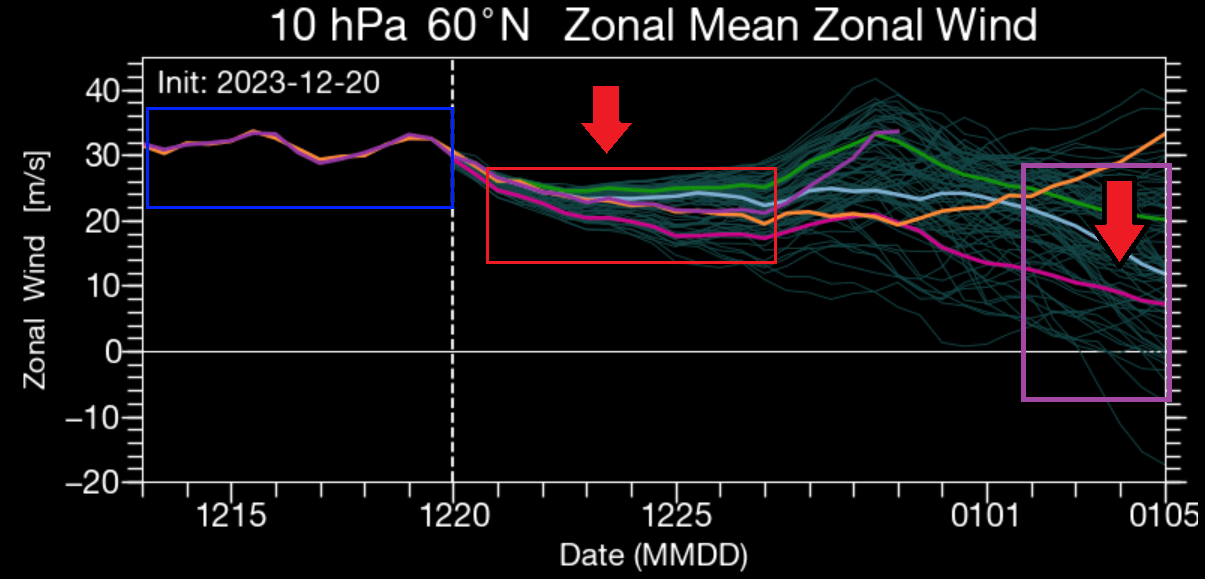
But how do we measure the strength of the stratospheric Polar Vortex? The simple answer is the winds. The more organized the stratospheric polar Vortex is, the stronger the winds inside it, which means it can have a stronger influence on the surface.

The image below shows the wind analysis and forecast for the next two weeks in the mid-stratosphere. You can see the current state of the polar vortex in the blue zone. It was fairly stable and average in strength. But notice the upcoming weakening in the coming days.
winter-polar-vortex-wind-speed-ensemble-extended-forecast-stratospheric-warming-event-2024

After that, there is a slight recovery, but going into 2024, an even stronger weakening is forecast, that might lead to something bigger. When the zonal (westerly) westerly winds in the stratosphere reach zero or negative values, it means a circulation reverse.

This signals a disruption or even a breakdown of the stratospheric polar vortex, known as the Sudden Stratospheric Warming event. These effects usually transfer down to the lower levels, with some delay, heavily altering the weather patterns.

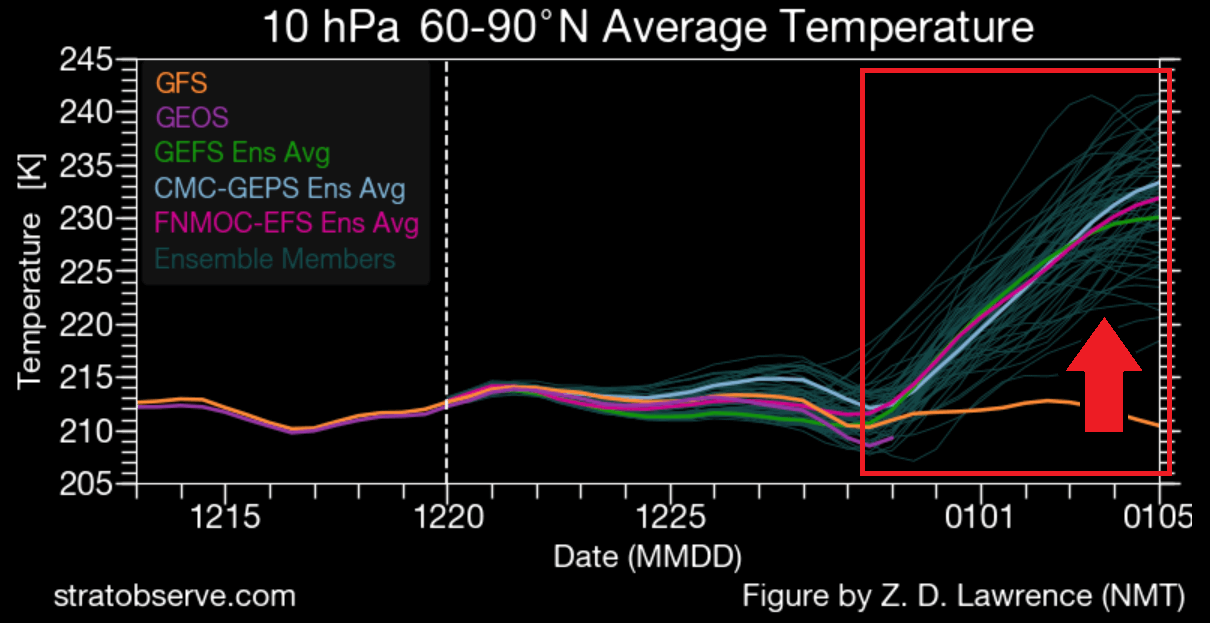
The temperature forecast for the stratosphere shows a strong rise in temperatures going into 2024. Combined with a reduction in westerly wind speeds, it indicates a major slowdown of the polar vortex, combined with a warming event.
winter-polar-vortex-temperature-ensemble-extended-forecast-stratospheric-warming-event-2024

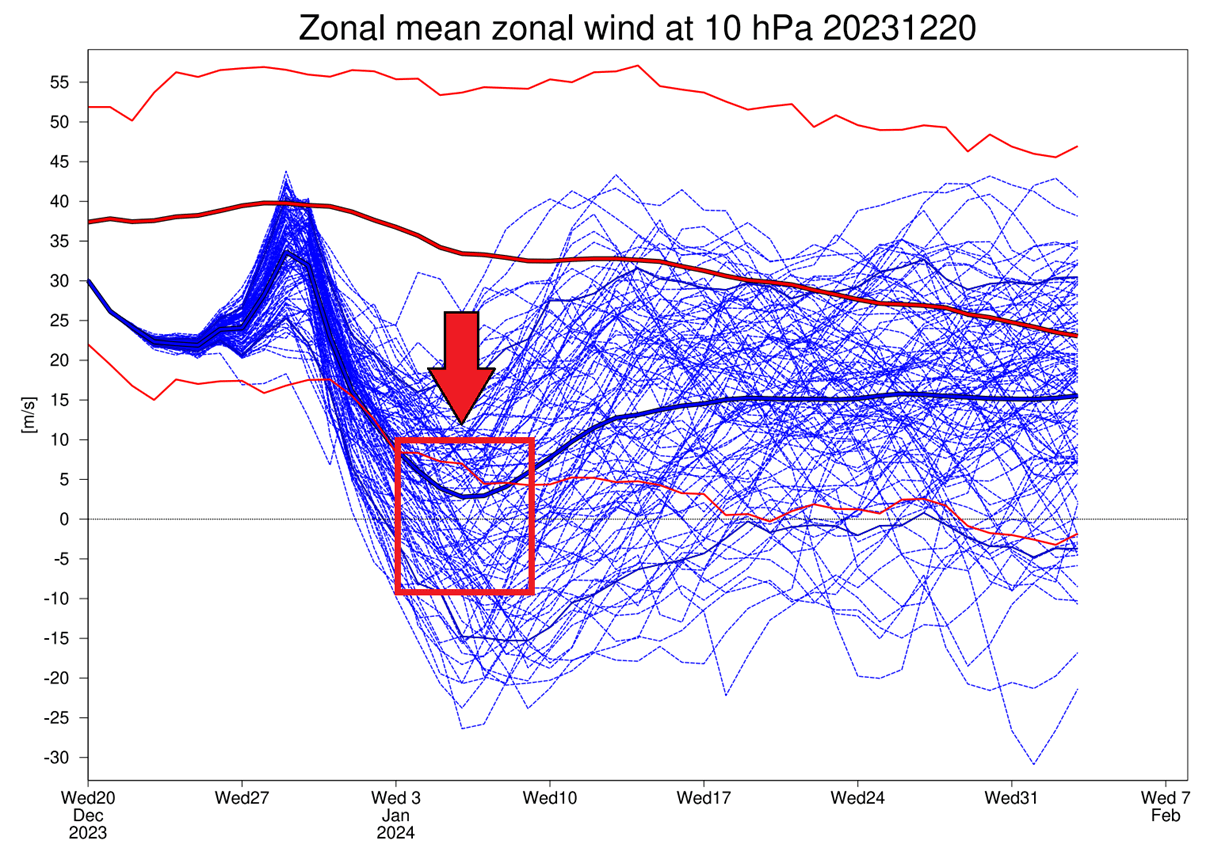
Another model that we often look at is the ECMWF, and it also has an extended forecast. You can see it in the image below, and it shows a very strong polar vortex slowdown in early January. The average line is close to zero, indicating a strong tendency of a full polar vortex collapse event.
winter-polar-vortex-wind-speed-ecmwf-ensemble-extended-forecast-stratospheric-warming-event-2024

If we look at the polar vortex forecast in the early days of January, we can see a very strong high-pressure area in the stratosphere, sometimes called the “anti-vortex”. You can see a very strong warming wave occurring where they come together.
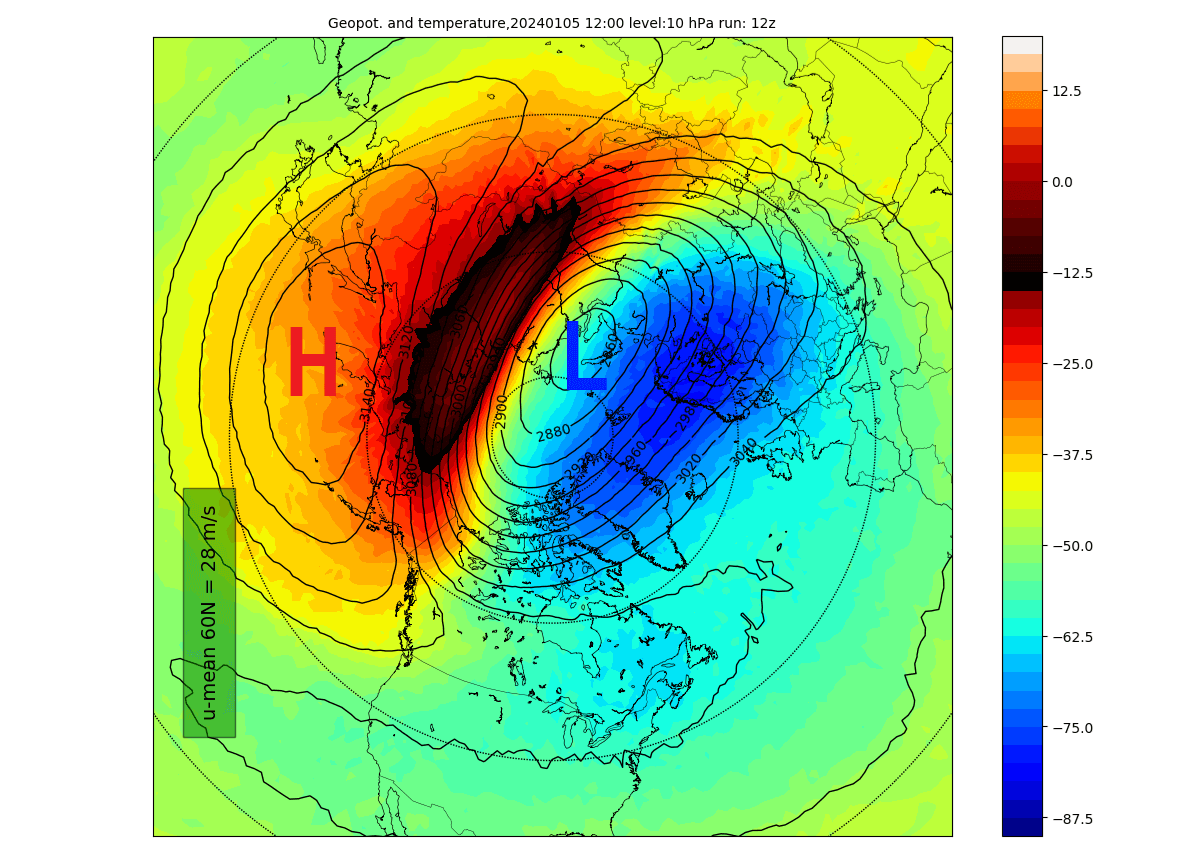
winter-polar-vortex-north-hemisphere-forecast-temperature-pressure-10mb-stratospheric-warming-event-begins-january-2024

That is the start of a substantial stratospheric warming event and an important weakening for this time of year. But how does such an abrupt weakening of the Polar Vortex even happen? We will look more closely at this event and how it can change our daily weather.

The ECMWF model shows the same pattern for the first week of January. You can see it in the image below. A strong stratospheric high-pressure area and a substantial warming wave anomaly.
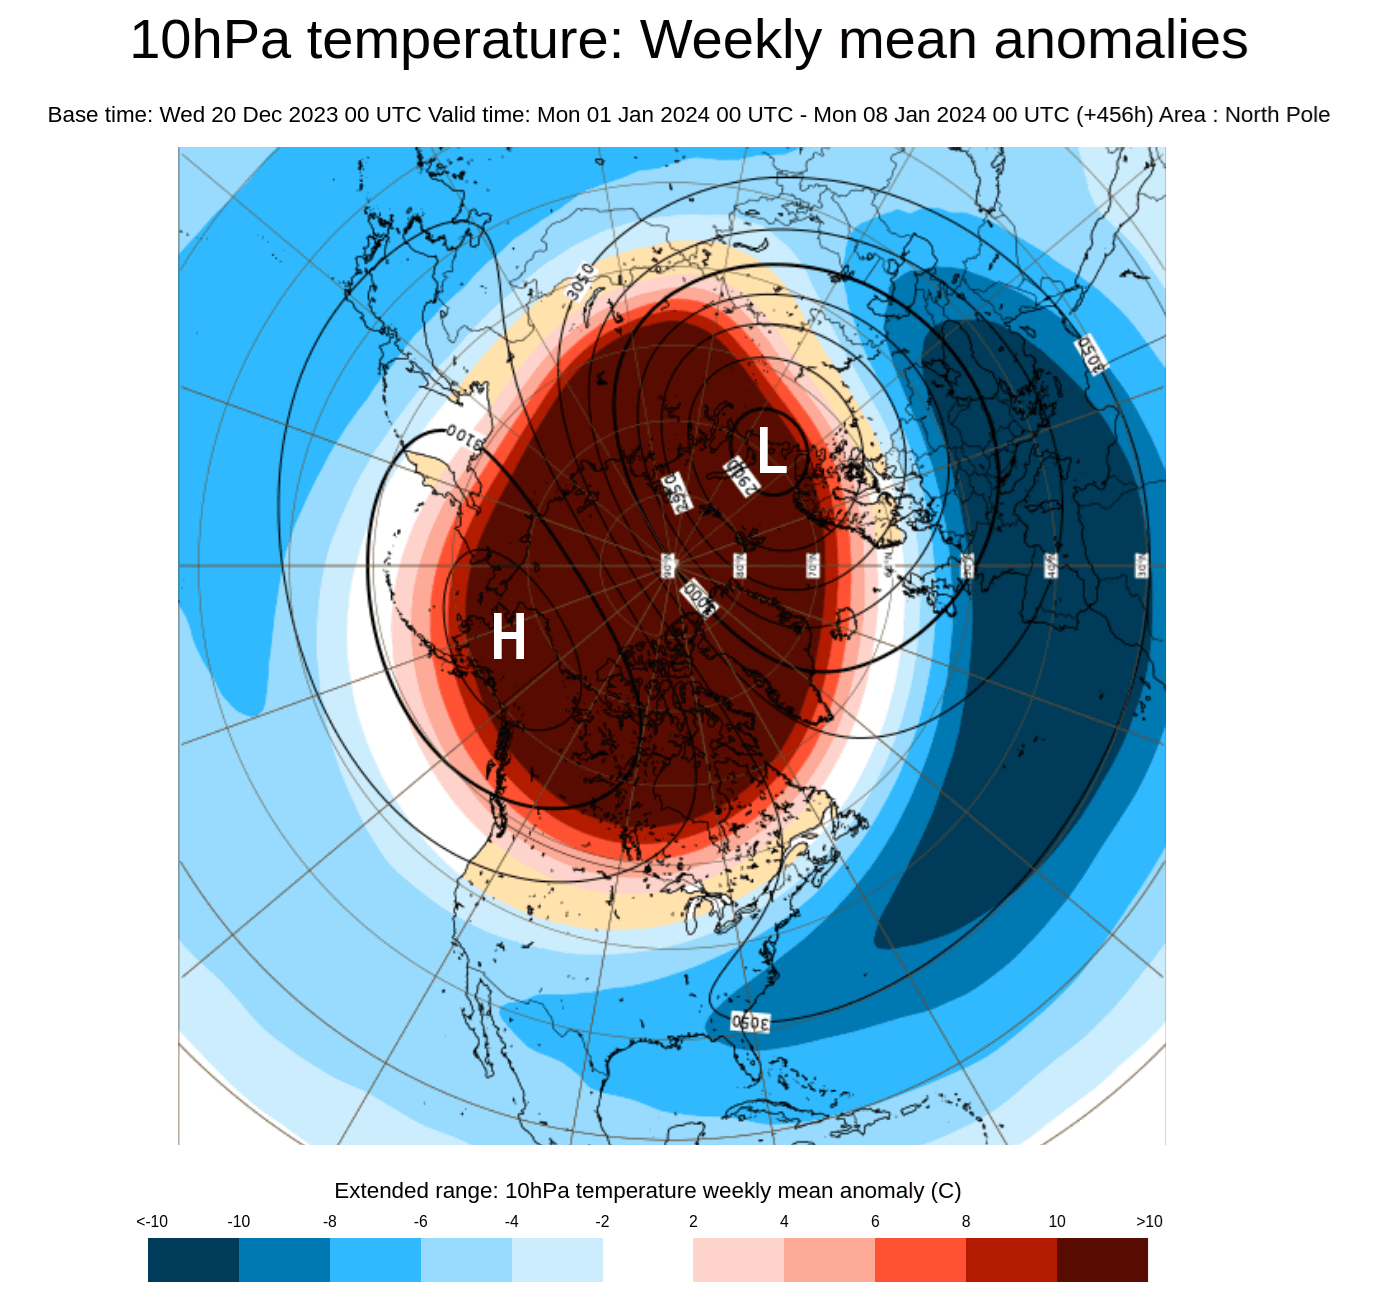
stratospheric-polar-vortex-north-hemisphere-forecast-early-january-winter-temperature-pressure-ecmwf

The GEFS model from the United States NCEP center also shows a substantial warming wave developing. In the image below, you can see the stratospheric temperature anomalies for early January. Inside the warming wave, you can find temperatures 40 (72F) degrees Celsius higher than normal for this time of year.
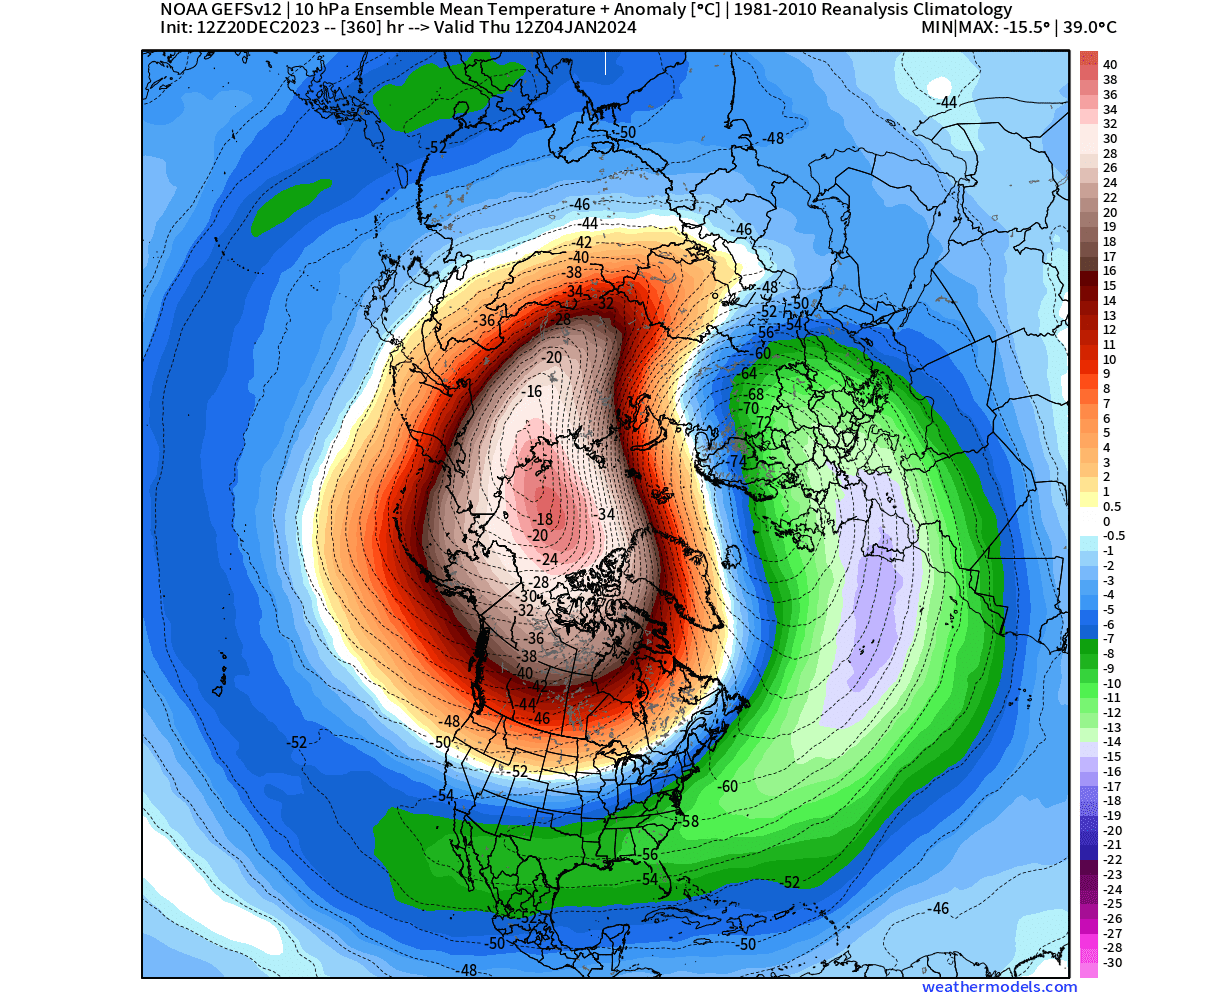
stratospheric-polar-vortex-north-hemisphere-forecast-early-january-winter-temperature-pressure-gefs

To add another model into the mix, we have the UKMO extended forecast. It shows the stratospheric wind speed forecast. It also shows a significant weakening of the polar vortex in early January.
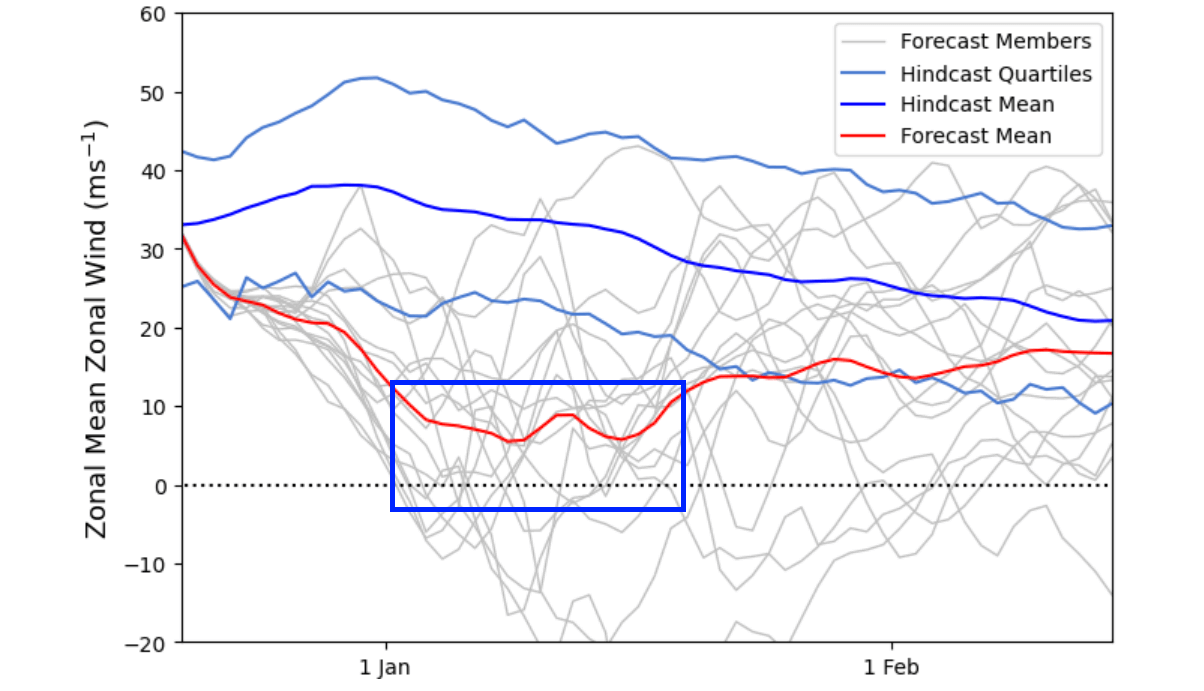
winter-polar-vortex-wind-speed-ukmo-ensemble-extended-forecast-stratospheric-warming-event-2024

So, to recap, we have major signs from different forecasting systems that a major shift in the stratosphere is coming for the polar vortex. Based on what we know, a weak polar vortex has the power to substantially change the weather patterns across the United States and the rest of the Northern Hemisphere.

The stratospheric warming event is still many days away, and a full wind reversal is not yet confirmed at the moment. But we will still look at what we usually expect from stratospheric warming events and what the latest forecasts show for early 2024.
 

MID-WINTER POLAR VORTEX COLLAPSE EVENT

 
Sudden Stratospheric Warming basically means a strong temperature and pressure rise in the Stratosphere. That causes a major disturbance in the circulation and, as a result, starts a collapse of the Polar Vortex.

Below, we have a typical vertical progression during a stratospheric warming event. You can see the main event in the stratosphere slowly affecting the surface layers below over a certain time period. In nature, it usually works in the way of the high-pressure anomalies coming down from the stratosphere to the surface.
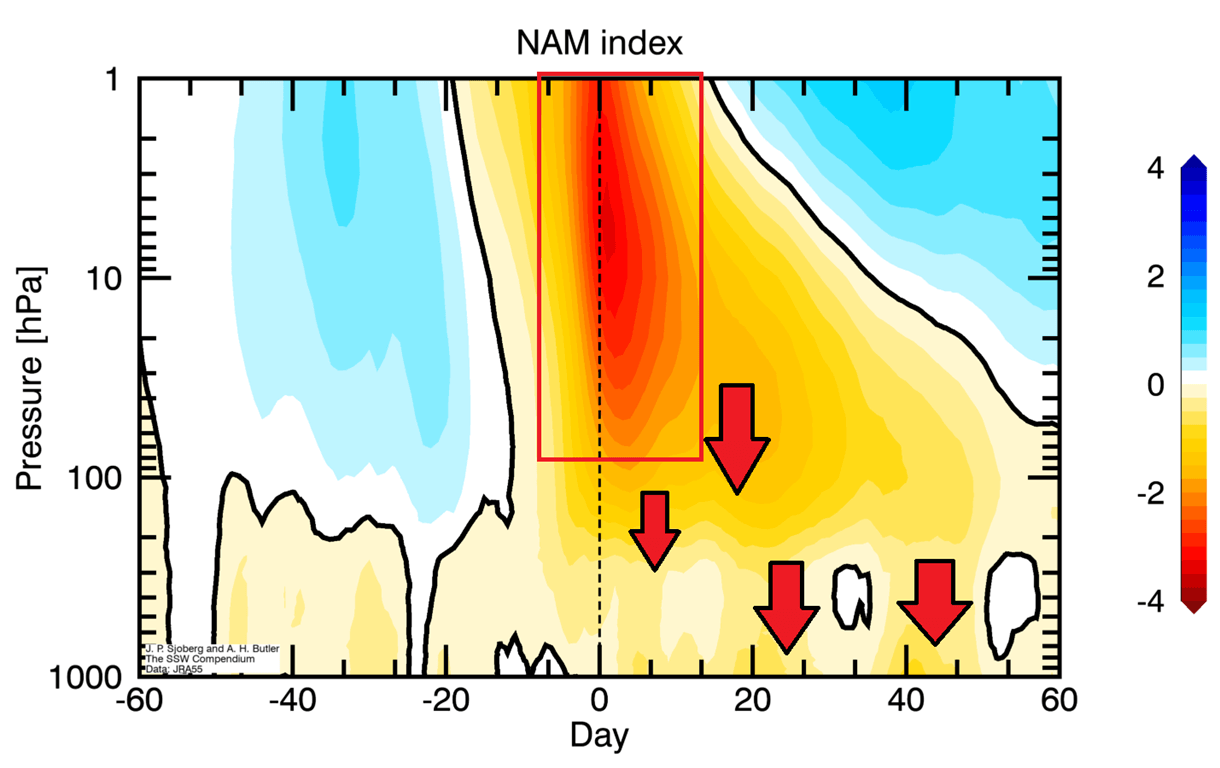
stratospheric-warming-event-atmosphere-vertical-pressure-anomaly-change-united-states-canada-pattern

You can see the pressure patterns 0-30 days after a stratospheric warming in the image below. This is an average image of several different events, but it gives an idea of what we can usually expect. You can see the high-pressure area over the polar region.
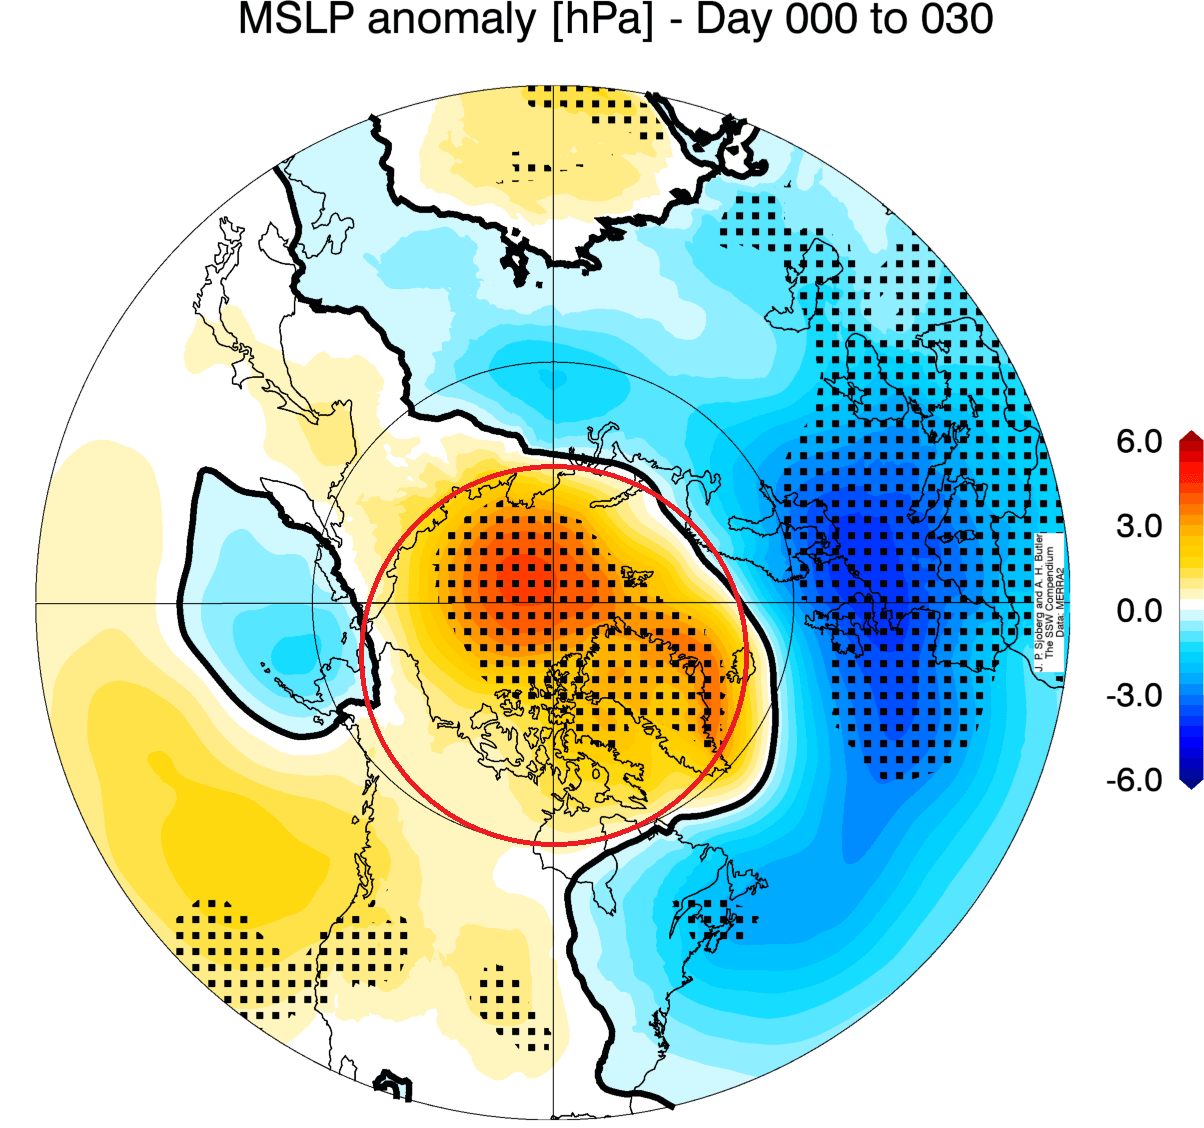
polar-vortex-weather-pressure-weather-impact-united-states-stratospheric-warming-2024

That means a weakened jet stream and low-pressure systems from the eastern United States across the North Atlantic and Europe. This helps to unlock the cold air from the Arctic, sending it towards the United States, as you can see in the image below.
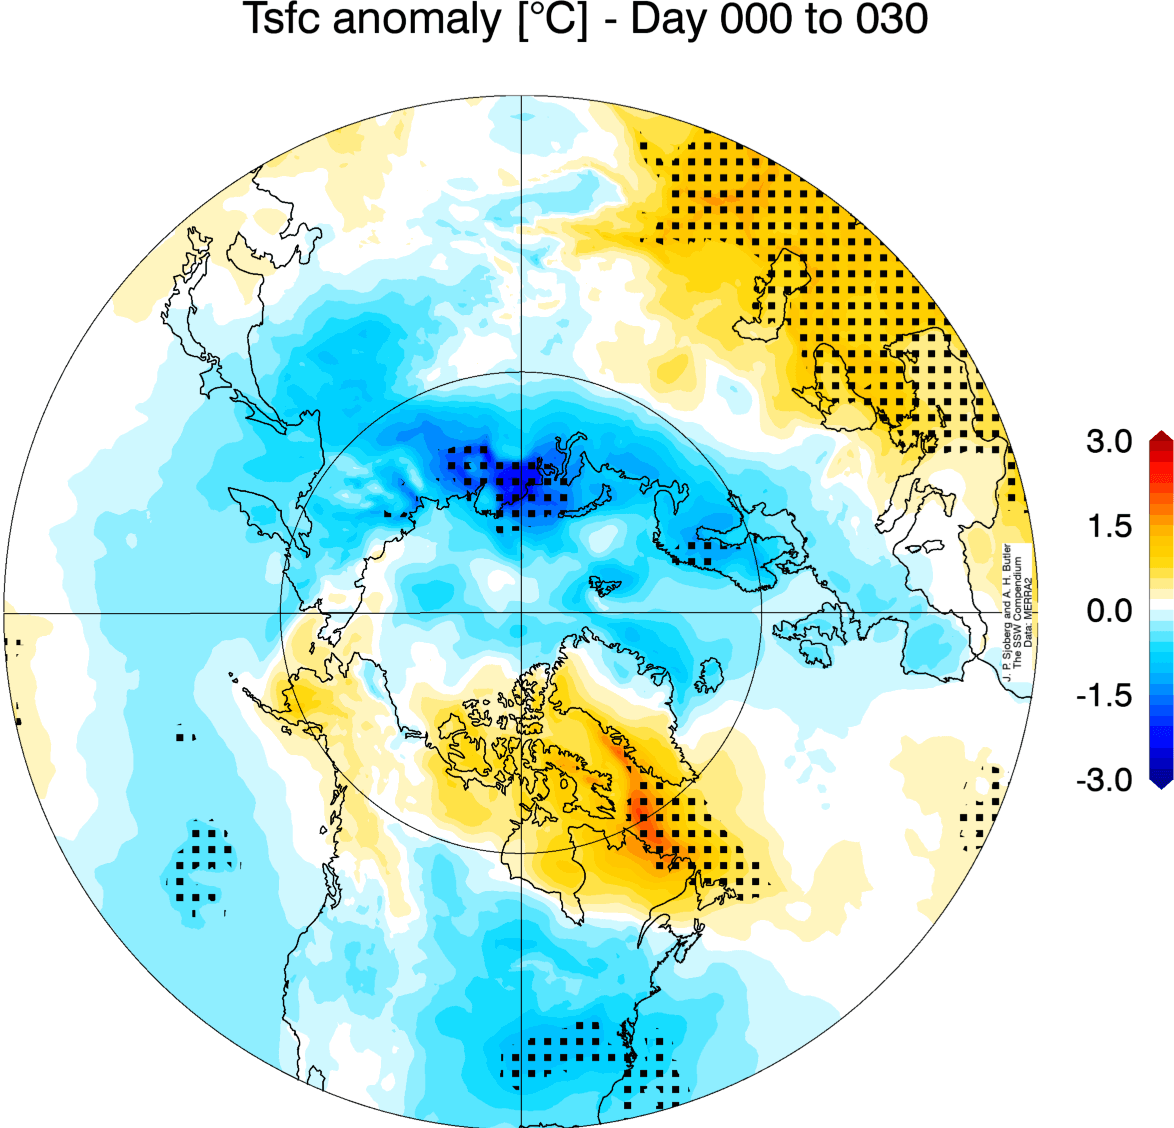
stratospheric-warming-event-surface-weather-temperature-change-united-states-canada-pattern-anomaly-2024

The images above show an average picture of many SSW events. Each stratospheric warming event is different and does not automatically mean a strong winter pattern.

So, what is currently shown in the weather pattern forecast for January?
 

NEW YEAR BRINGS WINTER WEATHER

 
We wrote two articles on the subject of weather pattern change in January. The latest article will be linked below. But if we make a quick summary, there were already early signs that a significant winter pattern change is in the works for January.

The stratospheric warming event is one of the strong candidates (with El NiƱo) to help push the weather pattern into a more wintery mode.

Below is the surface pressure anomaly in the first half of January, by one of the extended forecasts. You can see an oddly strong resemblance to the surface pressure pattern we just showed above, following stratospheric warmings.
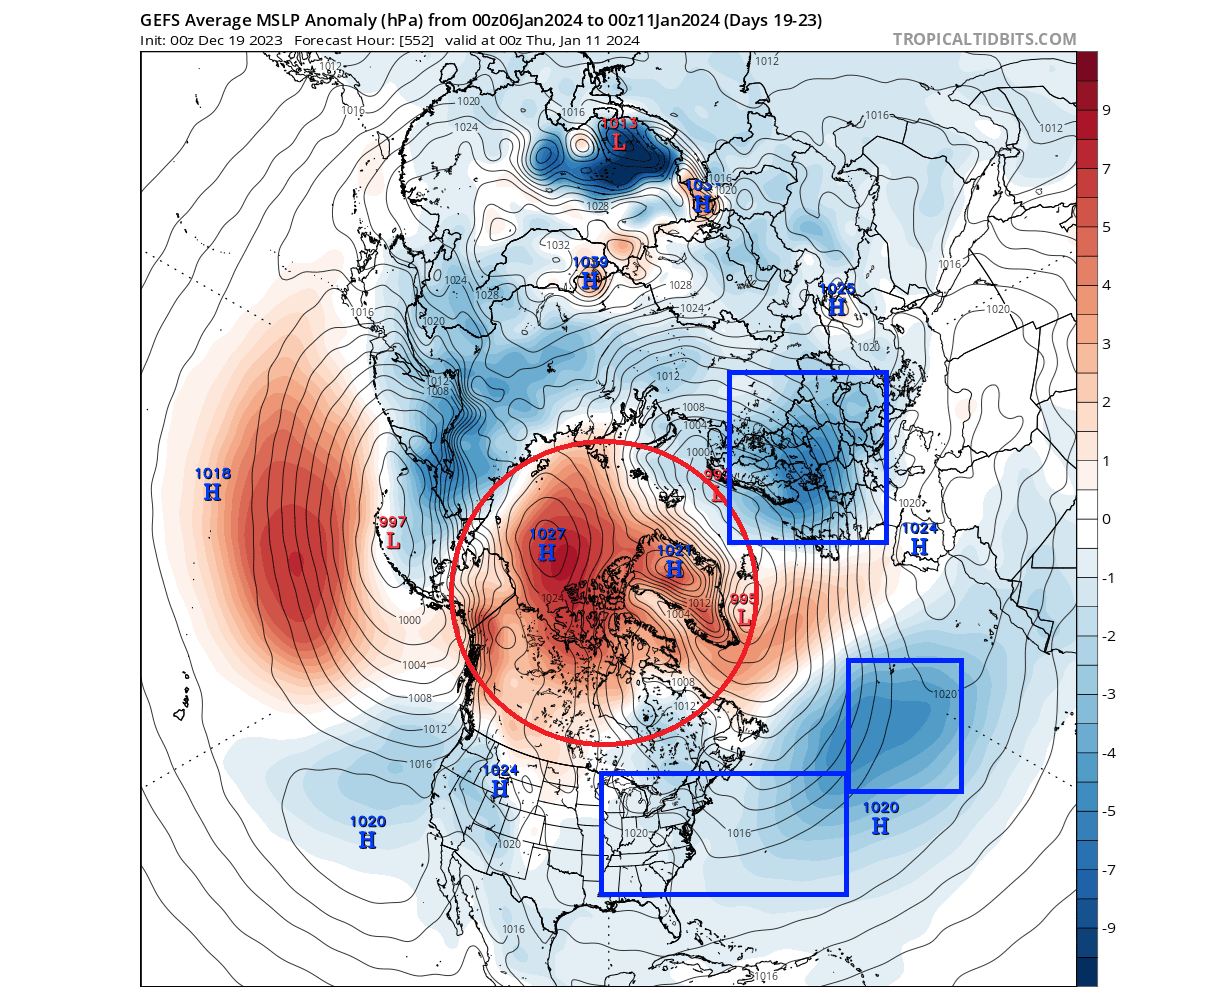
winter-forecast-january-surface-pressure-anomaly-pattern-gefs-united-states-canada-extended-early

You can see the high-pressure over the pole and low-pressure areas over the United States, North Atlantic, and northern Europe. This is not necessarily a direct result of the stratospheric dynamics, but the whole system is connected and reflects changes from above to below and vice-versa.

The temperature pattern for this same period shows a colder anomaly over the United States, with a focus on the eastern United States. Such a temperature pattern would be expected after strong stratospheric dynamics.
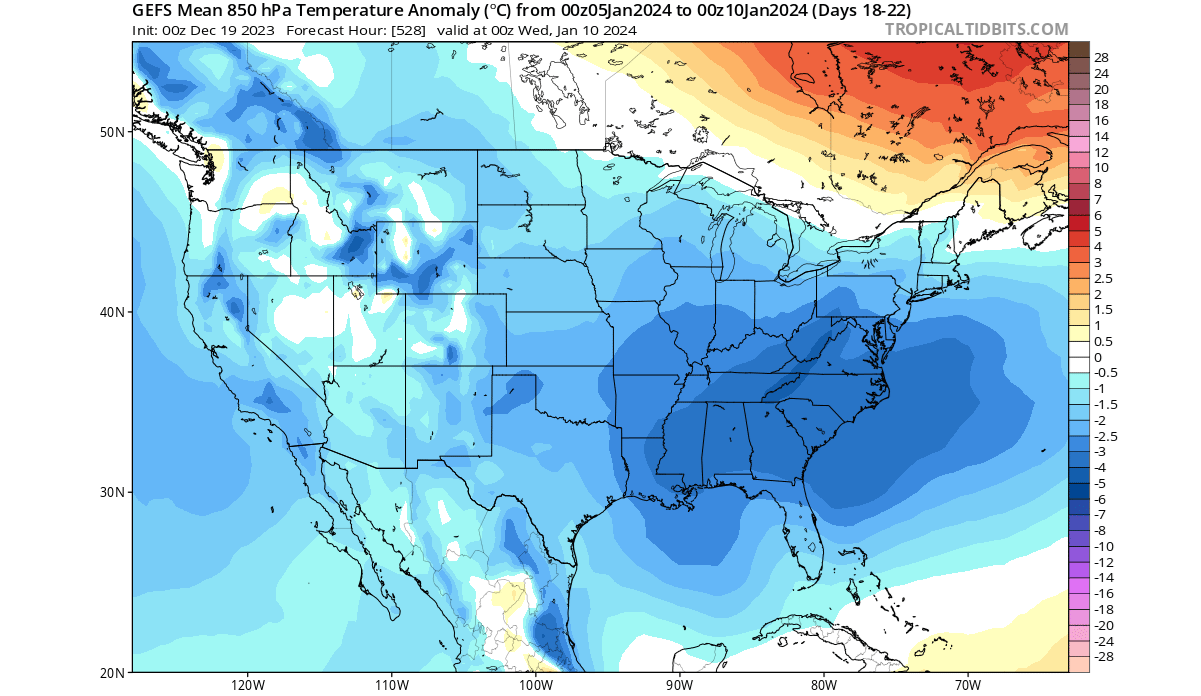
winter-forecast-january-surface-temperature-anomaly-pattern-gefs-united-states-canada-cold

Over Europe, we do not see a major cold anomaly, but there is also no strong warm anomaly being forecast. With a high-pressure anomaly over the northern parts, a northerly flow can be expected at least towards mid-month if not sooner.
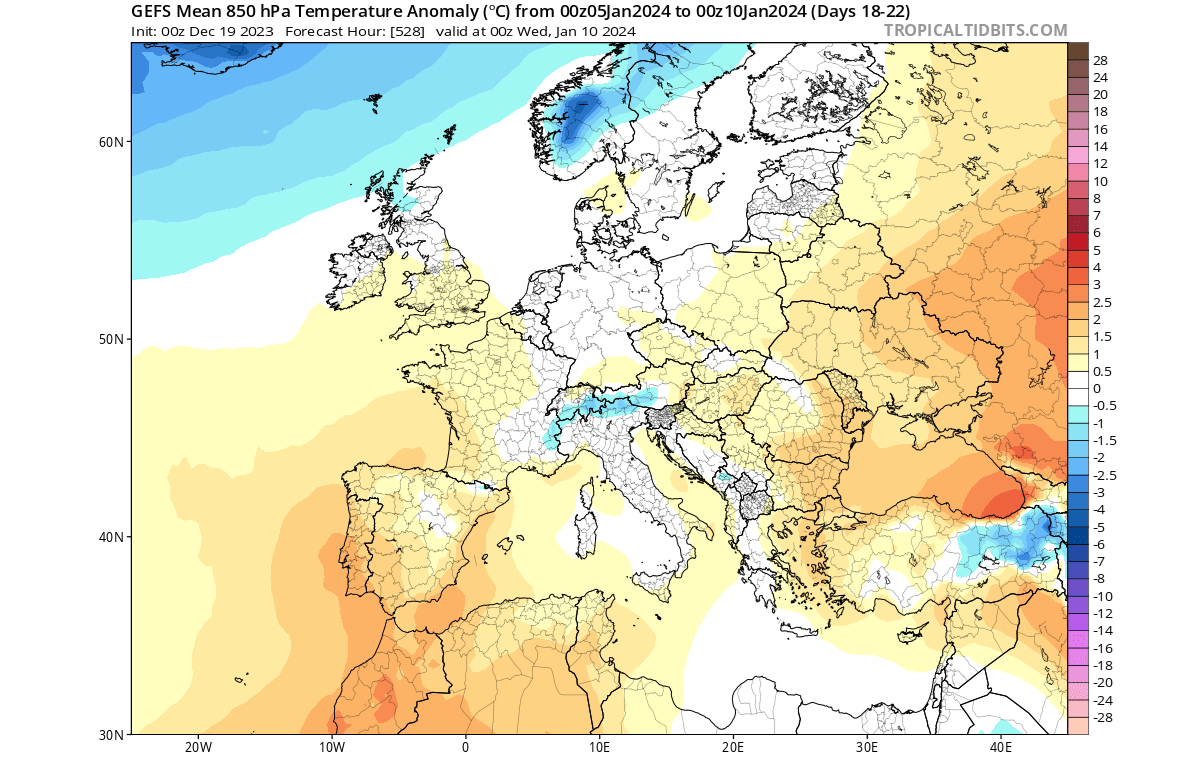
winter-forecast-january-surface-temperature-anomaly-pattern-gefs-europe

We also have to look at the ECMWF extended forecast, as it also shows strong stratospheric dynamics. Below is the pressure anomaly forecast for the second week of January, and you can nicely see the high-pressure area over the polar regions and low-pressure anomalies across the United States and Europe.
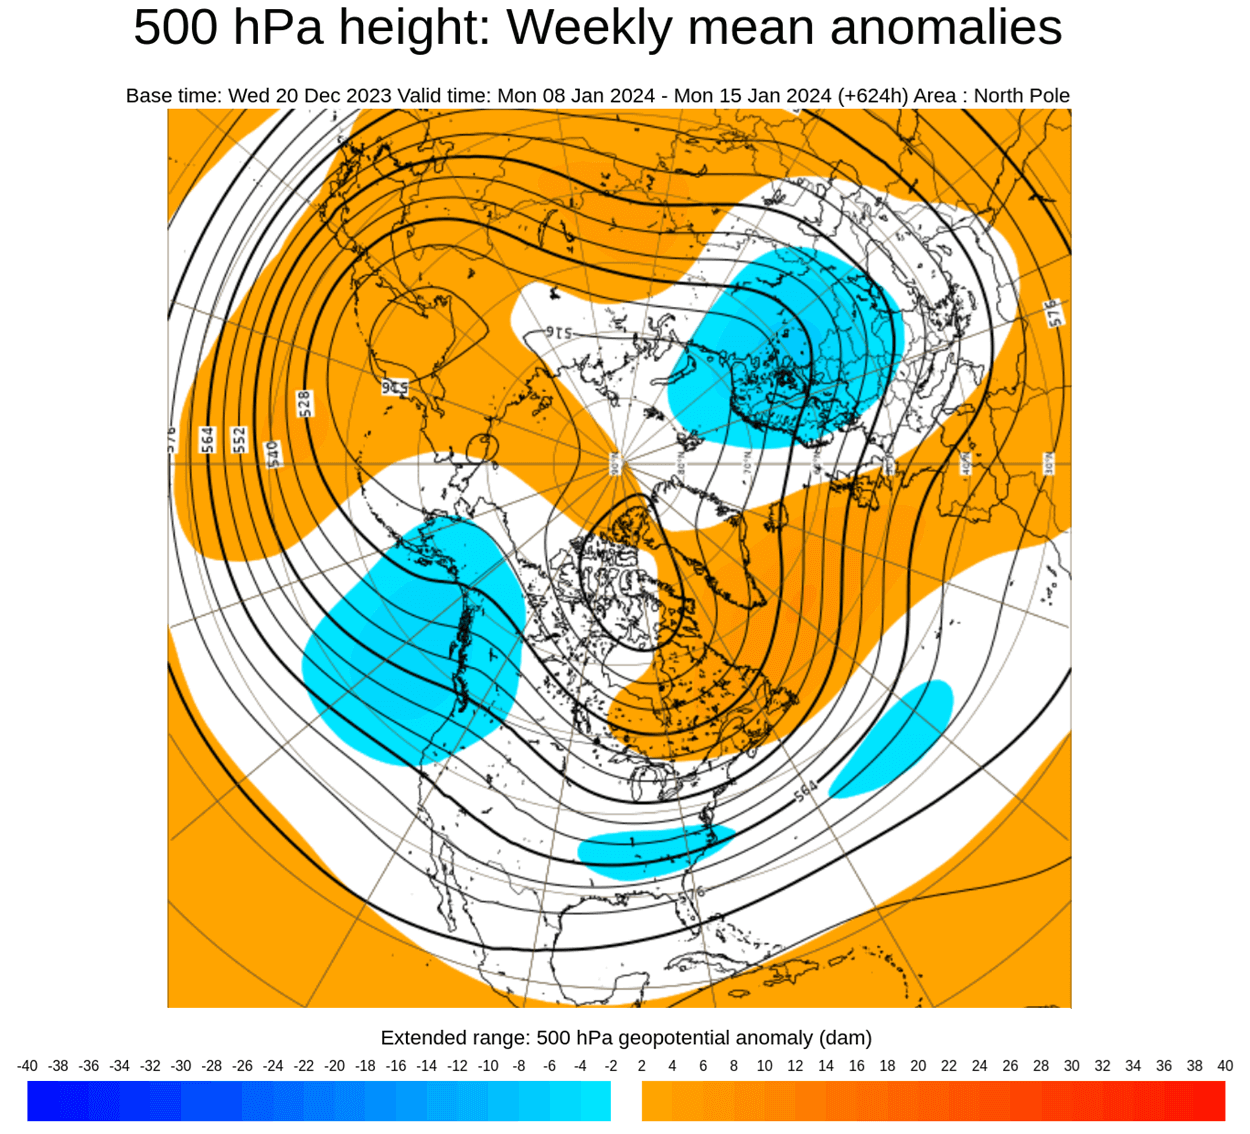
winter-forecast-january-500mb-pressure-anomaly-pattern-ecmwf-united-states-canada-extended-early

This indicates a weak vortex event and is consistent with the forecast of a strong warming event occurring in the stratosphere.

The surface temperature for the second week of January shows cold anomalies over the United States, with the exception of the upper Midwest. It is too early to talk specifically, but such a pattern would be supportive of some good winter weather across the eastern United States.
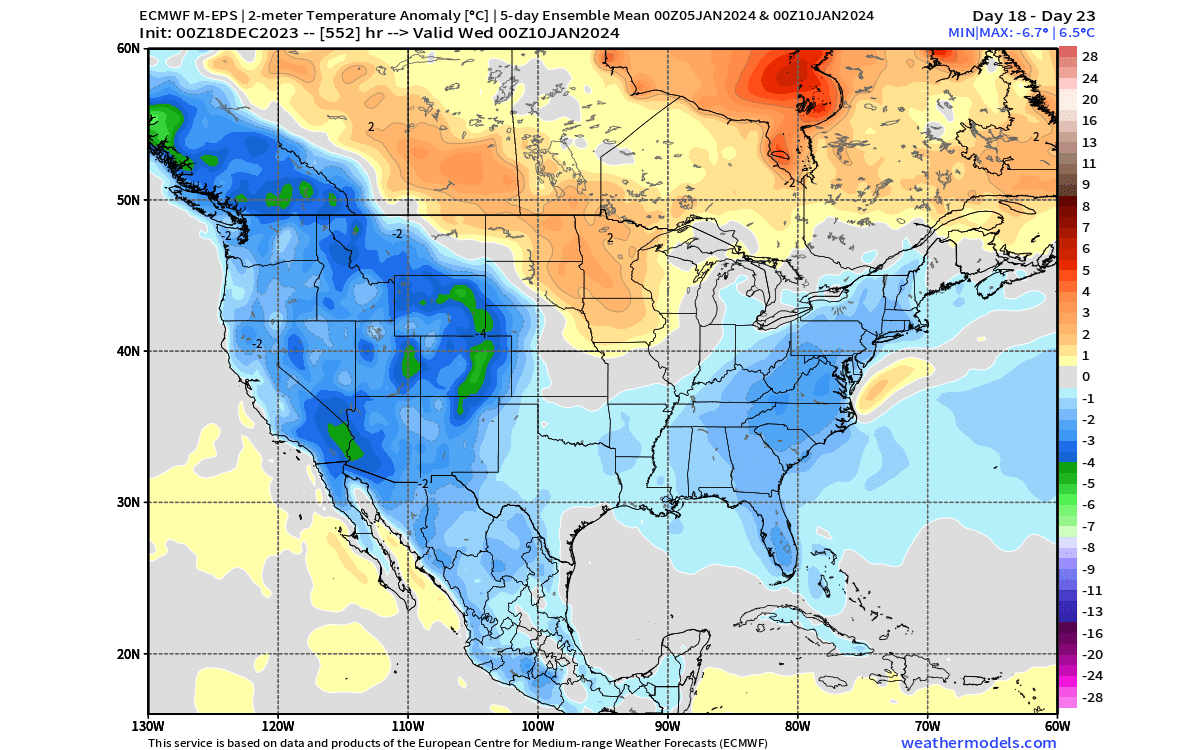
winter-forecast-january-surface-temperature-anomaly-pattern-ecmwf-united-states-canada-cold

It is too early to talk specifics, as this is the extended forecasting range, so we are only looking at trends. But with everything considered, January is shaping up to show a completely different weather face compared to the much warmer December.

We will keep you updated on the global weather pattern development, so bookmark our page. Also, if you have seen this article in the Google App (Discover) feed, click the like button (♥) there to see more of our forecasts and our latest articles on weather and nature in general.

January weather pattern change:

A long-lasting Winter shift in January and February is now seen across the eastern United States in the latest long-range forecast data

12/21/23

 The Whitest of Christmases and Other Christmases Past and Chances - 2023for a White Christmas - 2024

Frequently during the Christmas Season, meteorologists are asked; Are we going to have white Christmas?  Generally, it is agreed among meteorologists that in order to "officially" have a white Christmas, an average of an inch of snow must cover the ground Christmas morning /7AM/, but not necessarily have to fall on Christmas.

Christmas of 2023 was a total waste as far as white Christmas with unseasonably mild weather with temperatures in the 50s!
 
Christmas 2022; a cold blast accompanied by several inches of snow fell a few days before and on Christmas across Southeast Lower Michigan making for a white Christmas but with brutally cold wind chills well below zero.
  
On Christmas /2021/ we ended up with no white Christmas. Christmas 2020; we lucked out with generally an inch or two of snow falling over the region on Christmas Eve into Christmas morning. A nice picture-perfect light snow cover.
 
Christmas /2019/ no white Christmas was to be had - and also back in 2018; around Metro Detroit there was no white Christmas. In fact; temperatures pushed up into the 40s and 50s in the few days following Christmas. Further north from the Flint area into the Saginaw Valley and Thumb Region however; a inch or two remained on the ground for a white Christmas across that region.

Over the years, extreme Southeast Lower Michigan has averaged just under a 50 percent chance for a white Christmas.  Some years it's already on the ground, some years not, some years it melts while other years it falls on the day. However, theoretically, you could actually have nothing on the ground Christmas morning and have a snowstorm dump a foot on the region during the day and still have NO official white Christmas under the standing morning rule. It works the other way too; you could have a several inches on the ground at 7am 12/25 but warmer air and/or rain melts it away by afternoon or evening and still officially have a white Christmas.

Four years ago /2017/; an unexpected white Christmas was had in spades as low pressure system overachieved; developing robustly over the southern Great Lake/northern Ohio Valley. The system developed into a notable little snowstorm falling mainly on Christmas Eve over the southeast area as seen in this map, bringing snow for a picturesque, classic Christmas scene. The only negative - and a notable one - was the lousy driving conditions Christmas Eve into early Christmas Day but with improving conditions later for Christmas dinnertime.


For more on the system from the NWS; see here.

In 2016; even with mild weather with temperatures in the 30s; Southeast Lower Michigan was able to hold on to a white Christmas as the snow (generally 2-5") slowly melted. In fact; the day after Christmas, warm air surged into the region and pushed temperatures into mainly the 50s and took care of any remaining snow! Back in December /2015/; it was a mild and snowless Christmas with a high temperatures near 50. Of course, the year before, /2014/ contained our record breaking warm El Nino December, therefore the hopes for a white Christmas were low anyway. Back on Christmas 2014, the chances for a white Christmas were very similar to 2015 with record setting low amounts of snow for the month (in the top 5 snowless). Officially on 12/25/14 at 7am; no snow was on the ground with a trace of light rain on the date. Only a TRACE of snow had fallen up to that day in December /0.1 for the entire month/.  Most areas over the remainder of Southeast Lower Michigan had a few tenths of snow Christmas eve or Christmas but with less than the amount needed and mild temperatures rising into the upper 30s to around 40...none of the area saw a white Christmas.

More Previous Christmases back to 2004:

In 2013;  even with all the snowfall throughout last winter, officially on 12/25/13 at 7am Detroit Metro Airport had only a TRACE of snow on the ground. Most areas into the remainder of Southeast Lower Michigan had some residual snow and ice on the ground for a white Christmas. Back in 2012, enough snow did fall at Detroit Metro Arpt (an inch of fresh snow Christmas Eve) to make it an official white Christmas was on the ground as of 7AM. The necessary inch or more was also on the ground at both Flint and Saginaw. Ironically the day after Christmas, the best snowstorm of the winter season hit the region...a day late and several inches short for Christmas. A year earlier in 2011, it was a relatively mild Christmas with temperatures in the 40s and no snow on the ground; so no white Christmas. However back in 2010; residents across Southeast Lower Michigan did enjoy a white Christmas with generally 1” to 6” of snow across as temperatures hovered in the 20s. Then further back in 2009, much of the Detroit area south did not have a white Christmas but points north across Flint, Saginaw and the thumb region generally had a 1” to 3” snow cover. Back in 2008, we saw a “sloppy, melting white” Christmas. That white Christmas involved the melting of a heavy snow cover from past snows that accumulated throughout December. The best of the snowstorms came before Christmas on the 19th (with another, lesser intense snow falling on the doorstep of Christmas, 23rd -24th). After, however, the heavy snow cover melted in earnest as milder air overspread the region Christmas Eve right through the 26th. Christmas of 2007, saw temperatures rise into the mid 40s to mid 50s a couple of days prior to Christmas and that, combined with light rain, pretty much took care of any hopes for a white Christmas as then, like the later Christmas of 2008, the  previous heavy snow cover melted (but this time in its entirety before Christmas). Some scattered light snow did return, skirting the landscape on Christmas Eve but most areas around Southeast Lower Michigan still only had a trace of snow for Christmas. At White Lake and Saginaw, however, the official inch of snow to make it a white Christmas was barely attained in 2007.

Going back further to the Christmas of 2006; it was also mild and therefore, there was no white Christmas. In 2005, we just barely squeaked out a white Christmas (at Detroit Metro Airport, anyway) as a mild spell moved in just before Christmas along with rain, melting the snow down from 4” to 1” by Christmas morning. Originally, there had been 8” of snow on the ground on the 15th. The last really scenic (no slop)  with fresh white snow for Christmas occurred in 2004. A snowstorm brought heavy snow (ranging from 8”at Detroit to around 4” in Saginaw and Flint) on the 23rd, which left the region with a nice white cover for Christmas. It was also a cold Christmas also with highs only in the teens and overnight lows below zero. 


Looking over historical weather records of Christmases past since 1900, a wide range of weather conditions were found. While most people would like to believe that Christmas in the Detroit area should be snowy-white and picturesque, more often than not, they're not. Over the past 123 (including 1900) Christmases in Detroit, 58 (or 47%) have been what would be called "white" with an inch or better of snow on the ground. Keep in mind however, these records are for Detroit; farther north in Flint, the chance of a white Christmas jumps to 56 percent, while in Saginaw and the Thumb region it rises to 61 percent. However; the past 30 year normals /1991-2020/ the shorter time-frame indicates the chance of a white Christmas at Detroit has dropped to just 35%; whereas around Flint the past 30 year norm puts it at basically a 50/50 chance (or exactly 51%). In the Saginaw region; the probability of a white Christmas has dropped to 46%.

Way back on the Christmas of 2000 was very white indeed, but as to how much of a white Christmas (snow depths) is where the confusion came in. Let me elaborate, officially at Detroit Metro Airport, just six inches of snow was recorded on the ground at 7AM Christmas Day. However, just about anywhere west/north and in the city of Detroit itself, amounts were considerably higher with generally 8 to at least 15 inches. At the National Weather Service in White Lake, 15 inches was observed on the ground Christmas 2000 morning. No additional snow fell on Christmas Day (nor was anymore really wanted with the surplus already at hand). In any event, for Detroit and surrounding communities, the six inches at Detroit Metro Airport is the official snow depth used for the area.

The snowiest Christmas (most snow falling on Christmas), occurred in 1915 when 6.4 inches fell with a snow depth of seven inches on the ground. The timing of this snowfall was impeccable for Christmas with it actually starting Christmas Eve around sunset. Then, it continued to snow through the night into Christmas day. Actually, even more than the 6.4 inches fell from the entire storm with an additional 1.6 inches falling on Christmas Eve. This gave a snowstorm total of eight inches.  A little light rain did mix with the snow during the forenoon hours of Christmas but with a high temperature of only 33, it did little to mar the "Christmas card" scene. Speaking of "Christmas card" scenes, another heavy wet snowfall blanketed the area just after the turn of the century early on Christmas in 1901. The scene is described in the historical weather books as follows:

    "Night of the 24 - 25 cloudy; moist snow continued,
     heaviest between hours of 1:30 and 4:30 am, ended
     at 6 am. amount of precipitation .62 inches. The
     street cars ran all night to keep the tracks open.
     the snow adhered to trees etc, and made a very
     beautiful scene. Depth of snow on ground at 8 am,
     5.5 inches".

 This "Norman Rockwell Christmas scene" was further enhanced by a heavy coating of frost deposited on the buildings and windows Christmas Eve due to the moisture-laden air. But just like memories of some Christmases past, this majestic Christmas scene quickly faded (melted) during the day as temperatures climbed to 41 degrees, leaving just slush , slop and water. During the Christmases of 2002 and 2003, the weather was similar to both of the white Christmases mentioned above /1901 & 1915/. Here again in 2003, snow started falling Christmas Eve and lasted into at least part of, if not all of Christmas Day. On Christmas Day 2003, snowfalls ranged from at least an inch in the far southeast corner of Lower Michigan to as much as six inches across Detroit's northern suburbs, extending northward across Flint and Saginaw. On Christmas Day of 2002, total snowfall at Detroit Metro Airport was measured at 6.4” inches for both days (Christmas Eve and Christmas) with 3.4” of it falling on Christmas Day, itself. Across all of Southeast Lower Michigan snowfalls generally ranged from four to seven inches. A picture perfect Christmas was created both years with the freshly fallen snow. Like the Christmas snowstorms of 1901 and 1915, the snow Christmas 2002 was also somewhat heavy and wet with high temperatures in the lower 30s and lows only in the mid 20s.

Probably one of the slushiest and sloppiest Christmas Days happened in 1973. What started out as a white Christmas with a heavy 7 inch snow cover, quickly melted to a meager 2” slush mess by nightfall. To add insult to injury, it rained nearly a half an inch during the day.The wettest Christmas on record occurred in 1945 when 1.16 inches of rain fell. The rain actually began Christmas Eve as a light freezing rain and continued freezing until nearly dawn on Christmas, when the temperature pushed above freezing. Until the ice melted, a few tenths of an inch of ice coated everything by Christmas dawn. Needless to say, walking and driving early the Christmas of 1945 was treacherous but Santa was in and out of town in a flash!

Without a doubt, and still in the memories of long term inhabitants of Southeast Lower Michigan, is the warmest Christmas on record, the Christmas of 1982. It was as though the whole area was shipped to Florida for the holiday! The official record high at Detroit was 64 degrees, while Flint did one degree better at 65! These readings are about normal for Tallahassee, Florida! Scenes of shirt sleeved people with shorts running or riding bikes, instead of visions of sugar plums, made the Christmas of 1982 to some Michigan Christmas traditionalist, very hard to take.  This spring-like day was complete with scattered showers and, of all things, thunderstorms! Ironically, the bitterest cold Christmas came just a year later in 1983! Maybe a payback from Mother Nature for the warm weather we were treated to, the Christmas past? The temperature plummeted Christmas eve to a record low of -9 at Detroit and was accompanied by a stiff west wind averaging 25 to 30 mph, creating life threatening wind chills at times of near 40 below zero! Santa certainly brought the North Pole with him the Christmas of 1983, when he made his rounds very early that morning. In addition to the record low Christmas eve, another record low /-10/ was established during the very early morning hours of Christmas.

These Christmases past discussed are more the extreme than the norm across extreme Southeast Lower Michigan. But they do show the variable weather that can occur at Christmas (or any other time for that matter). The "normal" (or average) highs in extreme Southeast Lower Michigan Christmas Day are in the lower 30s, while lows average in the upper teens.

And now, I'd like to wish all who read this a very Merry Christmas and/or Holiday Season and the best in 2024!  I plan on continuing my blog for the new year if the fates allow and look forward in reaching out to more people (and hear their comments and ideas) across the globe.

Making weather fun while we all learn,
Bill Deedler - SEMI_WeatherHistorian