April 6 1886 Super Snowstorm In Detroit
Written by: William R. Deedler, Weather Historian
While the Snowstorm of April 6th 1886 had been written about in the past, I am now able to include the weather maps drafted at that time, so long ago. At the time I wrote about the storm (along with the storm of December 1st, 1974), I had to estimate the weather map just by local surface observations available from Detroit. I wrote about some similarities between the two storms (1886 & 1974). And now, looking back at the roughly drawn weather maps from 1886, you could also toss in our big blizzard of January 26th, 1978 for good measure. All three storms involved some sort of strong, deep upper low pressure system /500 MB Low/ over the Upper Ohio Valley, most like negatively tilted (which would help explain the backing of the storm to the north-northwest and it’s ability to draw Atlantic, along with Gulf, moisture north and westward into the Great Lakes). Obviously, there was no upper air data way back in 1886 but just by looking at the evolution of this massive and late season snowstorm, an estimate of the upper level system could be drawn (along with fine tuning the available surface maps) from April 4-6th, 1886 7AM EST surface analysis.
APRIL 1886 SCENARIO
By early April 1886, some residents of Southeast Lower Michigan had most likely started on spring outdoor activities. High temperatures frequently pushed well into the 50s from mid March on; the last hint of snow fell nearly two weeks before on the 23rd. No doubt the growing season's new green vegetation was well underway.
The weather days proceeding the massive and incredible snowstorm hinted little of what was yet to come; however, there were some subtle signs of trouble brewing. The first was a fresh, brisk northeast wind that blew continuously for nearly three days prior to 6th (generally, an easterly wind along with a falling barometer in this region, foretells of foul weather approaching the area). On the 4th into the 5th, observations including temperatures, wind flow and pressure changes indicated an unseasonably cold high pressure system pushing slowly into Southern Canada and the Northern Great Lakes. This persistent and strengthening northeast wind along with an extended period of steady, then slowly falling barometric pressure, during the three-day period (3rd, 4th and 5th), indicates this high was a fairly strong, resilient and a blocking type of high pressure. A second and more foreboding sign of what was to come was indeed a rapidly falling barometric pressure later on the 5th, which foretold of the major storm approaching Southeast Lower Michigan. The surface observations late on the 5th indicated a low pressure and storm center approaching the Southern Great Lakes from the south or southwest (most likely from Illinois, Indiana or Ohio) as the cold high to the north slowly retreated.
The afternoon high on the 5th reached only 38 degrees (about 15 degrees below normal) and then held nearly steady into the evening. Increasing high cirrostratus clouds mingled with the sunset but then, quickly lowered to altostratus and nimbostratus as midnight approached. Light snow began to fly just after midnight and remained light until becoming heavy during the predawn hours. Note the following taken from the actual Detroit Weather Log dated April 6th, 1886:
The synopsis continues with a description of numerous street cars that were abandoned, strewn about and laying in all sorts of positions. As one might expect with the snow falling in April, the snow contained a high water content (2.43") and, therefore, it was very heavy and packed down well. Obviously, wading through the snow to get around on foot was extremely difficult - so much so that it became necessary to use crowbars and ice picks just to clean a path on the street. Maneuvering through, or just moving the snow, was such a monumental chore that even several ton railroad cars were "held prisoner in their houses". On the train tracks, freight cars were immobilized and abandoned across all of Southeast Lower Michigan. Temperatures held in the upper 20s to around 30 through the entire snowfall, with over two feet of snow reported on the ground. The strong northeast to north gale sculptured towering drifts of snow up to 12 feet high across the landscape .The howling wind averaged over 30 mph during the 24 hour period. The lowest barometric pressure reading noted was 29.60 inches at 11:00 AM on the 6th. This reading isn't too terribly deep or severe (the lowest pressure ever observed in Detroit was 28.34 inches during the late January blizzard of 1978), but the pressure was taken only five times daily (7:00 AM, 11:00 AM, 3:00 PM, 7:00 PM and 11:00 PM), so it likely fell lower. As the center of the low pressure drifted further north into the Great Lakes on the 7th, milder air from the south was drawn into Southeast Lower Michigan. The sky cleared as the wind shifted to the south and the temperature rose to 40 degrees, in spite of the very heavy snow cover. In the days following the storm, temperatures managed to push up well into the 50s and even reached the mid 70s by mid month, after all, this was April, right?"Snow began at 12:30 AM and fell light until about 4:30 AM when it began to fall heavy and a tremendous fall of snow continued all day, ending at 9:00 PM. The fall at 7:00 AM was 4.6" and at 3:00 PM was 17.1" and at 11:00 PM, 2.4" making the total of 24.1 inches melted from the snow gauge. The rain gauge was soon snowed full and was practically useless. Total fall of the snow on the level was 24.5 inches. The snow was badly drifted by the heavy gale. The drifts in some places were 12 feet high and the snow in the street was from 10" to 40" inches deep. A heavy north gale set in at 1:45 AM and raged in fury all day reaching 40 miles north at 2:15 PM and continued all the remainder of the day. Its force with the snow was appalling. It blew the snow in fine particles against the face, cutting like a knife."
This storm stands as Detroit's biggest and severest snowstorm and is well summarized by the following quote in the journal and actually would still stand to this day. . .
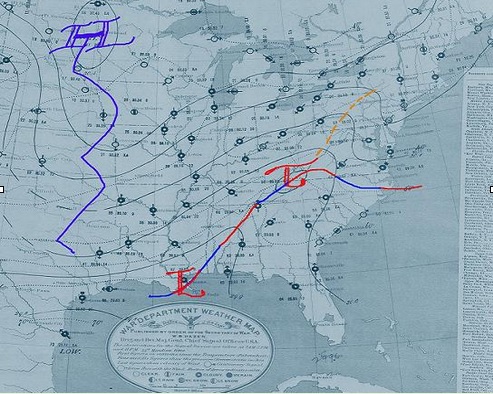
MAP 1"The storm was unprecedented in fierceness, snowfall and blockades in the history of the service and the oldest inhabitants can recall nothing to equal it".
Note copies of the 120 year old maps below, all under the "War Department" seal at that time. On the morning of the 4th, a large Arctic high pressure system /30.41"/ dominated much of the central and northern part of the US. The air with this high was unseasonably cold for early April with readings in the teens and 20s under it. A station in the western U P in Michigan reported 10 degrees. It was around the 20 degree mark here in Southeast Lower Michigan (normal lows average in the mid 30s for Detroit). Meanwhile, a north/south front over the Ohio Valley appears to have stalled with areas of low pressure riding up the front as a strong, southerly low level jet surges northward ahead of the front.
April 4th, 1886 7AM EST
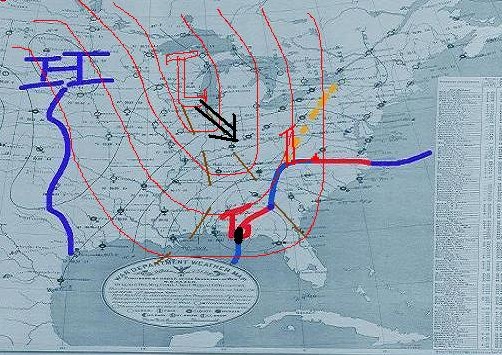
MAP 2
Note the series of low pressure systems that ride north-northeast out of the Gulf of Mexico in an upper air pattern that is also showing signs of stalling and deepening as an upper low pressure trough /500MB/ seems to be digging and forming into the Ohio and Tennessee Valleys. Our monster has now shown its face and of all places, far to the southeast over the panhandle of Florida !
April 5th, 1886 7AM EST
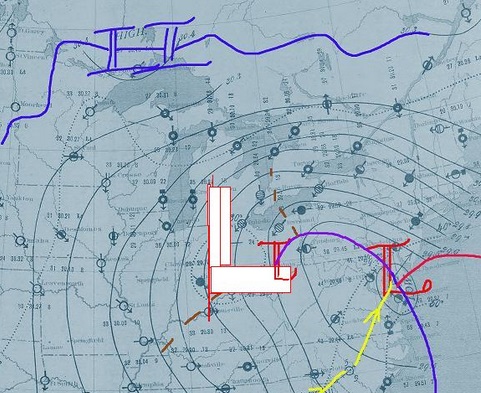
MAP 3
On the morning of the 6th, note the massive surface storm system covering pretty much the eastern half of the country. This is also reminiscent of the our January 26-28th, 1978 storm in its deepening intensity (though the ’78 storm central pressure bottomed-out deeper), estimated upper air pattern and extent of coverage. Note the area of heavy snow and blizzard conditions over the Eastern Great Lakes with sky obscured in heavy, driving snow (shaded round circles, not black) as surface troughing extends northward up into Lake Huron as the surface low backs toward the Lakes Region. This heavy snow scene replicates that of our 1974 storm with its "conveyor-belt " analogy of moisture drawn from the Atlantic westward into the Eastern Great Lakes . The heaviest snow fell across extreme Southern Ontario, extreme Southeast Lower Michigan and extreme Northwest Ohio with the ’74 storm also and note how that same area is shaded here in the 1886 storm. An estimated position of the 500 MB low is included (most likely very close, if not identical to the 1978 and 1974 storm) somewhere in the Upper Ohio Valley (Kentucky northward into the Eastern Great Lakes). Note, the high pressure system has been squeezed northwestward into the classic "horseshoe" shape pattern, also reflective of the 1974 storm.
April 6th 1886, 7AM EST
Snowstorm and Cold Wave of April 5-6th 1982
April of 1982's weather started out normal enough across Southeast Lower Michigan with highs in the mid 50s and decent weather. Along about the 4th, the pattern began to change as an Arctic air mass hibernating across northern Canada began to push southeast in earnest, approaching the northern border states of the US. By the 5th, the high pressure made inroads into the Northern Plains and Great Lakes while a low and storm center began forming over Oklahoma with a trof northeast toward the southern Great Lakes. Temperatures in the Lakes region had plummeted into the teens and 20s that morning of the 5th.
By the morning of the 6th; the low had deepened and moved rapidly east northeast across the northern Ohio Valley pushing a wide area of snow into the cold air over the region. As the storm moved into the Northeast over Pennsylvania that morning; the central pressure had dropped to 992 MB. Across Southeast Michigan, generally 4-8" of snow fell over the area by mid day on of the 6th with temperatures in the lower 20s.
April 5th 1982 Weather Map

April 6th 1982 Weather Map

DETROIT LCD 1982

FLINT LCD 1982

| April Normals (1980-2010) |
Maximum | Minimum | Average Daily Temperature |
Precipitation | |||||||
| Date | Max | Min | Avg | Record High |
Lowest Max |
Highest Min |
Record Low |
Highest | Lowest | Greatest | Date |
| 1 | 53 | 34 | 44.0 | 80/2010 | 27/1911 | 57/1967 | 14/1923 | 64/2010 | 24/1923 | 1.30/1959 | 1 |
| 2 | 53 | 35 | 44.0 | 83/1963 | 29/1899 | 58/1963 | 17/1881 | 71/1963 | 24/1881 | 1.44/1945 | 2 |
| 3 | 54 | 35 | 44.0 | 77/1999 | 30/1954 | 57/1981 | 14/1954 | 66/1981 | 22/1954 | 1.06/1980 | 3 |
| 4 | 54 | 35 | 45.0 | 74/1921 | 30/1881 | 54/1928 | 9/1874 | 64/1921 | 20/1874 | 1.06/2003 | 4 |
| 5 | 55 | 36 | 45.0 | 79/1921 | 29/1874 | 59/1929 | 16/1881 | 68/1929 | 24/1881 | 2.59/1947 | 5 |
| 6 | 55 | 36 | 46.0 | 83/1929 | 27/1982 | 65/1929 | 18/1982 | 74/1929 | 23/1982 | 2.41/1886 | 6 |
| 7 | 56 | 36 | 46.0 | 83/1991 | 25/1972 | 63/1929 | 10/1982 | 72/1929 | 21/1982 | 0.92/2010 | 7 |
| 8 | 56 | 37 | 46.0 | 79/2001 | 32/1920 | 59/2001 | 11/1982 | 69/2001 | 24/1982 | 0.94/2002 | |
| April Normals (1980-2010) |
Maximum | Minimum | Average Daily Temperature |
Precipitation | |||||||
| Date | Max | Min | Avg | Record High |
Lowest Max |
Highest Min |
Record Low |
Highest | Lowest | Greatest | Date |
| 1 | 51 | 31 | 41.0 | 79/2010 | 32/1992 | 56/1967 | 7/1923 | 66/2010 | 21/1923 | 1.14/1929 | 1 |
| 2 | 51 | 31 | 41.0 | 82/1963 | 32/1992 | 55/2010 | 16/1924 | 69/1963 | 26/1992 | 1.62/1945 | 2 |
| 3 | 52 | 31 | 42.0 | 79/1999 | 28/1954 | 57/1981 | 11/1954 | 67/1999 | 20/1954 | 1.03/1926 | 3 |
| 4 | 52 | 32 | 42.0 | 77/1921 | 30/1944 | 56/1928 | 13/1995 | 65/1928 | 0/1999 | 1.51/2003 | 4 |
| 5 | 53 | 32 | 42.0 | 80/1921 | 28/2007 | 57/1929 | 13/1995 | 67/1929 | 25/2007 | 2.05/1947 | 5 |
| 6 | 53 | 32 | 43.0 | 83/1921 | 27/1982 | 64/1929 | 16/1975 | 73/1929 | 23/1982 | 1.73/2010 | 6 |
| 7 | 54 | 33 | 43.0 | 83/1929 | 27/1972 | 60/1991 | 6/1982 | 72/1929 | 18/1982 | 0.87/2010 | 7 |
| 8 | 54 | 33 | 44.0 | 76/1991 | 32/2007 | 52/1991 | 8/1982 | 64/1991 | 23/1982 | 0.91/2002 | 8 |
| April Normals (1980-2010) |
Maximum | Minimum | Average Daily Temperature |
Precipitation | |||||||
| Date | Max | Min | Avg | Record High |
Lowest Max |
Highest Min |
Record Low |
Highest | Lowest | Greatest | Date |
| 1 | 49 | 31 | 40.0 | 81/2010 | 29/1924 | 55/1999 | 8/1923 | 67/2010 | 22/1923 | 1.09/1959 | 1 |
| 2 | 50 | 31 | 41.0 | 82/2010 | 30/1936 | 58/2010 | 15/1954 | 70/2010 | 25/1936 | 1.17/1945 | 2 |
| 3 | 50 | 32 | 41.0 | 82/1999 | 26/1954 | 56/1981 | 11/1954 | 64/1981 | 19/1954 | 1.20/1982 | 3 |
| 4 | 51 | 32 | 41.0 | 76/1921 | 29/1982 | 55/1929 | 15/1954 | 64/1921 | 23/1982 | 1.13/1947 | 4 |
| 5 | 51 | 32 | 42.0 | 79/1921 | 28/1982 | 59/1929 | 14/1995 | 68/1929 | 23/1982 | 1.45/1917 | 5 |
| 6 | 52 | 33 | 42.0 | 81/1929 | 28/1982 | 66/1929 | 16/1982 | 74/1929 | 22/1982 | 0.93/1988 | 6 |
| 7 | 52 | 33 | 43.0 | 81/1991 | 26/1972 | 60/1991 | 12/1982 | 71/1991 | 23/1982 | 0.84/1928 | 7 |
| 8 | 53 | 33 | 43.0 | 74/1931 | 29/1914 | 50/1981 | 17/1950 | 59/1929 | 24/1914 | 1.19/1991 | 8 |
Making weather fun while we all learn,
Bill Deedler -SEMI_WeatherHistorian
prediksi wla
ReplyDelete