| Top 20 Coldest/Warmest Aprils in Southeast Lower Michigan | ||||||||||||
| Rank | Detroit Area* | Flint Bishop** | Saginaw Area*** | |||||||||
| Coldest | Warmest | Coldest | Warmest | Coldest | Warmest | |||||||
| Temp | Year | Temp | Year | Temp | Year | Temp | Year | Temp | Year | Temp | Year | |
| 1 | 37.6 | 1874 | 54.5 | 1955 | 39.1 | 2018 | 53.7 | 1941 | 37.9 | 1950 | 52.7 | 1985 |
| 2 | 39.1 | 1907 | 54.3 | 2017 | 39.4 | 1950 | 52.5 | 1955 | 39.0 | 2018 | 52.6 | 1955 |
| 3 | 40.5 | 1875 | 54.2 | 2010 | 40.2 | 1975 | 52.4 | 1921 | 39.2 | 1920 | 51.7 | 2010 |
| 4 | 40.9 | 1975 | 53.4 | 1878 | 41.3 | 1944 | 51.8 | 1985 | 39.4 | 1926 | 51.7 | 1921 |
| 5 | 40.9 | 1926 | 53.2 | 1921 | 41.3 | 1943 | 51.6 | 2010 | 40.0 | 1943 | 51.6 | 1915 |
| 6 | 41.0 | 1920 | 52.9 | 1942 | 41.5 | 1926 | 51.5 | 1925 | 40.2 | 1944 | 50.9 | 1977 |
| 7 | 41.2 | 1904 | 52.6 | 1941 | 41.6 | 1961 | 51.4 | 2017 | 41.1 | 1940 | 50.8 | 2017 |
| 8 | 41.5 | 1950 | 52.4 | 1977 | 42.4 | 1996 | 51.0 | 2008 | 41.2 | 1965 | 50.7 | 1941 |
| 9 | 42.3 | 1936 | 52.2 | 2006 | 42.4 | 1972 | 50.4 | 1942 | 41.3 | 1982 | 49.9 | 1968 |
| 10 | 42.4 | 1943 | 52.2 | 1915 | 42.5 | 1953 | 50.2 | 1991 | 41.4 | 1978 | 49.6 | 1942 |
| 11 | 42.8 | 1940 | 52.0 | 1991 | 42.6 | 1995 | 50.2 | 1948 | 41.4 | 1975 | 49.3 | 1976 |
| 12 | 42.9 | 1944 | 51.8 | 2008 | 42.7 | 1947 | 49.9 | 2004 | 41.5 | 1917 | 49.1 | 2008 |
| 13 | 43.0 | 2018 | 51.3 | 1925 | 42.8 | 1965 | 49.9 | 1987 | 41.6 | 1953 | 48.9 | 2006 |

For more of the cold April in the upper Midwest and Great Lakes; check out April Monthly Overview.
The spring analogues had projected a colder than average spring for March and especially April but with a rebound in May - let's hope that holds true to form.
OK; on with - or back to Winter 2017-18...
Winter 2017-18 Review and Analogue Performance
After a cool and wet November; Winter of 2017-18 arrived aggressively in December with well below normal temperatures and above normal snow. The projected winter roller-coaster revved-up in full force with below normal temperatures accompanied by above normal snowfall. Our best snows of the month came mid month /13th/ and I must say; appropriately again over Christmas Eve into Christmas Day. Unfortunately, travelers had hazardous road conditions to deal with mid month and especially over the extended holiday weekend Sunday into Monday.


Temperatures held below normal much of December, averaging in the lower to mid 20s across Southeast Lower Michigan - or some 3 1/2 to 5 degrees below normal. Snowfalls amounted from a foot across the Saginaw Valley to upwards of two feet across mid portions of Southeast Lower Michigan south into the Detroit area.
Bitter Beginnings!
The temperature roller coaster remained in high gear in January and started the month with a continuation of the dip from late December; resulting in the coldest weather of the winter. That cold snap, which actually had its beginnings with our Christmas snow storm, held tough right through New Years and into the first week of January. Temperatures averaged an incredible 18 to 20 degrees below normal for that two week period! Incredible, mainly for its persistence of two weeks - and not to mention it was relatively early in the winter! Southeast Lower Michigan generally sees and feels the coldest of the winter the third or fourth week of January on average. After a brutal introduction to 2018 with a continuation of bitter cold temperatures and wind chills; we managed to squeak out a record number of days with temperatures below 20 - twelve days at Detroit and Flint. The old record for Detroit was eleven and was set twice back in 1936 /Jan 23-Feb 2/ and 1979 /Feb 8-Jan 18/. The below 20 streak was tied at Flint with 12 which tied with Feb 8-19 1979. Saginaw did not hold below 20 the entire streak, hitting 21 on the 2nd and thus messed up the record there. More on the cold streak can be found here.
Note; the frigid below normal temperature departures across the upper Midwest and Great Lakes on the temperature departure map below. Some areas in the northern Ohio Valley bottomed out at a 25 degrees below normal average departure.

Classic January Thaw
Mom Nature did an about face the second week of January with much warmer weather pushing into the area with temperatures rising into the mid 50s! However, the roller coaster weather held true to form as much colder weather pushed back south into the area mid month. Alas and not to be outdone by notable cold; a classic January Thaw arrived right on schedule during the third and fourth week of the month. Above to well above normal temperatures arrived from the 20th through the 28th. What started out as a frigid month, moderated considerably that by the close, temperature departures recovered to around normal.
January Thaw Statistics
January Thaw as
defined by the "Glossary of Weather and Climate” occurs more often than
chance would indicate. And, though no actual departure above “A spell of mild weather, popularly supposed to recur each year in late January in
New England and other parts of the northeastern United States.
Statistical tests show a high probability that it is a real
singularity.”
A
high probability that it is a real singularity means that the January
Thaw occurs normally is listed, it is generally accepted that it is
several degrees and lasts awhile.
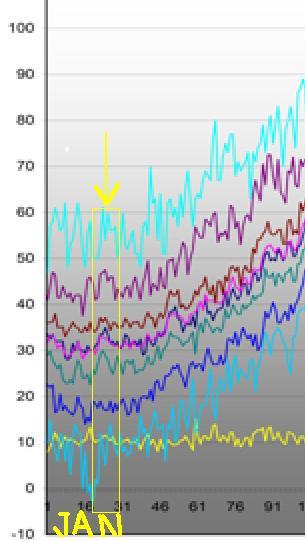
While
at DTX; I and another Met ran an in-house study on temperatures from
Detroit Metro Arpt. Taking a look at the graph below, we see a plot of
various temperature traces for Detroit over the first half of the year
using data taken at Detroit Metro Airport 1958 through 2004. Note the
legend on the side of the graph is the temperature. Displayed are
several traces representing a range of temperature plots. The
temperature plot include; the high temperatures median, mean, standard
deviations, highest max temps, 90th percentile, 67th percentile, 33rd percentile, 10th percentile
and lowest max temps for the period. Note the boxed area in mid to late
January does indeed show a subtle pop in temperatures.
Snowfall lacked over most areas in January as milder weather pushed into the area late month as discussed above. One exception was in a narrow arc-shape snowstorm from the western I-69 belt - including Flint, extending northeast into southern portions of the Thumb. Strong frontogenetic forcing occurred ahead of this low pressure system. Precipitation and snowfall was above normal in this area for January with the snowstorm culminating the month's snowfall dumping 10" of snow at Flint on the 29th. Flint recorded over 20" /20.2"/ +7.1 departure of snow.
Jan 29th 2018

Heavier snows returned to the entire region of Southeast Lower Michigan during February into the opening of March as the lion roared. A couple of main snowstorms dumped the heaviest snow over the southern sections of area. However, like December and January, Flint again managed to accumulate snow over 20" in February. Nearly all the snow fell in early February from the 3rd-11th when a total of 21.2" was reported. This led to a solid 14" on the ground from the 11-14th. Flint's Winter months alone snowfall /Dec-Feb/ led to 65.3" while the total 2017-18 snowfall season broke the heaviest season snowfall on record at Flint with 85.3" a whopping 37.9" surplus! Another storm hit on March 1st creating the classic "March comes in like a lion" scenario (see map below).
Feb 9th 2018 Mar 1st 2018


Top 20 Snowiest/Snowless Seasons in Southeast Lower Michigan |
||||||||||||
| Rank | Detroit Area* | Flint Bishop** | Saginaw Area*** | |||||||||
| Snowiest | Snowless | Snowiest | Snowless | Snowiest | Snowless | |||||||
| Total | Year | Total | Year | Total | Year | Total | Year | Total | Year | Total | Year | |
| 1 | 94.9 | 2013-2014 | 13.4 | 1936-1937 | 84.5 | 2017-2018 | 10.9 | 1921-1922 | 87.2 | 1966-1967 | 7.7 | 1941-1942 |
| 2 | 93.6 | 1880-1881 | 13.7 | 1948-1949 | 83.9 | 2013-2014 | 16.0 | 1944-1945 | 83.5 | 1951-1952 | 18.5 | 1976-1977 |
| 3 | 78.9 | 1925-1926 | 15.1 | 1881-1882 | 82.9 | 1974-1975 | 16.5 | 1948-1949 | 80.0 | 2007-2008 | 20.0 | 1952-1953 |
| 4 | 74.0 | 1981-1982 | 15.2 | 1918-1919 | 82.8 | 2007-2008 | 18.5 | 1932-1933 | 79.4 | 2008-2009 | 21.0 | 1920-1921 |
| 5 | 71.7 | 2007-2008 | 15.4 | 1965-1966 | 78.6 | 1966-1967 | 20.7 | 1936-1937 | 76.2 | 2010-2011 | 21.9 | 1963-1964 |
| 6 | 69.1 | 2010-2011 | 15.8 | 1889-1890 | 76.6 | 1975-1976 | 21.5 | 1943-1944 | 75.4 | 2004-2005 | 22.7 | 1948-1949 |
| 7 | 69.1 | 1899-1900 | 16.6 | 1952-1953 | 75.3 | 1951-1952 | 21.6 | 1933-1934 | 75.0 | 1996-1997 | 23.6 | 1918-1919 |
| 8 | 67.2 | 1907-1908 | 17.1 | 1968-1969 | 73.0 | 2004-2005 | 23.4 | 1952-1953 | 68.4 | 1995-1996 | 23.8 | 1982-1983 |
| 9 | 67.2 | 1929-1930 | 18.0 | 1960-1961 | 72.9 | 1964-1965 | 24.2 | 1957-1958 | 67.2 | 2000-2001 | 23.9 | 1916-1917 |
| 10 | 65.7 | 2008-2009 | 18.0 | 1957-1958 | 72.8 | 2008-2009 | 24.4 | 1937-1938 | 65.8 | 1972-1973 | 24.3 | 1943-1944 |
| 11 | 63.8 | 2004-2005 | 20.0 | 1982-1983 | 72.1 | 2010-2011 | 28.2 | 1939-1940 | 63.0 | 1971-1972 | 24.5 | 1932-1933 |
| 12 | 63.1 | 1974-1975 | 20.9 | 1945-1946 | 69.0 | 2015-2016 | 28.3 | 1997-1998 | 62.2 | 1984-1985 | 25.0 | 1986-1987 |
| 13 | 61.7 | 1977-1978 | 22.8 | 1943-1944 | 64.9 | 1925-1926 | 28.4 | 1931-1932 | 61.9 | 1964-1965 | 25.1 | 1944-1945 |
| 14 | 61.6 | 1884-1885 | 23.0 | 1888-1889 | 63.4 | 1929-1930 | 28.6 | 1968-1969 | 60.6 | 1947-1948 | 25.6 | 1983-1984 |
| 15 | 60.9 | 2002-2003 | 23.4 | 1997-1998 | 62.9 | 1972-1973 | 28.7 | 1941-1942 | 60.3 | 2013-2014 | 26.1 | 1921-1922 |
| 16 | 60.2 | 1898-1899 | 23.7 | 1999-2000 | 62.2 | 1981-1982 | 28.9 | 1924-1925 | 57.0 | 1929-1930 | 26.5 | 1927-1928 |
| 17 | 60.0 | 1922-1923 | 23.8 | 1937-1938 | 61.5 | 1958-1959 | 29.5 | 1999-2000 | 56.3 | 1975-1976 | 26.9 | 1993-1994 |
| 18 | 60.0 | 2017-2018 | 24.1 | 2003-2004 | 60.1 | 1959-1960 | 29.5 | 1988-1989 | 56.0 | 2001-2002 | 27.5 | 1912-1913 |
| 19 | 59.9 | 1892-1893 | 24.8 | 1941-1942 | 55.9 | 2005-2006 | 30.5 | 1928-1929 | 55.9 | 1978-1979 | 27.5 | 1979-1980 |
| 20 | 58.6 | 1951-1952 | 25.1 | 1988-1989 | 55.4 | 1989-1990 | 31.3 | 1956-1957 | 55.6 | 1977-1978 | 28.3 | 1926-1927 |
WINTER 2017-18 SOUTHEAST LOWER MICHIGAN STATS


Trends the Winter of 2017-18 and Analogue Performance
First off, the trends of the winter matched well with trends put out by the analogues. The winter was a roller-coaster non-stop including some bitter colder and abnormal warmth. The analogues rightly suggested the worst of the winter would come in early and then again late, lasting well into spring; as evidenced by the numbers and my written interpretations of them. Much of the results of the early part of the winter can be found here: Early Winter Unfolding Along With Prevalent Analogue Pattern Seen .
My headline for the Winter seemed to fit well with its outcome: Winter 2017-18 Outlook for Southeast Lower Michigan - Some surprises along the way?
Forecasts made in November;
“Temperatures: Normal to Below "
Expect temperatures during the 2017-2018 winter to be quite changeable as opposing air masses vie for dominance under a fluctuating jet stream. This is not only a developing trend seen the past month or two but it's well displayed in the Winter Analogues for 2017-18 and finally; the computer guidance for the upcoming winter. While this is a typical La Nina pattern, my research shows and I believe again this winter the Pacific jet will be more of a key player against the typical La Nina pattern. The basic difference this winter from last winter is all data that I research is intimating a notably colder winter than last winter. This is likely due to a preponderance of polar/arctic air masses”.
“Precipitation: Above
Because of the parade of conflicting air masses diving in from the north and west, with temperature variability and associated storms and storm tracks ignited; above normal precipitation is likely for the Winter of 2017-18. This trend is supported by many of the analogue winters, along with model output for the winter and recent autumn trends. With the discussed storm tracks below; mixed precipitation is at a higher risk this winter. I do look for the alternating extended wet and dry periods to persist into the winter from the autumn”.
“Snowfall: Around Normal to Above
The especially tricky part of this forecast is how much of the expected precipitation will be snow and/or mixed precipitation? In the analogues: snowfall in the winters ranged widely from above normal to below. This would be expected since the variance of temperatures hint at the variability of the upper atmospheric patterns and storm tracks. Therefore, pinpointing the perceived prevailing storm tracks this winter will make a significant difference in regard to seasonal snowfall.
Leaning on the analogues; I look for generally normal, or an average winter's snowfall (+/- 5" of the norm) across much of extreme Southeast Lower Michigan. This is a winter however where below normal snows could certainly occur especially in this area if the storm track rides further north. The better chance for above normal snow expected further west and north away from that region. Therefore; best chance for above normal snow will lie in an arc from the Brighton/Howell area /I-96 area/ east northeast across Flint and Port Huron /I-69/ and points north/northwest into the Saginaw Valley/Thumb Region”.
“Looking across the board at the three cities, there were a predominance of normal to below normal winters (also my forecast) with a few above normal. Generally; these winters were early to middle loaded with the preponderance of storms roughly from mid December into mid February with later winter, average to below. However; colder weather tended to hold on into at least early spring”.

The main storm tracks drawn expected to affect SE Michigan were the clippers and the lows or impulses moving onto the West coast; then deepening/moving in the Southern Plains to the Great Lakes and east. The track over extreme Southeast Michigan was expected to bring the heaviest snow from Detroit's northern suburbs into the Saginaw Valley (red outline). This main area estimate was a row or two of counties too far north, but otherwise performed satisfactory for heaviest snow placement (dark blue heaviest, light blue closer to norm). Given the complexity of storm track placement and variances (see forecast); the snow forecast actually performed better than expected as it easily could have just missed the area completely.

Detroit Winter 2017-18 Analogues
December into January's analogue average performed well for dominant trend averages - which is/was followed. December's ave of colder, blue numbers came in at /25.6; actual 26.6/. January's dominant trend was mixed - seven above, seven below so all were used. January's average was just one tenth of a degree different from projected /24.6 vrs 24.5/ or pretty much a dead ringer. February is where things went more awry. While February was expected to the warmer month, as far as closer to normal, the analogue average /27.4/ wasn't warm enough. However; ironically half of the analogues (seven out of the 14) did indicate a much warmer average at 31.0 mirroring the February of 2018 /31.0/. But alas, all analogue years were used in February's calculations since there were seven above (one normal) and seven below.
All in all; six analogues were colder than normal, five around normal (within a degree) and three above normal. Therefore; an overwhelming indicator of normal to below /11 out of 14/. Both Detroit and Flint averaged slightly below normal and Saginaw averaged right on normal (refer to actual stats).
Snowfall, as mentioned came close to the expected general forecast but Saginaw was projected above normal and Detroit around normal. This was primarily do to the placement of the heaviest axis of snow, as discussed above. As a consequence; both actual snow totals at Saginaw and Detroit "sort of reversed' with Detroit the heavier and Saginaw the lighter (normal). That is not to say Saginaw didn't have normal snow analogue years (four, 1910-11, 1950-51, 1955-56 and 2011-12) but they weren't dominant with 7 out of 11, being above normal. It could be said the axis of the storm track greatly influenced Detroit's analogues with highly mixed results with 5 above, 5 normal and 4 below. So basically a normal to above normal was considered in the forecast for nearly all of the remainder of the area. Even a little below normal was mentioned as a slight possibility over the southeast corner of Lower Michigan a (well south of metro Detroit) - depending on the eventual storm track, resulting temperatures and moisture supply. After all, Detroit's snowfall analogues ranged from mid 20s to mid 60s! In fact, 5 (one of the dominant trends) of Detroit's heavier snowfalls ranged from around 50 to the mid 60s - therefore 61.0" fell well within that range.
Next Up: What are patterns and analogue summers saying about this Summer of '18?

Making weather fun while we ALL learn,
Bill Deedler - SEMI_WeatherHistorian
No comments:
Post a Comment