12/27/12

Winter Storm Totals from Dec 26-27th, 2012

Our first snowstorm of the Winter 2012-13 lived up to its expectations for the most part with a general 4 - 7" snowfall. As expected; areas over the far east had the most snow with some 8 - 10" falls while areas over far northwest (Midland and Bay counties) had little to none. 

Here's the snowfall map and specific amounts from our NWS spotters. Here in northern Livonia, I received 6.2" total with some foot drifts.

Snowfall totals from the December 26-27th, 2012, Winter Storm

Snowfall totals from the December 26th, 2012, Winter Storm
PUBLIC INFORMATION STATEMENT...STORM TOTALS
NATIONAL WEATHER SERVICE DETROIT/PONTIAC MI
1053 AM EST THU DEC 27 2012

THE NORTHWEST FLANK OF A SIGNIFICANT WINTER STORM IMPACTED POST 
HOLIDAY TRAVEL ACROSS SOUTHEASTERN MICHIGAN ON DECEMBER 26TH. 
WIDESPREAD SNOW LIFTED ACROSS THE MICHIGAN-OHIO STATELINE DURING THE 
LATE MORNING HOURS...ARRIVING OVER PORTIONS OF THE I 69 CORRIDOR 
DURING THE MID AFTERNOON. WHILE THE STORM SYSTEM TRACKED THROUGH THE 
TENNESSEE VALLEY TRANSFERRING ENERGY TO THE EAST COAST DURING THE 
AFTERNOON...AN AXIS OF ENHANCED MOISTURE BECAME ANCHORED OVER MUCH 
OF SOUTHEASTERN MICHIGAN THROUGHOUT THE EVENING. BY DAWNBREAK OF 
DECEMBER 27TH...A GENERAL 4 TO 7 INCHES OF SNOWFALL FELL SOUTHEAST 
OF A LINE FROM BAD AXE TO MANCHESTER...WITH AMOUNTS IN EXCESS OF 10 
INCHES COMMON FOR LOCATIONS IN EASTERN ST CLAIR AND SANILAC COUNTIES 
ADJACENT TO LAKE HURON.

STORM TOTAL SNOW REPORTS

LOCATION                  SNOWFALL     DURATION
                          (INCHES)      (HOURS)        LAT       LON

...BAY COUNTY...
   2 NE AUBURN             M   0.9           14     43.62N    84.05W

...GENESEE COUNTY...
   LINDEN                  M   3.0           14     42.82N    83.78W
   BURTON                  M   4.0           14     43.00N    83.62W
   GOODRICH                M   4.4           14     42.92N    83.51W
   FLINT                   M   5.0           14     43.02N    83.69W
   4 N BURTON              M   6.0           14     43.05N    83.62W

...HURON COUNTY...
   PORT HOPE               M   0.8           14     43.94N    82.72W
   5 NNW FILION            M   1.1           14     43.96N    83.04W
   PORT AUSTIN             M   2.0           14     44.04N    83.00W
   BAD AXE                 M   4.5           14     43.80N    83.00W

...LAPEER COUNTY...
   LUM                     M   4.5           14     43.10N    83.15W
   LAPEER                  M   4.6           14     43.05N    83.32W
   NORTH BRANCH            M   5.8           14     43.23N    83.19W

...LENAWEE COUNTY...
   MORENCI                 M   3.4           14     41.72N    84.22W
   TECUMSEH                M   3.4           14     42.01N    83.94W
   ADRIAN                  E   3.5           14     41.90N    84.04W
   2 WNW TIPTON            M   3.8           14     42.03N    84.10W
   1 SW BLISSFIELD         M   4.0           14     41.82N    83.88W

...LIVINGSTON COUNTY...
   HOWELL                  M   3.5           14     42.61N    83.94W

...MACOMB COUNTY...
   1 NNW UTICA             M   4.9           14     42.64N    83.03W
   SSE SHELBY TOWNSHIP     M   5.2           14     42.67N    83.03W
   4 NNW RICHMOND          M   7.7           14     42.86N    82.78W

...MONROE COUNTY...
   MONROE                  M   2.7           14     41.92N    83.39W
   MONROE                  M   2.8           14     41.92N    83.39W
   3 SW MONROE             M   3.8           14     41.89N    83.43W
   3 SW MONROE             M   3.8           14     41.89N    83.43W
   DUNDEE                  M   4.5           14     41.96N    83.66W

...OAKLAND COUNTY...
   WEST BLOOMFIELD         M   4.0           14     42.57N    83.38W
   2 SE ROYAL OAK          M   4.3           14     42.49N    83.13W
   HOLLY                   M   4.4           14     42.80N    83.62W
   2 SE HOLLY              M   4.5           14     42.78N    83.59W
   FARMINGTON              M   4.5           14     42.46N    83.38W
   BLOOMFIELD HILLS        M   6.0           14     42.58N    83.25W
   2 NW WATERFORD          M   6.2           14     42.68N    83.42W
   4 SW MILFORD            M   6.5           14     42.54N    83.66W
   5 ESE HOLLY             E   7.0           14     42.78N    83.53W
   CLARKSTON               M   7.0           14     42.74N    83.42W
   MADISON HEIGHTS         M   7.0           14     42.50N    83.10W
   WHITE LAKE              M   7.3           14     42.65N    83.50W
   3 S LAKEVILLE           M   7.8           14     42.78N    83.15W
   3 SW LAKE ORION         M   8.8           14     42.75N    83.29W

...SAGINAW COUNTY...
   5 S MERRILL             M   0.5           12     43.34N    84.34W
   2 E MERRILL             M   1.0           14     43.41N    84.30W
   SAGINAW                 M   1.5           14     43.42N    83.95W
   CHESANING               M   1.6           14     43.18N    84.12W

...SANILAC COUNTY...
   SANDUSKY                M   4.0           14     43.42N    82.83W
   MARLETTE                M   4.5           14     43.33N    83.08W
   CROSWELL                M   7.0           14     43.27N    82.62W
   LEXINGTON               E   7.0           14     43.27N    82.53W
   LEXINGTON               M   7.0           14     43.27N    82.53W

...SHIAWASSEE COUNTY...
   OWOSSO                  M   1.0           14     43.00N    84.18W
   2 NE CORUNNA            M   2.2           14     43.00N    84.09W
   DURAND                  M   3.0           14     42.91N    83.99W

...ST. CLAIR COUNTY...
   1 NNW YALE              M   6.5           14     43.14N    82.80W
   2 W ALGONAC             E   6.5           14     42.62N    82.57W
   MARINE CITY             E   7.0           14     42.71N    82.50W
   3 E RICHMOND            M   7.7           14     42.81N    82.70W
   2 W PORT HURON          M  11.1           14     42.99N    82.47W
   3 W LAKEPORT            M  14.0           14     43.12N    82.56W

...TUSCOLA COUNTY...
   CARO                    M   3.0           14     43.49N    83.40W
   VASSAR                  M   3.5           14     43.37N    83.58W

...WASHTENAW COUNTY...
   SALINE                  M   2.8           14     42.18N    83.78W
   1 W ANN ARBOR           M   5.5           14     42.28N    83.75W
   2 NNW ANN ARBOR         M   5.5           14     42.30N    83.75W
   MANCHESTER              M   5.6           14     42.15N    84.04W
   ANN ARBOR               M   5.8           14     42.28N    83.73W
   SE ANN ARBOR            M   6.0           14     42.28N    83.73W
   2 WNW ANN ARBOR         M   6.3           14     42.29N    83.77W
   SALEM                   M   6.4           14     42.41N    83.58W
   CHELSEA                 M   6.5           14     42.31N    84.02W
   ANN ARBOR               M   6.9           14     42.28N    83.73W

...WAYNE COUNTY...
   4 NE DEARBORN           M   3.5           14     42.35N    83.16W
   DEARBORN                M   3.5           14     42.31N    83.21W 
   N LIVONIA               M   6.2           14     42.40N    83.37W
   2 NNW LIVONIA           M   3.8           14     42.42N    83.39W
   NORTHVILLE              M   5.2           14     42.44N    83.49W
   GARDEN CITY             M   5.4           14     42.33N    83.33W
   ROMULUS                 M   6.2           14     42.22N    83.37W
   RIVERVIEW               M   6.3           14     42.17N    83.19W
   WYANDOTTE               M   6.3           14     42.21N    83.16W
   GROSSE POINTE FARMS     M   6.8           14     42.40N    82.89W

__________________________________________________________________________________

12/24/12

Update 12/26 - Winter Storm Snow Amounts

Our first snowstorm of the Winter 2012-13 lived up to its expectations for the most part with a general 4 - 7" snowfall. As expected; areas over the far east had the most snow with some 8 - 10" falls while areas over far northwest (Midland and Bay counties) had little to none. 

Here's the snowfall map and specific amounts from our NWS spotters. Here in northern Livonia, I received 6.2" total with some foot drifts.

Snowfall totals from the December 26th, 2012, Winter Storm

Snowfall totals from the December 26th, 2012, Winter Storm
PUBLIC INFORMATION STATEMENT...STORM TOTALS
NATIONAL WEATHER SERVICE DETROIT/PONTIAC MI
1053 AM EST THU DEC 27 2012

THE NORTHWEST FLANK OF A SIGNIFICANT WINTER STORM IMPACTED POST 
HOLIDAY TRAVEL ACROSS SOUTHEASTERN MICHIGAN ON DECEMBER 26TH. 
WIDESPREAD SNOW LIFTED ACROSS THE MICHIGAN-OHIO STATELINE DURING THE 
LATE MORNING HOURS...ARRIVING OVER PORTIONS OF THE I 69 CORRIDOR 
DURING THE MID AFTERNOON. WHILE THE STORM SYSTEM TRACKED THROUGH THE 
TENNESSEE VALLEY TRANSFERRING ENERGY TO THE EAST COAST DURING THE 
AFTERNOON...AN AXIS OF ENHANCED MOISTURE BECAME ANCHORED OVER MUCH 
OF SOUTHEASTERN MICHIGAN THROUGHOUT THE EVENING. BY DAWNBREAK OF 
DECEMBER 27TH...A GENERAL 4 TO 7 INCHES OF SNOWFALL FELL SOUTHEAST 
OF A LINE FROM BAD AXE TO MANCHESTER...WITH AMOUNTS IN EXCESS OF 10 
INCHES COMMON FOR LOCATIONS IN EASTERN ST CLAIR AND SANILAC COUNTIES 
ADJACENT TO LAKE HURON.

STORM TOTAL SNOW REPORTS

LOCATION                  SNOWFALL     DURATION
                          (INCHES)      (HOURS)        LAT       LON

...BAY COUNTY...
   2 NE AUBURN             M   0.9           14     43.62N    84.05W

...GENESEE COUNTY...
   LINDEN                  M   3.0           14     42.82N    83.78W
   BURTON                  M   4.0           14     43.00N    83.62W
   GOODRICH                M   4.4           14     42.92N    83.51W
   FLINT                   M   5.0           14     43.02N    83.69W
   4 N BURTON              M   6.0           14     43.05N    83.62W

...HURON COUNTY...
   PORT HOPE               M   0.8           14     43.94N    82.72W
   5 NNW FILION            M   1.1           14     43.96N    83.04W
   PORT AUSTIN             M   2.0           14     44.04N    83.00W
   BAD AXE                 M   4.5           14     43.80N    83.00W

...LAPEER COUNTY...
   LUM                     M   4.5           14     43.10N    83.15W
   LAPEER                  M   4.6           14     43.05N    83.32W
   NORTH BRANCH            M   5.8           14     43.23N    83.19W

...LENAWEE COUNTY...
   MORENCI                 M   3.4           14     41.72N    84.22W
   TECUMSEH                M   3.4           14     42.01N    83.94W
   ADRIAN                  E   3.5           14     41.90N    84.04W
   2 WNW TIPTON            M   3.8           14     42.03N    84.10W
   1 SW BLISSFIELD         M   4.0           14     41.82N    83.88W

...LIVINGSTON COUNTY...
   HOWELL                  M   3.5           14     42.61N    83.94W

...MACOMB COUNTY...
   1 NNW UTICA             M   4.9           14     42.64N    83.03W
   SSE SHELBY TOWNSHIP     M   5.2           14     42.67N    83.03W
   4 NNW RICHMOND          M   7.7           14     42.86N    82.78W

...MONROE COUNTY...
   MONROE                  M   2.7           14     41.92N    83.39W
   MONROE                  M   2.8           14     41.92N    83.39W
   3 SW MONROE             M   3.8           14     41.89N    83.43W
   3 SW MONROE             M   3.8           14     41.89N    83.43W
   DUNDEE                  M   4.5           14     41.96N    83.66W

...OAKLAND COUNTY...
   WEST BLOOMFIELD         M   4.0           14     42.57N    83.38W
   2 SE ROYAL OAK          M   4.3           14     42.49N    83.13W
   HOLLY                   M   4.4           14     42.80N    83.62W
   2 SE HOLLY              M   4.5           14     42.78N    83.59W
   FARMINGTON              M   4.5           14     42.46N    83.38W
   BLOOMFIELD HILLS        M   6.0           14     42.58N    83.25W
   2 NW WATERFORD          M   6.2           14     42.68N    83.42W
   4 SW MILFORD            M   6.5           14     42.54N    83.66W
   5 ESE HOLLY             E   7.0           14     42.78N    83.53W
   CLARKSTON               M   7.0           14     42.74N    83.42W
   MADISON HEIGHTS         M   7.0           14     42.50N    83.10W
   WHITE LAKE              M   7.3           14     42.65N    83.50W
   3 S LAKEVILLE           M   7.8           14     42.78N    83.15W
   3 SW LAKE ORION         M   8.8           14     42.75N    83.29W

...SAGINAW COUNTY...
   5 S MERRILL             M   0.5           12     43.34N    84.34W
   2 E MERRILL             M   1.0           14     43.41N    84.30W
   SAGINAW                 M   1.5           14     43.42N    83.95W
   CHESANING               M   1.6           14     43.18N    84.12W

...SANILAC COUNTY...
   SANDUSKY                M   4.0           14     43.42N    82.83W
   MARLETTE                M   4.5           14     43.33N    83.08W
   CROSWELL                M   7.0           14     43.27N    82.62W
   LEXINGTON               E   7.0           14     43.27N    82.53W
   LEXINGTON               M   7.0           14     43.27N    82.53W

...SHIAWASSEE COUNTY...
   OWOSSO                  M   1.0           14     43.00N    84.18W
   2 NE CORUNNA            M   2.2           14     43.00N    84.09W
   DURAND                  M   3.0           14     42.91N    83.99W

...ST. CLAIR COUNTY...
   1 NNW YALE              M   6.5           14     43.14N    82.80W
   2 W ALGONAC             E   6.5           14     42.62N    82.57W
   MARINE CITY             E   7.0           14     42.71N    82.50W
   3 E RICHMOND            M   7.7           14     42.81N    82.70W
   2 W PORT HURON          M  11.1           14     42.99N    82.47W
   3 W LAKEPORT            M  14.0           14     43.12N    82.56W

...TUSCOLA COUNTY...
   CARO                    M   3.0           14     43.49N    83.40W
   VASSAR                  M   3.5           14     43.37N    83.58W

...WASHTENAW COUNTY...
   SALINE                  M   2.8           14     42.18N    83.78W
   1 W ANN ARBOR           M   5.5           14     42.28N    83.75W
   2 NNW ANN ARBOR         M   5.5           14     42.30N    83.75W
   MANCHESTER              M   5.6           14     42.15N    84.04W
   ANN ARBOR               M   5.8           14     42.28N    83.73W
   SE ANN ARBOR            M   6.0           14     42.28N    83.73W
   2 WNW ANN ARBOR         M   6.3           14     42.29N    83.77W
   SALEM                   M   6.4           14     42.41N    83.58W
   CHELSEA                 M   6.5           14     42.31N    84.02W
   ANN ARBOR               M   6.9           14     42.28N    83.73W

...WAYNE COUNTY...
   4 NE DEARBORN           M   3.5           14     42.35N    83.16W
   DEARBORN                M   3.5           14     42.31N    83.21W 
   N LIVONIA               M   6.2           14     42.40N    83.37W
   2 NNW LIVONIA           M   3.8           14     42.42N    83.39W
   NORTHVILLE              M   5.2           14     42.44N    83.49W
   GARDEN CITY             M   5.4           14     42.33N    83.33W
   ROMULUS                 M   6.2           14     42.22N    83.37W
   RIVERVIEW               M   6.3           14     42.17N    83.19W
   WYANDOTTE               M   6.3           14     42.21N    83.16W
   GROSSE POINTE FARMS     M   6.8           14     42.40N    82.89W

___________________________________________________________________________________

12/25/12
Just a quick update to tweak storm particulars as of Christmas night;

Timing of the storm; 
Not much Change
I look for snow to overspread Southeast Lower Michigan from south to north during the first half of Wednesday and continue into Wednesday Night.

Snowfall trend;
Heaviest snowfall (lowest visibilities and most accumulations) at this time looks to be from the mid afternoon into the evening hours...just a few hrs later.

Snowfall amounts;
Models are still a little variable on storm track and amounts. 

The forecast remains basically the same over much of Southeast Lower Michigan except the far west and northwest areas.

I feel with the dynamics and moisture available; snowfalls over much of the region should still range in the neighborhood of         4 - 7" (though I wouldn't rule out some isolated 8" amounts).  The heaviest snow will fall over the east and extreme southeast portions of Southeast Lower Michigan. Lighter amounts of snow of 2 - 4" will be seen over the areas further out to the west and northwest. Therefore; the lighter snows of 2 - 4" would include the counties of Bay, Midland, Saginaw, Shiawassee and Livingston...or basically areas west of US-23 and I-75 in those counties.


Other notable weather;
Wind. Stiff northeast winds will pick up to between 15 to 25 mph with gusts around 30 mph creating blowing and drifting snow as the day wears on. Some lake enhancement snow off of Lake Huron is possible but with relatively "mild" temperatures in the mid 20s to around 30, this shouldn't be a notable lake event.

_________________________________________________________________________________
12/24/12
As mentioned in my previous blog; the potential for a snowstorm for Wednesday into Wednesday night does look likely. From my previous blog;

"Latest indications are the storm will take shape over the eastern Texas; scoop up Gulf moisture and head northeast into the Ohio Valley. How close she comes to Southeast Lower Michigan will dictate the snowfall over the region."

The majority of our model runs now take a strong short-wave of energy in the jet stream, entering over the West Coast early Monday, and still track it east southeast into eastern Texas by Christmas morning. This is an ideal location for these winter storms to fire-up and is one of our preferred tracks /2/ this winter in the Winter Outlook. As you can see on the map below, the short-wave energy generally takes two routes over the eastern half of the U.S.; either from the eastern Texas/Gulf region northeast into the Ohio Valley, or up the East Coast. In this case, the storm is slated to track northeast across the Tennessee Valley and into the Northern Ohio Valley. The energy will then transfer from the northern Ohio Valley to the East Coast where a new storm center will form. 


_________________________________________________________________________________

Little has changed on the timing of the storm; 
I look for snow to overspread Southeast Lower Michigan from south to north during the first half of Wednesday and continue into the evening hours.

Snowfall trend;
 Heaviest snowfall (lowest visibilities and most accumulations) at this time looks to be during the afternoon hours of Wednesday. 

Snowfall amounts;
The European cousin model /Euro/ and our American counterpart /GFS/ are pretty much in agreement now with the timing and track of the storm as of the Sunday night /00z/ run. Note the snowfall maps below from the NAM and GFS (last two snowfall maps).

At this time; I feel with the dynamics and moisture available; a preliminary estimate this far out of in the neighborhood of 4"- 7" seems suitable across much of Southeast Lower Michigan. Of course; any later storm track deviation or intensity, snowfall totals expected will be noted and updated.

Other notable weather;
Wind. Stiff northeast winds will pick up to between 15 to 25 mph with gusts around 30 mph creating blowing and drifting snow as the day wears on. Some lake enhancement snow off of Lake Huron is possible but with relatively "mild" temperatures in the mid 20s to around 30, this shouldn't be a notable lake event.

Step by step map projections

1-Eastern Texas-Gulf Low forming Christmas morning; Note the mild, moisture laden air streaming north out  of the Gulf to feed the developing storm.


2- The low pressure and storm center continues to deepen in very favorable conditions over the Tennessee valley as she tracks northeast with the upper short-wave dynamics. Also note; the "horse-shoe" shaped high pressure engulfing the storm around it.  This is a classic pattern, seen many times as the colder, drier winds of the high pressure are drawn into the storm on stiff northeast winds across the Lower Lakes and Ohio Valley. Eventually this will also act as an atmospheric block or "wall" causing the low pressure to slide off more to the east northeast. The trough (dashed brown line) out ahead of the storm many times tells the path she's aiming for, and in this case eventually western Pennsylvania.


3- Our storm center has pushed into the southeast Ohio/West Virginia region as a new low is given birth on the East Coast Wednesday evening. Note the winds have gradually shifted to nearly due north over Southeast Lower Michigan, a sign the low is beginning to pull away to the east northeast and pressure rises will follow.


 Projected snowfall totals by the NAM and GFS by Wednesday night at Midnight from the Sunday evening runs.

Both models are fairly similar in extent and amounts but with the GFS a bit lower over Southeast Lower Michigan than the NAM. My vote at this time /Sun night/ would be toward the GFS.

                                                                         N A M


                                                                            GFS


As the time approaches, look for updates if needed.

Making weather fun while we all learn,
Bill Deedler -SEMI_WeatherHistorian


Published 215am; Mon 12/24
 

12/22/12

Light Snow Likely Christmas Eve Over Parts of Southeast Lower Michigan and Risk Continues for Heavier Snow Day After Christmas /26th/

Two low pressure systems will affect Southeast Lower Michigan around Christmas. The first; the weaker of the two, will bring the likelihood of light snow across the southern tier of Southeast Lower Michigan on Christmas Eve. An inch or two of snow is possible over portions of the region to constitute as a white Christmas. At this time; the best chances for snow will be below I-69; or from Lansing to Flint to Port Huron and areas south including Metro Detroit and Ann Arbor to the Ohio border.

Next system on the agenda could be our first decent snowstorm of the season...and it's been a long time comin'! Latest indications are the storm will take shape over the eastern Texas; scoop up Gulf moisture and head northeast into the Ohio Valley. How close she comes to Southeast Lower Michigan will dictate the snowfall over the region. The last couple of runs of the various models have backed her a bit northwest toward the Lower Lakes but that's not written in stone, yet. As with any storm; the better sampling of the atmosphere will help dictate the true path of the storm. The energy for the storm is yet to be better sampled over the West Coast and that won't happen until late Sunday into Monday morning.

However; if things continue to develop as models are indicating; snow will likely move into Southeast Lower Michigan during the first half of Wednesday, the 26th. Stay tuned for updates on this developing winter storm potential and any changes for the snow on Christmas Eve.

Ghosts of Christmases Past???

The Whitest of Christmases and Other Christmases Past 
By: William R Deedler; Southeast Michigan Weather Historian
Date: 12 Noon Saturday Dec 22nd, 2012


Frequently during the Christmas Season, meteorologists are asked; Are we going to have white Christmas?  Usually the chance of a white Christmas across all of Southeast Lower Michigan is around 50 percent. Generally, it is agreed among meteorologists that in order to "officially" have a white Christmas, an average of an inch of snow must cover the ground, but not necessarily have to fall on Christmas. 

At this time /22nd/, it looks like it will depend where you are in Southeast Lower Michigan as to whether or not you will enjoy a white Christmas this year. The heavens are going to make us wait to see as our only "hope" for additional snow will come appropriately enough, Christmas Eve. A low pressure system is slated to move thru the Upper Ohio Valley and how far north it tracks will determine any snowfall over Southeast Lower Michigan on the 24th. It does look as though some snow may make it into Southeast Lower Michigan. Officially, an inch of snow must cover the ground at 7am on Christmas morning for it to be deemed a "white" Christmas. 

Last Christmas /2011/ was a relatively mild Christmas with temperatures in the 40s and no snow on the ground; so no white Christmas. However back in 2010; residents across Southeast Lower Michigan did enjoy a white Christmas with generally 1” to 6” of snow across as temperatures hovered in the 20s. However in 2009, much of the Detroit area south did not have a white Christmas but points north across Flint, Saginaw and the thumb region generally had a 1” to 3” snow cover. Back in 2008, we saw a “sloppy, melting white” Christmas. That white Christmas involved the melting of a heavy snow cover from past snows that accumulated throughout December. The best of the snowstorms came before Christmas on the 19th (with another, lesser intense snow falling on the doorstep of Christmas, 23rd -24th). After, however, the heavy snow cover melted in earnest as milder air overspread the region Christmas Eve right through the 26th. Christmas of 2007, saw temperatures rise into the mid 40s to mid 50s a couple of days prior to Christmas and that, combined with light rain, pretty much took care of any hopes for a white Christmas as then, like the later Christmas of 2008, the  previous heavy snow cover melted (but this time in its entirety before Christmas). Some scattered light snow did return, skirting the landscape on Christmas Eve but most areas around Southeast Lower Michigan still only had a trace of snow for Christmas. At White Lake and Saginaw, however, the official inch of snow to make it a white Christmas was barely attained in 2007

Further back, Christmas of 2006, was also mild and therefore, there was no white Christmas. Back in 2005, we just barely squeaked out a white Christmas (at Detroit Metro Airport, anyway) as a mild spell moved in just before Christmas along with rain, melting the snow down from 4” to 1” by Christmas.  Originally, there had been 8” of snow on the ground on the 15th. Besides last year, the last really scenic (no slop) white Christmas occurred in 2004. A snowstorm brought heavy snow (ranging from 8”at Detroit to around 4” in Saginaw and Flint) on the 23rd, which left the region with a nice white cover for Christmas. It was also a cold Christmas also with highs only in the teens and overnight lows below zero. 


Looking over historical weather records of Christmases past since 1900, a wide range of weather conditions were found. While most people would like to believe that Christmas in the Detroit area should be snowy-white and picturesque, more often than not, they're not. Over the past 112 (including 1900) Christmases in Detroit, 53 (47%) have been what would be called "white" with an inch or better of snow on the ground. Keep in mind however, these records are for Detroit; farther north in Flint, the chance of a white Christmas jumps to 56 percent, while in Saginaw and the Thumb region it rises to 61 percent.

Based on the Detroit records, the Santa award for the "whitest" (most snow on the ground) and also the second snowiest Christmas (snow falling on Christmas) goes to the Christmas of 1951! Just over a foot /13 inches/ of snow was recorded on ground late Christmas day with 6.2 inches of the snow falling on Christmas. Temperatures held well below freezing (HI-26/LOW-18), so what snow did fall, remained. A close second to the "whitest" Christmas, occurred the Christmas after the big stock market crash in 1929. Eleven and a half inches of snow was measured December 25th, 1929 at Detroit but only three tenths /.3/ fell on Christmas. Recently, the Christmas of 2000 was very white indeed, but as to how much of a white Christmas (snow depths) is where the confusion came in. Let me elaborate, officially at Detroit Metro Airport, just six inches of snow was recorded on the ground at 7AM Christmas Day. However, just about anywhere west/north and in the city of Detroit itself, amounts were considerably higher with generally 8 to at least 15 inches. At the National Weather Service in White Lake, 15 inches was observed on the ground Christmas morning. No additional snow fell on Christmas Day (nor was anymore really wanted with the surplus already at hand). In any event, for Detroit and surrounding communities, the six inches at Detroit Metro Airport is the official snow depth used for the area.

The snowiest Christmas (most snow falling on Christmas), occurred in 1915 when 6.4 inches fell with a snow depth of seven inches on the ground. The timing of this snowfall was impeccable for Christmas with it actually starting Christmas Eve around sunset. Then, it continued to snow through the night into Christmas day. Actually, even more than the 6.4 inches fell from the entire storm with an additional 1.6 inches falling on Christmas Eve. This gave a snowstorm total of eight inches.  A little light rain did mix with the snow during the forenoon hours of Christmas but with a high temperature of only 33, it did little to mar the "Christmas card" scene. Speaking of "Christmas card" scenes, another heavy wet snowfall blanketed the area just after the turn of the century early on Christmas in 1901. The scene is described in the historical weather books as follows:


    "Night of the 24 - 25 cloudy; moist snow continued,
     heaviest between hours of 1:30 and 4:30 am, ended
     at 6 am. amount of precipitation .62 inches. The
     street cars ran all night to keep the tracks open.
     the snow adhered to trees etc, and made a very
     beautiful scene. Depth of snow on ground at 8 am,
     5.5 inches".


 This "Norman Rockwell Christmas scene" was further enhanced by a heavy coating of frost deposited on the buildings and windows Christmas Eve due to the moisture-laden air. But just like memories of some Christmases past, this majestic Christmas scene quickly faded (melted) during the day as temperatures climbed to 41 degrees, leaving just slush , slop and water. During the Christmases of 2002 and 2003, the weather was similar to both of the white Christmases mentioned above /1901 & 1915/. Here again in 2003, snow started falling Christmas Eve and lasted into at least part of, if not all of Christmas Day. On Christmas Day 2003, snowfalls ranged from at least an inch in the far southeast corner of Lower Michigan to as much as six inches across Detroit's northern suburbs, extending northward across Flint and Saginaw. On Christmas Day of 2002, total snowfall at Detroit Metro Airport was measured at 6.4” inches for both days (Christmas Eve and Christmas) with 3.4” of it falling on Christmas Day, itself. Across all of Southeast Lower Michigan snowfalls generally ranged from four to seven inches. A picture perfect Christmas was created both years with the freshly fallen snow. Like the Christmas snowstorms of 1901 and 1915, the snow Christmas 2002 was also somewhat heavy and wet with high temperatures in the lower 30s and lows only in the mid 20s.

Probably one of the slushiest and sloppiest Christmas Days happened in 1973. What started out as a white Christmas with a heavy 7 inch snow cover, quickly melted to a meager 2” slush mess by nightfall. To add insult to injury, it rained nearly a half an inch during the day.The wettest Christmas on record occurred in 1945 when 1.16 inches of rain fell. The rain actually began Christmas Eve as a light freezing rain and continued freezing until nearly dawn on Christmas, when the temperature pushed above freezing. Until the ice melted, a few tenths of an inch of ice coated everything by Christmas dawn. Needless to say, walking and driving early the Christmas of 1945 was treacherous but Santa was in and out of town in a flash!

Without a doubt, and still in the memories of long term inhabitants of Southeast Lower Michigan, is the warmest Christmas on record, the Christmas of 1982. It was as though the whole area was shipped to Florida for the holiday! The official record high at Detroit was 64 degrees, while Flint did one degree better at 65! These readings are about normal for Tallahassee, Florida! Scenes of shirt sleeved people with shorts running or riding bikes, instead of visions of sugar plums, made the Christmas of 1982 to some Michigan Christmas traditionalist, very hard to take.  This spring-like day was complete with scattered showers and, of all things, thunderstorms! Ironically, the bitterest cold Christmas came just a year later in 1983! Maybe a payback from Mother Nature for the warm weather we were treated to, the Christmas past? The temperature plummeted Christmas eve to a record low of -9 at Detroit and was accompanied by a stiff west wind averaging 25 to 30 mph, creating life threatening wind chills at times of near 40 below zero! Santa certainly brought the North Pole with him the Christmas of 1983, when he made his rounds very early that morning. In addition to the record low Christmas eve, another record low /-10/ was established during the very early morning hours of Christmas.

These Christmases past discussed are more the extreme than the norm across extreme Southeast Lower Michigan. But they do show the variable weather that can occur at Christmas (or any other time for that matter). The "normal" (or average) highs in extreme Southeast Lower Michigan Christmas Day are in the lower 30s, while lows average in the upper teens. 

As Christmas Day approaches check back here on my blog for any last minute updates regarding the holiday forecast and the potential for more snow after Christmas. 


And now, I'd like to wish all who read this a very Merry Christmas and/or Holiday Season and the best in 2013! I plan on continuing my blog for the new year if the fates allow and look forward in reaching out to more people (and hear their comments and ideas) across the globe.

Making weather fun while we all learn,
Bill Deedler -SEMI_WeatherHistorian

12/16/12

update 12/18 - Intense Low Pressure Remains on Track to Surge into the Great Lakes by Thursday with Yet Another Potential Storm Christmas Week

The intense storm and low pressure center spoke about a couple of days ago remains on track to bring a variety of winter weather conditions across the Great Lakes. Heavy snow, Lake Effect snow, rain and strong winds will engulf the Great Lakes region from Thursday through Friday.

Mild, moisture laden air will surge north ahead of the storm center as colder, Polar air drives south; winding her up over the western Great Lakes later on Thursday. Latest computer models have converged somewhat on a fairly common track for early in the winter season; trekking from the Panhandle of Texas /Wednesday morning/, northeast through Missouri /Thursday sunrise/ and into the western Great Lakes (Southwest Lower Michigan) by Thursday evening. This panhandle low or Texas Hooker will affect much of the central, northern and eastern part of the country in some sort of way (see Short Range Discussion at the bottom of post).

Specifically closer to home across Southeast Lower Michigan; again this will be mainly a rain event as true Polar air (cold enough for snow) will be mainly absent for the balance of the precipitation event with this storm. With that being said; at the onset of the precipitation event from overnight Wednesday into Thursday morning, mixed precipitation is possible, especially over the northern half of Southeast Lower Michigan. Snow, or mixed rain and snow will changeover to rain during the overnight hours. For the balance of Thursday as the low approaches, wind blown rain and showers will circulate through the region before changing over to snow and snow showers late Thursday into Thursday night with the passage of the storm center.  Sharply colder temperatures will accompany the strong gusty Northwest winds as temperatures fall from the 40s on Thursday, through the 30s Thursday night and into the mid 20s to around 30 by Friday morning.

Travelers be advised that roads could become slippery in places as the colder air and light snow amounts overspread the region Thursday night. Generally snowfall amounts on the backside of the low should fall into the inch to two inch category over Southeast Lower Michigan with heavier and much higher snow amounts further west and northwest over West and Central and Northern Michigan into the U.P. where Winter Storm Watches are flying.


Christmas Week
 
Some Models are intimating another storm will develop on this newly formed fast track storm path around the Christmas holiday into the 26th. This is still highly speculative this far out but being its a heavily traveled week it is worth noting thay this would not be unreasonable given the dynamics and newly formed pattern and jet stream projected by some models into next week. So; stay tuned for confirmation.


For more on the expected weather and areas to be affected by this storm;


SHORT RANGE FORECAST DISCUSSION
NWS HYDROMETEOROLOGICAL PREDICTION CENTER COLLEGE PARK MD
352 PM EST TUE DEC 18 2012

VALID 00Z WED DEC 19 2012 - 00Z FRI DEC 21 2012

...ACCUMULATING SNOWS ARE EXPECTED FROM THE CENTRAL ROCKIES UP
INTO THE UPPER GREAT LAKES...

...EPISODES OF SEVERE WEATHER WILL BE POSSIBLE FROM THE LOWER
MISSISSIPPI VALLEY EASTWARD TOWARD THE SOUTHEASTERN U.S...

...HEAVY SNOW WILL CONTINUE TO IMPACT THE MOUNTAINS OF THE
NORTHWESTERN CONUS...

...UP TO AN ADDITIONAL FOOT OF SNOW WILL BE POSSIBLE OVER AREAS OF
NORTHERN NEW ENGLAND...


A DYNAMIC UPPER TROUGH CURRENTLY SLIDING SOUTHEASTWARD THROUGH
SOUTHERN/CENTRAL CALIFORNIA WILL QUICKLY REACH THE FOUR CORNERS
REGION BY EARLY WEDNESDAY. DURING THESE NEXT 24 HOURS...STRONG
VERTICAL LIFT WITHIN THE UNSTABLE AIR MASS WILL WORK IN ACCORDANCE
WITH UPSLOPE FLOW TO PRODUCE MODERATE TO HEAVY SNOWFALL ACROSS THE
SOUTHWESTERN U.S. THE HEAVIEST AMOUNTS ARE EXPECTED ACROSS WESTERN
COLORADO WITH OVER A FOOT POSSIBLE IN CERTAIN LOCATIONS. ONCE THIS
SYSTEM REACHES THE LEE OF THE ROCKIES BY MIDDAY
WEDNESDAY...INCREASING LOW-LEVEL MOISTURE FROM THE GULF WILL BEGIN
TO OVERRIDE THE WEST-TO-EAST ORIENTED WARM FRONT. MUCH OF THIS
OVERRUNNING PRECIPITATION SHOULD FALL AS SNOW ACROSS THE CENTRAL
PLAINS AND MIDDLE MISSISSIPPI VALLEY. THE TIGHTENING PRESSURE
GRADIENT WITH THE INTENSIFYING CYCLONE MAY LEAD TO PERIODS OF
BLIZZARD CONDITIONS OVER SECTIONS OF EASTERN COLORADO/WESTERN
KANSAS PER THE LATEST FORECAST OFFICE WATCHES/WARNINGS ISSUANCES.
WHILE UP TO A HALF A FOOT OF SNOW IS EXPECTED ACROSS THE CENTRAL
PLAINS...MORE ENHANCED AMOUNTS EXCEEDING A FOOT WILL BE POSSIBLE
FROM SOUTHERN WISCONSIN UP INTO CENTRAL MICHIGAN. THIS IS IN
RESPONSE TO A DEVELOPING COMMA-HEAD OF SNOW ON THE BACK-SIDE OF
THE SURFACE LOW AS IT DEEPENS ACROSS THE UPPER GREAT LAKES.
BESIDES THE WINTRY PRECIPITATION EXPECTED...SEVERE WEATHER WILL BE
POSSIBLE FROM THE LOWER MISSISSIPPI VALLEY OFF TOWARD THE
SOUTHEASTERN U.S. FROM WEDNESDAY INTO THURSDAY.

THE COMBINATION OF A DEEP AND EXPANSIVE UPPER CYCLONE SETTING UP
OVER THE NORTHEASTERN PACIFIC WITH CONTINUAL ONSHORE FLOW WILL SET
THE STAGES FOR RATHER HEAVY SNOWFALL ALONG THE NORTHWESTERN U.S.
MOUNTAIN RANGES. THE AIR MASS IN PLACE REMAINS COLD ENOUGH TO
SUPPORT SNOW OVER THE MUCH OF THE REGION AND EXTENDING EVEN NEAR
THE COASTLINE OF NORTHERN CALIFORNIA WHERE WINTER STORM WATCHES
ARE IN EFFECT. MOISTURE TRANSPORT SHOULD BE ON THE INCREASE ON
WEDNESDAY AS THE UPPER LOW DROPS DOWN FROM THE GULF OF ALASKA
WHICH WILL MARK THE BEGINNING OF THE HEAVIER SNOWFALL. THE LATEST
HPC WINTER WEATHER FORECAST SUGGEST 2 TO 3 FEET WILL BE POSSIBLE
THROUGH THURSDAY EVENING ACROSS THE SHASTA...WASHINGTON/OREGON
CASCADES...ALONG WITH THE OLYMPICS.

THE ACTIVE WEATHER PATTERN WILL ALSO IMPACT SECTIONS OF THE
NORTHEASTERN U.S. AS AN UPPER TROUGH STRENGTHENS ALONG COASTAL NEW
ENGLAND. A MIX OF PRECIPITATION TYPES WILL BE POSSIBLE BUT SNOW
SHOULD PREVAIL OVER MUCH OF NORTHERN/CENTRAL MAINE. 6 TO 12 INCHES
OF SNOW IS EXPECTED OVER THIS REGION IN ADDITION TO ANY
ACCUMULATIONS THUS FAR TODAY.

 
Making weather fun while we all learn,
Bill Deedler -SEMI_WeatherHistorian

 
______________________________________________________________________
Original Post 12/16-


All our guidance models are converging on a similar solution for a strong storm to affect the Great Lakes region later this week. Latest indications for Southeast Lower Michigan is that the storm will bring rain, wind and milder weather ahead of the system late Wednesday into early Thursday. Colder temperatures will flood the region early Thursday on strong gusty northwest winds and any residual moisture will change over to snow and snow showers. Note; a track further south, as depicted in the Euro could bring more of a mix of precipitation with colder temperatures late Wednesday into Thursday morning.

The system is still days away and better sampling of  dynamics that will create the storm are too. Needless to say, further updates on this early winter storm, its track and resulting weather will be forth coming. Below are the two locations from model projections for this intense storm from Sunday morning's guidance for Thursday morning. Stay Tuned.

 GFS


EURO

Making weather fun while we all learn,
Bill Deedler -SEMI_WeatherHistorian


-HB/HBc

12/5/12

12/6- Update on Storm Aiming at Southeast Lower Michigan on Sunday Projected to be Weaker System

12/6/12-Update
 At this time; reviewing all the guidance on the storm forecast to move into Southern Lower Michigan, I see some minor changes at this time to the general forecast as it looks as though it will be a weaker system. Little change in the general forecast is anticipated as this system should still be mainly a rain producer for extreme Southeast Lower Michigan. Some mixed precipitation further north, mainly I-69 northward is likely. However at the onset; snow or mixed rain and snow is still likely over the entire region as the low moves toward Southern Lower Michigan on Sunday. Warmer air will be drawn northward into the region and thus; any snow or mixed precipitation at the onset, should change to rain over extreme Southeast Lower Michigan. Further north and west away from Metro Detroit; a mix of light snow, sleet and light rain is likely. Amounts will be mainly light across Southeast Lower Michigan with accumulating snows possible further north in Michigan. In any event; all models display a weaker system moving through the Lakes with much lighter precipitation.

12/5/12...
The first winter storm of December is slated to develop over the southern Plains over the weekend; track across the lower Midwest and then head northeast into Southern Lower Michigan by late Sunday night and Monday morning. As the system approaches from Missouri Sunday; cloudy skies and a stiff east to northeast wind early will be the forerunner of some light snow and/or mix precipitation developing Sunday afternoon before changing over rain Sunday night over extreme Southeast Lower Michigan. Further north; from I-69 (Flint to Port Huron) and points north; the changeover may not occur until toward Monday morning. Some accumulation of snow before the changeover is possible anywhere but the main risk would be over the northern areas of Southeast Lower Michigan. Look for all precipitation to change back to snow on Monday as colder air floods the region from the northwest.

This scenario is just a preliminary heads up on the system as our models have been variable on the the exact track. At this time; however it does appear the center of the storm and low pressure system will ride into Southeast Lower Michigan by Monday morning; and that usually brings a mix of precipitation with more rain east and south of the center; and more snow north and west of the center. At this early date; I wouldn't be surprised if the track isn't projected  correctly and may be further west since data that is being sampled and projected is scant at best; so stay tuned. Anything can happen with the track when better data is sampled and I will update as she approaches!

In the meantime; a weaker system will scoot across the region Friday night into Saturday morning and bring the risk of some light rain and snow showers across the region.

The maps below look reasonable and are from HPC for Saturday morning and Monday morning. As the time draws closer; I will include my own drawn maps from preferred models.


Making weather fun while we all learn,
Bill Deedler -SEMI_WeatherHistorian


12/1/12

The Anniversary of the Snowstorm of December 1st, 1974

Back in 2000; I wrote what I called "A Tale of Two Storms" which paralleled the two biggest snowstorms (in amount) to ever hit Metro Detroit. The second storm in the article, I will never forget as I worked it during my first year as a novice with the NWS. To this day, I have yet to see a storm quite like it; as far as the magnitude it snowed and for such a long period of time! Enjoy!  

THE TALE OF TWO STORMS
 
By: William R Deedler, Weather Historian, National Weather Service Detroit/Pontiac Mi  4/00

Initially, I had intended to write about Detroit's biggest snowstorm ever recorded (24.5") but while researching the storm (which occurred way back on April 6th, 1886), I was struck by the uncanny similarities between that storm and Detroit's second biggest snowstorm (19.3") which occurred nearly a century later on December 1st, 1974. Besides the obvious similar snowfall amount between the two systems, other significant parallels could also be drawn. In addition,  while I was obviously not around to observe the first huge storm, I did have the opportunity to witness the second first-hand, in my earliest days with the National Weather Service. Unfortunately, weather maps for the1886 storm are unavailable, unlike the 1974 storm. With the aid of surface observations and weather journals however, at least an estimate of the surface and upper air data can be made. Perusing through the carefully scrolled weather journals of the late 1800's, one can't help but be amazed and "taken back" by the simplistic, yet stylish way of which they were written. In addition to hourly weather observations and climatic statistics, each day contains usually a short synopsis of the weather experienced for that day. It is the weather logs from late on April 5th - April 7th, 1886 that really commands ones attention and awe.
 
APRIL 1886 -
By early April 1886, some residents of Southeast Lower Michigan had most likely started on spring outdoor activities. High temperatures frequently pushed well into the 50s from mid March on; the last hint of snow fell nearly two weeks before on the 23rd. No doubt the growing season's new green vegetation was well underway.
The weather days proceeding the massive and incredible snowstorm hinted little of what was yet to come; however, there were some subtle signs of trouble brewing. The first was a fresh, brisk northeast wind that blew continuously for nearly three days prior to 6th (generally, an easterly wind along with a falling barometer in this region, foretells of foul weather approaching the area). On the 4th into the 5th, observations including temperatures, wind flow and pressure changes indicated an unseasonably cold high pressure system pushing slowly into Southern Canada and the Northern Great Lakes. This persistent and strengthening northeast wind along with an extended period of steady, then slowly falling barometric pressure, during the three-day period (3rd, 4th and 5th), indicates this high was a fairly strong, resilient and a blocking type of high pressure. A second and more foreboding sign of what was to come was indeed a rapidly falling barometric pressure later on the 5th, which foretold of the major storm approaching Southeast Lower Michigan. The surface observations late on the 5th indicated a low pressure and storm center approaching the Southern Great Lakes from the south or southwest (most likely from Illinois, Indiana or Ohio) as the cold high to the north slowly retreated.
The afternoon high on the 5th reached only 38 degrees (about 15 degrees below normal) and then held nearly steady into the evening. Increasing high cirrostratus clouds mingled with the sunset but then, quickly lowered to altostratus and nimbostratus as midnight approached. Light snow began to fly just after midnight and remained light until becoming heavy during the predawn hours. Note the following taken from the actual Detroit Weather Log dated April 6th, 1886:
"Snow began at 12:30 AM and fell light until about 4:30 AM when it began to fall heavy and a tremendous fall of snow continued all day, ending at 9:00 PM. The fall at 7:00 AM was 4.6" and at 3:00 PM was 17.1" and at 11:00 PM, 2.4" making the total of 24.1 inches melted from the snow gauge. The rain gauge was soon snowed full and was practically useless. Total fall of the snow on the level was 24.5 inches. The snow was badly drifted by the heavy gale. The drifts in some places were 12 feet high and the snow in the street was from 10" to 40" inches deep. A heavy north gale set in at 1:45 AM and raged in fury all day reaching 40 miles north at 2:15 PM and continued all the remainder of the day. Its force with the snow was appalling. It blew the snow in fine particles against the face, cutting like a knife."
The synopsis continues with a description of numerous street cars that were abandoned, strewn about and laying in all sorts of positions. As one might expect with the snow falling in April, the snow contained a high water content (2.43") and, therefore, it was very heavy and packed down well. Obviously, wading through the snow to get around on foot was extremely difficult - so much so that it became necessary to use crowbars and ice picks just to clean a path on the street. Maneuvering through, or just moving the snow, was such a monumental chore that even several ton railroad cars were "held prisoner in their houses". On the train tracks, freight cars were immobilized and abandoned across all of Southeast Lower Michigan. Temperatures held in the upper 20s to around 30 through the entire snowfall, with over two feet of snow reported on the ground. The strong northeast to north gale sculptured towering drifts of snow up to 12 feet high across the landscape .The howling wind averaged over 30 mph during the 24 hour period. The lowest barometric pressure reading noted was 29.60 inches at 11:00 AM on the 6th. This reading isn't too terribly deep or severe (the lowest pressure ever observed in Detroit was 28.34 inches during the late January blizzard of 1978), but the pressure was taken only five times daily (7:00 AM, 11:00 AM, 3:00 PM, 7:00 PM and 11:00 PM), so it likely fell lower As the center of the low pressure drifted further north into the Great Lakes on the 7th, milder air from the south was drawn into Southeast Lower Michigan. The sky cleared as the wind shifted to the south and the temperature rose to 40 degrees, in spite of the very heavy snow cover. In the days following the storm, temperatures managed to push up well into the 50s and even reached the mid 70s by mid month, after all, this was April, right?
This storm stands as Detroit's biggest and severest snowstorm and is well summarized by the following quote in the journal and actually would still stand to this day. . .
"The storm was unprecedented in fierceness, snowfall and blockades in the history of the service and the oldest inhabitants can recall nothing to equal it".
DECEMBER 1974 -
It would be nearly a century later before a very similar storm, a sort of "meteorological clone" would arrive and again leave the region snowbound with the second highest snowfall (19.3" as compared to 24.5") ever recorded in metropolitan Detroit in a single storm. While there were several similarities between the two storms, one obvious difference was their timing in the snow season. Also, it is interesting to note here, that neither storm occurred during what is officially called "winter." While the 1974 storm occurred in late fall at the forefront of the 1974-75 winter season, the April 1886 storm showed up on the doorstep of spring.

Besides the similar heavy snowfall between the storms, there is the likeness of the surface observations taken before and during each storm. As its predecessor, the 1974 storm was proceeded by a few days of persistent northeast winds along with an initially rising barometric pressure, then after, an extended period of steady pressure readings before giving way, slowly at first, to falling pressure. Also, like the 1886 storm, temperatures crept up into the mid to upper 30s on both the 29th and 30th (though these highs were not anywhere near as below normal as in the April 1886 storm). On the 30th, the northeast wind averaged around 19 mph with peak gusts close to 30 mph. The persistent strong northeast wind with just a slow climb in daytime temperature was a result of a large stationary polar ridge axis of high pressure that extended in a horseshoe shape (an Omega High) from the Great Plains, north into the Dakotas, then east across Lake Superior into Quebec, Canada and finally south along the East Coast. The high's strength and position also recalls that of the1886's high pressure mentioned previously.
 
The development and track of this super snowstorm was complicated and quite a hassle for forecasters that Thanksgiving weekend. The primitive forecast models (when compared to the more sophisticated and better resolution of today's models) had quite a time in predicting the track of the storm and its intensity. Even up to the day of the storm, the forecast models continued to weaken the center of the storm as it moved into Kentucky and Ohio, while intensifying a new storm along the East coast. On Saturday, November 30th, a strong closed-off 500 MB Low advanced into the Mid-Mississippi Valley, while at the same time, at the surface, an inverted trough of low pressure extended from a low over the northern Gulf of Mexico, north northwest to a second low over Missouri. The consensus of the forecast models was to bring the 500 MB and surface low generally east, into the Ohio Valley and weakening both. In the meantime, the Gulf Low was forecast to track north northeast up the East Coast and intensify; thus, becoming the main low and storm center of the entire system. This was the accepted forecast scenario with the data available at the time and could hardly be argued otherwise. Actually, this predicted path and subsequent weakening of the Ohio Valley low as the East Coast storm intensifies or "bombs-out" is what generally happens. The models failed in forecasting the weakening trend of the Ohio Valley system. The 500 MB Low and the surface low not only did not weaken, they actually intensified and became vertically stacked in the atmosphere. Generally, when this happens the system tends to hold on to its intensity longer and slow down in movement, both of which proved detrimental to the computer forecast.
 
Light snow moved into extreme Southeast Lower Michigan during the predawn hours between 5:00 AM and 7:00 AM. Even at the 5:00 AM forecast issuance, it looked as if just one to three inches of snow would blanket extreme Southeast Lower Michigan for this event. However, by sunrise, already up to three inches of snow covered the region and the snow was not getting any lighter. A stiff northeaster' also accompanied this storm, though not as severely as the 1886 storm, averaging 20 to 30 mph with gusts above 30 mph. By sunrise, an area of snow had settled over extreme Southeast Lower Michigan. On radar during the forenoon hours, bands of heavier snow appeared over Northern Ohio and Lake Erie, trekking west-northwest toward Michigan. By now, the forecasters knew the forecast was in trouble and updated the forecast to read "six or more" inches of snow.

The 500 MB Low and associated energy to support the surface system drifted east over Kentucky, while the surface low that was over Missouri drifted east right along with it. A huge conveyor belt of moisture had set up in the atmosphere extending from the Gulf of Mexico and the Western Atlantic, east into the Ohio Valley and Southern Great Lakes. Not only had the storm tapped the usual Gulf moisture; now Atlantic moisture started to be drawn into the mix. After analyzing surface data from the 1886 storm, it is strongly suspected that this too was the case at that time. Huge moisture plumes from both the Atlantic and Gulf of Mexico fed the1974 storm and likely, the1886 storm, with nearly duplicate surface observations before and during the event.

Bands of snow (much of it moderate to heavy) continued to be produced across the Eastern Great Lake States on the "conveyor-belt" through the afternoon, with the heaviest snow falling across extreme Southern Ontario, extreme Southeast Lower Michigan and extreme Northwest Ohio. By mid afternoon, already between six and ten inches of snow was on ground across much of extreme Southeast Lower Michigan, with generally eight to ten inches in the metro Detroit area. Visibilities were frequently near zero and moderate northeast winds blew the heavy, wet snow into at least three to five foot drifts. Another notable item observed during the storm was frequency of large snow flakes. Generally in the majority of snowstorms there may be a period or two of heavy snow with large flakes and a quick accumulation of snow. During this storm however, there were several periods, or waves, of heavy snow with continuous large flakes and very low visibilities, migrating in from the east over the region.
 
The surface low drifted north northeast from Kentucky into West Virginia by Sunday evening on the 1st and gradually matured and occluded. It still remained however, the dominant low (which was not forecasted by the forecast models), while the second low on east coast moved north at the triple point (at the point where the occluded, warm and cold front of the system met) and never really developed. As darkness fell, generally up to a foot and a half of snow smothered the metro Detroit area, with six to twelve inches elsewhere in extreme Southeast Lower Michigan. During the evening the snowfall became lighter and by midnight, 18.4" was officially observed at Detroit Metro Airport. Another nine tenths of an inch fell early on the 2nd, for a grand total of 19.3" (19.2" of it falling in 24 hours) with Flint reporting a snowstorm total of 8.1". As the low drifted northward, milder air filtered into the region and the snow became mixed with, and then changed to drizzle.
 
Coincidentally, the next day (Monday, December 2nd, 1974), the temperature also warmed to 40 degrees in the afternoon, but the wind remained more northerly rather that shifting to the south (as on April 7th, 1886). This was due to the fact that the center of the low tracked further east of Southeast Lower Michigan into Pennsylvania, rather than into the suspected Great Lakes area in 1886.
 

Making weather fun while we all learn,
Bill Deedler -SEMI_WeatherHistorian


11/30/12

Support For Cold Winter In The East Grows


Take a look at this interesting article on Judah Cohen's Winter Outlook based on Siberian Snow Cover. I remember when this study came out a few years back and I mentioned it in one of my Outlooks. His Outlook for the East matches well with my Winter Outlook and accompanying analogues this winter that strongly suggest below normal temperatures also across Southeast Lower Michigan.

Meet Judah Cohen. Director of seasonal forecasting for Atmospheric and Environmental Research (AER), a Verisk Analytics company, Cohen has earned fame in the weather community for developing cutting edge techniques for issuing winter outlooks which show tremendous promise.

In short, Cohen relates the amount of snow cover and its rate of advance in Siberia in October to temperatures during winter in North America. The more snow in Siberia and the faster it increases he suggests, the colder it’s likely to be in the eastern U.S. This October, snow came down fast and furious in Siberia and, thus, Cohen is bullish about a harsh winter for the eastern U.S.

Rest of article here. 

Set of data numbered with Eurasian snow cover and subsequent winters in the US. Note #2, if you take this data and projections verbatim; we were doomed with a cold winter!


Making weather fun while we all learn,
Bill Deedler -SEMI_WeatherHistorian


11/28/12

So; What Do The Analogues Say For December?

As mentioned when previewing my Winter Outlook for the Winter of 2012-13; I intended to do more subsequent work or as I put it "new formats for the up-coming winter"

In the 15 years or so in using specified analogues I researched; more often than not they were helpful in projecting the season outlook. While last winter was a bust; in many of the preceding winters before last winters; the analogues helped in projecting temperatures, snow and overall trends during the winter. This was more the case when there was a decided preference on a certain weather element such a temperature or snowfall being above, below or normal. Will it happen this winter; I certainly hope so but in any event, there are variables to consider.

One of the most important things to consider is timing and subsequent trend in the Outlooks. A good example of that was stated in my Outlook this go around. When mentioning the trend seen in the past in these analogue winters, the trend was for the "first part of the winter to be harder or harsher".  Explaining this further; it has been my observation that winters (both temperatures and snowfall) generally unfold in four main ways and two less often ways. 1- First half the worst 2-Second half the worst 3-Early and later winter the worst with break mid winter or 4-Early and late winter relatively tranquil and mild but mid winter rough. The two that are less often are; 1-A rough and cold winter throughout 2- A tranquil and mild winter throughout. It is unusual to get wave after wave of cold or mild air throughout the winter though of course; it does happen. A good example of a recent mild winter was just last winter when the temperatures averaged well above normal and placed the region in at the sixth warmest winter on record at Detroit; fifth warmest at Flint and third warmest at Saginaw. All three cities placed in the top 20 warmest months for December, January and February. The winter of 2001-2002 was similar and I commented I thought last winter was very similar to that of 2001-02. As it turned out; the Winter of 2011-12 placed close to 2001-02 for mild winters along with the strong El Nino winter of 1997-98.

In regard to the above mentioned trends of winter; very rarely do you see these trends distributed nice and neatly in each winter month. On the other side of the coin; trends usually don't come all wrapped up nicely in individual monthly sequences; whether it be colder, warmer; snowier or snow-less than average. Many, many times prevailing trends of the month tend to overlap before or after the month. Meteorological oscillation patterns tend to prevail in a two to three week dominance. Therefore; when we look at composites for monthly sequences during the analogue years they a reflecting only the anomaly for the particular month not the dominant trend. For an example; the first three weeks in December could average below normal but the last week well above normal and thus; wiping out the dominant temperature trend of the month. While at the NWS and writing the Monthly Climatological Summary for Detroit and Flint (which included Saginaw), I saw this conflicting problem many times. I therefore, developed the "headline trend" of the month, which at times, could be completely opposite of the statistical figures.  As an example; say the average temperature departure for December was +1.7 degrees. On just that alone; you'd think it had been a relatively mild December. However; digging deeper you find out that the first three weeks of the month averaged below normal and just the last week or so, well above. Therefore the "dominant trend of the month" was actually below normal but was eliminated when the monthly statistical temperature calculated; averaged above. Actually; this happens fairly regularly and I felt it should be addressed simply for the reason that it is more accurate for climate/public purposes and to a lesser extent, the public tends to better remember the dominant trend of the month.

Analogue Temperature/Precipitation Composites 

When looking at temperature or precipitation composites for the month, we are looking at the anomaly for the month; meaning whether the month averaged above, below or at/near the statistical "normal" used. This normal used also becomes important because what normal you use can have a notable difference on the outcome. I have been a long-time critic of our /NWS/ 30 year normal process since it is so narrow and short termed regimented. I feel at least a 50 year normal would serve the public better and also would be at least; a little more accurate. However; when looking at alternating cycles of ENSO, NAO, PDO etc etc, a climatologically more inclusive 80 or even 100 year normal is optimal. It has been proven that many of those oscillations follow a gradual 35-45 year cycle from below to above; and then another 35-45 years to below again. Therefore; a complete cycle or "wave length" would take an estimated 80 years or so. Therefore; an all inclusive normal in regards to include the complete wave length of many of these oscillations should be at least 80 years. And ironically; close to the a person's average life time expectancy - also a plus for the public and to use it. It becomes more relevant to the public as they age and relate past climate trends to current. Using 30 year normals would be more relevant for studying more recent trend changes with scientists. Also; like the present, the normals would be revolving or updated every ten years. Therefore; as of 2012, the normals used for temperatures, precipitation and snowfall would come from the years of 1930-2010. Then in 2020-21, the new normals would come from 1940-2020. Ok, ok, ok..enough on my climatological normals soapbox! What do the analogues show for the month of December?

December 2012
                                                                                             Map-1

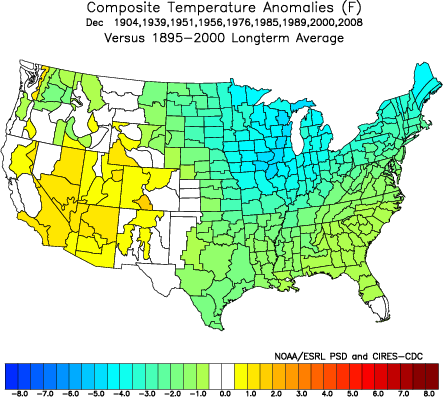
Temperature Anomaly Composites


                                                                                                                    Map-2


The composites show a colder than normal December on average in the past when using our analogue winters. Remember above when I mentioned the anomaly (departure) is of course, relative to the normal used. Note; the subtle moderating effect (about a degree or so, depending on location) the longer term average has on the anomalies. Basically meaning; our normals now (1980-2010) in map-1 are warmer than the 105 year normals (1895-2000) displayed in map-2. There were some cold, a few brutally, December temperature averages in that lot; 1976 - 21.5...1985 - 22.2...1989 - 18.0 and 2000 - 19.3. Thus, the anomaly is skewed down somewhat and remember in the past I've said the anomaly (departure) sign is more important than the numerical value. Therefore; basically the analogues are portraying a below normal temperature month with December colder than "normal". This also feeds into the thinking that the first half of the season in the past was the harsher.


Precipitation Anomaly Composites


In the past Decembers; the general precipitation for December averaged around normal. If the temperatures verify colder than normal and precipitation is near normal, that would set us up for at least normal to possibly above snowfall. Hmmm...we've certainly been hard pressed to see any decent snows around here lately; so THAT would be a change. The precipitation pattern intimates a subtle storm track around the Gulf states and up into the eastern Ohio Valley/eastern Lakes Region and another in the Plains; through the Upper Midwest and Upper Great Lakes. Another possible track would be up around the Gulf states; then up the East Coast with most of the precipitation well inland.

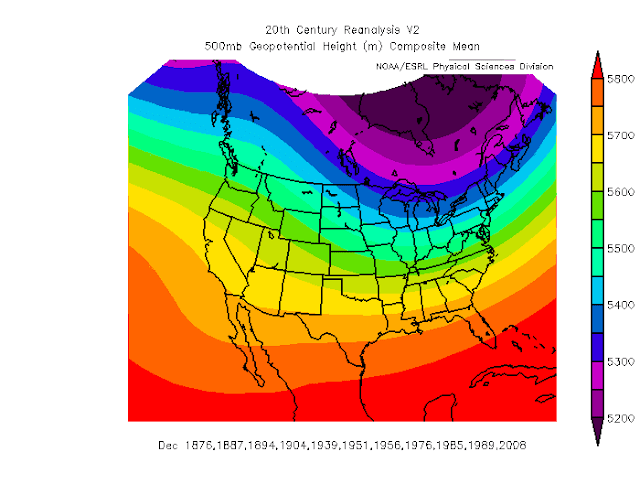
500 MB Mean Height Composite


500 MB Mean Anomaly Composite


No doubt about what the analogues (mean 500 MB Jet and anomaly) blatantly suggest for the upper flow; ridge in the west and trough in the east. Is this for the whole month? If you read the first part of this blog; you should know the answer. NO! What the analogues are suggesting to me anyway; is that this was the main pattern in many of the previous analogue December's and again; may be our dominant or most notable pattern this December. We shall see!

Making weather fun while we all learn,
Bill Deedler -SEMI_WeatherHistorian