Sep 21, 2021

Autumn Begins on the Calendar this Year ~ Not Meteorologically

/330pm Tue 9/21/21/

More of than not; Fall around Southeast Lower Michigan begins mid-late September not the first few days of the month, or what's called "Meteorological Autumn". In addition; I've observed over the years that subtle hints of fall show up mid August to mid September with the first waves of cooler air masses making it into the Great Lakes. And finally; another observation, true summer across the region is mid June through mid September.

As the upper air environment begins to respond to the failing sunlight across the Northern Hemisphere; colder surface air masses evolve and begin to respond by progressing southward across the globe. But there is a lag; it takes time due to many variables; one major one are oceans are still near their surface warmest temperatures from heating arriving in spring; accelerating in summer and basing at their warmest later summer into early fall - thus the tropical storm formations. 

Another is topography; mountains, flat lands and Lakes. As colder air masses begin to slide south down across the Northern Hemisphere topographical area also; variability in heights and regions result varying speeds of delivery and encourage the formation of meteorological systems, a example will be seen this week into the weekend. Yes; Autumn has truly arrived this week but as many seasons before, summer-like weather will again stick its nose back in our faces - but with lesser solar and air mass temperature intensity. Onto the maps...

Latest version of the GFS and various other models bring copious amounts of rain in this weeks transition. Maybe somewhat overdone on extent of heaviest rainfalls but there is unusual strong agreement in a notable wet period later tointo Thursday night as the colder air oozes into the area. Look for temperatures to notch down with time into the 40s for lows and 50s to around 50 by the weekend. Along and mainly behind a cold front; a low pressure deepens over the eastern Great Lakes  into Thursday. Looking at the moisture available and lift along with stalling of the system, generally 1.50" - 3.50" of rain and to upwards of 4+" in pockets of rain is possible into Thursday eve. Positioning of heaviest rain seems to be at this time over the south-central or east portions of Southern Michigan. We'll see how the system unfolds with time.

Also; note the two aggressive upper air "bowling-ball" colder vorticity (or spin in the atmosphere) systems that at this time are slated to affect the Great Lakes into the weekend. One takes form right over the Lakes (and contains much of the heavy rain) and the second; shoots southeast into the Great Lakes from southwest Canada. This is reminiscent of Clipper systems seen in the fall and especially winter.  Hmm...shades of the winter pattern developing? Well; another La Nina is on the horizon for the autumn into the winter and Clippers were active last winter and of course; Clippers are dominant in most La Ninas.

Upper air pattern into the weekend

Surface systems


GFS QPF thru late Thu


 3 KM NAM QPF thru late Thu


EURO QPF thru late Thu


Latest HRRR Short Term QPF thru Thu afternoon /as of 18z/


Stay tune for brief updates on FB under:

William Deedler/Southeast Michigan Weather Historian

In addition: we'll start looking at what the winter weather is expected to look like by first discussing hemispheric patterns evolving.

________________________________________________

UPDATE_SEP 24TH 2021

Well! - Total 36 hours rainfall from 5pm Wed to 5am Fri

9/22-24/2021 in North Livonia ~ 4.40"
Sep thus far 9/24/2021 ~ 5.10"
Norm for all of Sep ~ 3.22"

Storm Summary from DTX
https://www.weather.gov/dtx/HeavyRain_09212021

Making weather fun while we all learn, 

Bill Deedler -SEMI_WeatherHistorian


Jul 14, 2021

Dry Year thus Far...That is Until Summer With Warm June Flooding - Varability Forecast Continues

https://www.cpc.ncep.noaa.gov/products/CFSv2/imagesInd3/usPrecSeaInd2.gif 

I headlined the Summer Outlook with; Will Variable Spring Weather Lead to a Variable Summer? This has been pretty much the case with the first half (yes officially, the meteorological summer is half way over mid July in spite of Labor Day weekend). Hot with a few notable cool spells, locally damaging storms, heavy flooding rains all intertwined with beautiful, pleasant summer weather. 

Summer analogues were quite mixed with rainfalls with dry, wet and one or two near normal rains. Which is why I went exactly what they had: below normal, above normal or normal...depending on location, location, location. Storm and frontal patterns have settled in the lower Great Lakes as air masses vie for dominance. Storm tracks and associated severe weather were a bit slow to materialize but made up for the delay as June unfolded.

After months of below normal precipitation, the dryness of the first half the year was alleviated to a large extent by the heavy rains and storms in June. As discussed; rains for the growing season were later than gardeners and farmers would have liked but their arrival was still very important for the growing season. Many areas got too much of a good thing with rainfalls of 4-6+" of rains by the end of the month and areas of flooding. Average or normal rains for June generally run 3-4", give or take a little.  And; as they say; a picture (or two) is worth a thousand words....


Yes, I know it's pretty tiny to read...for us needing coke-bottles>>>

Monthly Totals


Many areas hit with tropical-like rains 25th-27th

Sorry this map doesn't have cities & towns but counties are visible along with close approximations of Junes entire rainfall. It's not surprising to see why some of the newsworthy issues came up across the metro Detroit region; west along the I-94 corridor and northward to I-96 (Jefferies) / M14 region to west into and around Ann Arbor late in the month. Very heavy, tropical like rains deluged that region along a stationary front and low pressure area interacting with a tropical-like air mass. Rainfall totals with 6" to in excess of 8" were reported just in a 3 day period (see the DTX write-up here of the flooding and severe weather with a tornado touch down at Port Austin). This system was mainly responsible for the high rainfall totals of June across much of the region with some locations receiving in excess of ten inches. The very heavy rain areas only increased in size west over South-central and Southwest Lower Michigan.

Rainfall totals for June are smoothed in the first map below, with the second map showing much of the area receiving up to 200-300% of June's normal rainfall total on the Midwest Climate Center maps.

All three meteorological city rainfalls made it into the the top 20 wettest Junes. And; if you look a little longer - you'll see each location has had FIVE Junes thus far; making the wettest Junes list since the turn of the century. Still a little longer scan and you'll note a number of dry Junes have also placed since 2000, three at Detroit and Flint and two at Saginaw. This also reflects the variability found in the analogues but with a notable lean toward wetter. Typical summer rains tend to be feast or famine more so due to the nature of convective rains.


Rank Detroit Area* Flint Bishop** Saginaw Area***
Wettest Driest Wettest Driest Wettest Driest
Total Year Total Year Total Year Total Year Total Year Total Year
1 8.31 1892 0.55 1895 6.57 2009 0.63 1988 10.76 2017 0.61 1988
2 7.04 1987 0.94 2011 6.52 1994 0.67 2016 6.92 1996 0.64 1952
3 6.97 1902 0.97 1988 6.40 2021 0.72 1995 5.82 1928 0.76 1912
4 6.97 1896 1.01 1959 5.87 1949 0.79 1933 5.65 2008 1.03 1927
5 6.58 1960 1.04 1984 5.58 1943 0.83 2012 5.15 1967 1.19 1956
6 6.42 1980 1.06 1952 5.48 2019 0.90 1952 5.09 1935 1.23 1925
7 6.32 1903 1.07 2002 5.46 2015 0.92 1984 5.05 2021 1.38 1918
8 6.05 1993 1.08 1904 5.40 1968 1.14 1959 4.93 1917 1.39 1964
9 6.01 2013 1.19 1933 5.37 1928 1.19 1932 4.92 1994 1.48 1959
10 5.90 1881 1.30 2016 5.36 1967 1.25 1998 4.83 1987 1.50 1991
11 5.75 1986 1.31 2012 5.31 1962 1.37 1925 4.75 1915 1.53 1990
12 5.49 1920 1.35 1932 5.23 1993 1.48 2002 4.71 1976 1.53 1923
13 5.46 1999 1.39 1934 5.13 1986 1.54 1985 4.67 1954 1.55 1997
14 5.42 2010 1.42 1913 4.90 1989 1.57 1997 4.62 1948 1.57 1929
15 5.32 2015 1.46 1922 4.82 1948 1.57 1934 4.56 2011 1.62 1941
16 5.27 2009 1.47 1910 4.70 1977 1.60 1987 4.49 2010 1.65 2006
17 5.24 1906 1.48 1911 4.68 1975 1.62 1923 4.41 1943 1.70 1934
18 5.16 2021 1.51 1876 4.56 1940 1.66 1978 4.37 1945 1.73 1966
19 5.15 1898 1.55 1995 4.51 2013 1.66 1922 4.22 1939 1.75 1963
204.9919681.6119564.4419451.7719274.2119401.772016

      * Detroit Area precipitation records date back to November 1874.
** Flint Bishop precipitation records date back to January 1921.
*** Saginaw Area precipitation records date back to January 1912.


JUNE TEMPS

June's average temperatures were warm and sultry; warm enough to place in the top 20 warmest Junes at all three locations (Detroit, Flint and Saginaw. Even though warm; that's a bit misleading as the month was also blessed with intermittent, refreshing short cool breaks as the upper jet occasionally shifted to the north as upper lows over eastern Canada pushed cooler air masses into the Lakes Region. Here too; note the number of warmer Junes since 2000; Six at Detroit, four at Flint and five at Saginaw. Curiously; no colder Junes have made the lists since 2000 - except Flint with two. The Flint temperature observations are least affected by urban heat as compared to Detroit.

Top 20 Coldest/Warmest Junes in Southeast Lower Michigan
 
Rank Detroit Area* Flint Bishop** Saginaw Area***
Coldest Warmest Coldest Warmest Coldest Warmest
Temp Year Temp Year Temp Year Temp Year Temp Year Temp Year
1 62.8 1985 74.6 1933 60.1 1969 75.0 1933 60.6 1982 73.8 1933
2 62.8 1903 74.1 2005 60.9 1958 74.9 1934 61.0 1926 73.5 1919
3 63.1 1915 74.0 1919 61.5 1980 72.1 1949 61.5 1915 72.3 1971
4 63.4 1928 73.3 1949 62.5 1985 71.7 1925 61.8 1958 72.3 1934
5 63.4 1926 73.2 1934 62.5 1972 71.5 1921 61.9 1917 71.7 2005
6 63.4 1916 72.8 2021 62.9 1982 71.4 2020 62.1 1980 71.1 2021
7 63.6 1927 72.8 1943 63.1 1977 71.3 1943 62.1 1916 70.5 1976
8 63.7 1980 72.7 1952 63.3 1960 71.2 2005 62.3 1945 70.5 1931
9 63.7 1889 72.4 1991 63.4 1928 70.3 1952 62.6 1928 70.4 1949
10 63.8 1878 72.3 2012 63.6 1945 70.3 1987 62.7 1977 70.3 1967
11 63.9 1958 72.2 1994 63.8 1927 70.3 1939 62.8 1985 70.2 1932
12 63.9 1902 71.6 1995 64.2 1992 70.1 2021 63.2 1947 70.0 1995
13 64.1 1917 71.6 1890 64.5 1947 69.8 1931 63.5 1969 69.9 2007
14 64.2 1982 71.5 2018 64.6 2003 69.8 1923 63.7 1972 69.9 1923
15 64.2 1972 71.5 1944 64.7 1961 69.7 2016 63.8 1927 69.9 1930
16 64.4 1881 71.4 2010 64.9 1986 69.7 1991 64.2 1978 69.9 1921
17 64.6 1935 71.4 1921 64.9 2009 69.6 1954 64.2 1940 69.8 2012
18 64.6 1897 71.3 2007 64.9 1974 69.6 1932 64.2 1924 69.8 1987
19 64.7 1969 71.3 1954 65.1 1978 69.5 1971 64.3 1918 69.7 2014
2064.8190771.3198765.1194869.5194464.4198669.7199


What about the rest of the summer? There were a few trends noted in upper air patterns and the analogues in the Outlook possibly reflecting temperature and rainfalls for the rest of the summers.

While I determined the analogues averaged too cool:

From Outlook

Mainly because of the warming the latter quarter of the 20th century into the early 21st century; analogues from earliest periods have been generally discounted or less weighted than the later period analogues. Basically; many of the earlier analogues have been considered too cool for our present warmer period the past several years. However; all analogues are considered for patterns and timing.

Remainder of the summer:

Keeping in the above normal temperature mode for the remainder of the summer along with now; normal to above rainfall. Recent and longer term model patterns do suggest warmer and wetter conditions. However; analogues do suggest a drier month or period anyway is due the second half of the summer. Nearly all analogue summer years had a notable drier period and more likely in the second half of the summer. We'll see.


 Models:


As you can see the CFSv2 displays a "W" type of La Nina(s) from last winter to the up coming autumn into winter 2021-22
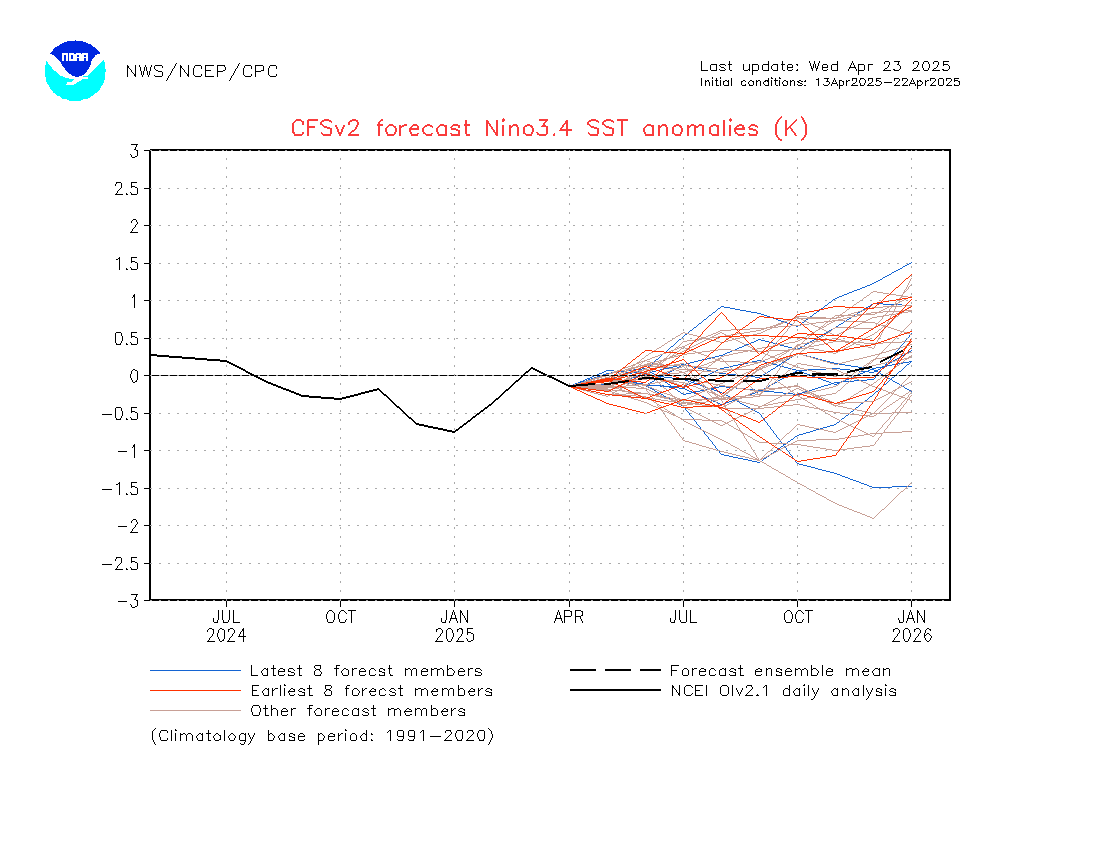
https://www.cpc.ncep.noaa.gov/products/CFSv2/imagesInd3/nino34Mon.gif

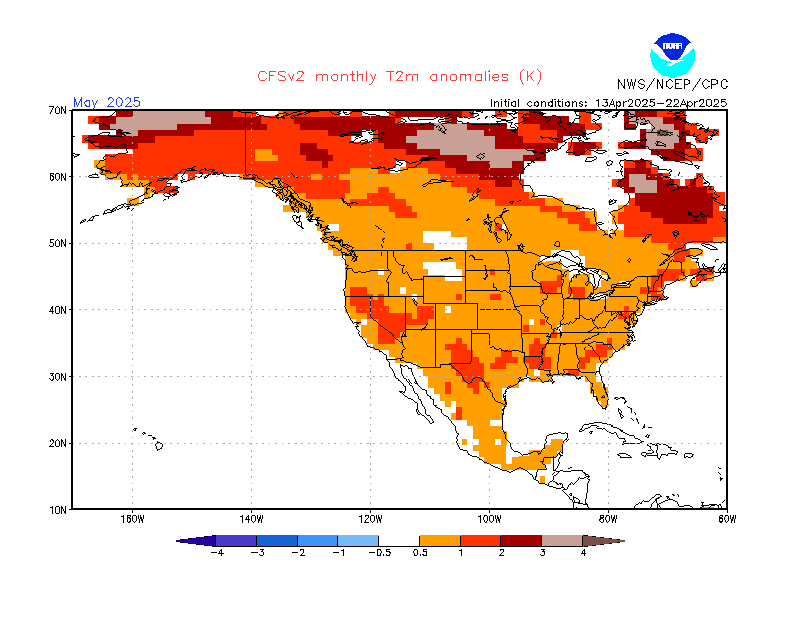
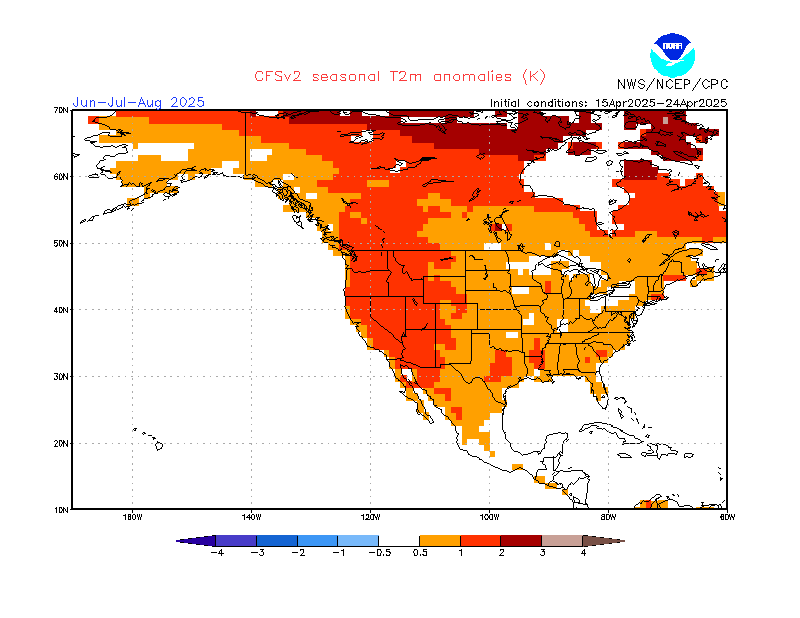
 TEMPS

https://www.cpc.ncep.noaa.gov/products/CFSv2/imagesInd3/usT2mMonInd1.gif

 https://www.cpc.ncep.noaa.gov/products/CFSv2/imagesInd3/usT2mSeaInd2.gif

PCPN

It's interesting to note the model catches a non-determinant rainfall forecast for August over Southern Michigan, which is wrapped around with above normal rainfall chances. This loosely reflects the analogue drier periods and is more reflective the natural rhythm of frontal action working northward across the Lakes late summer.
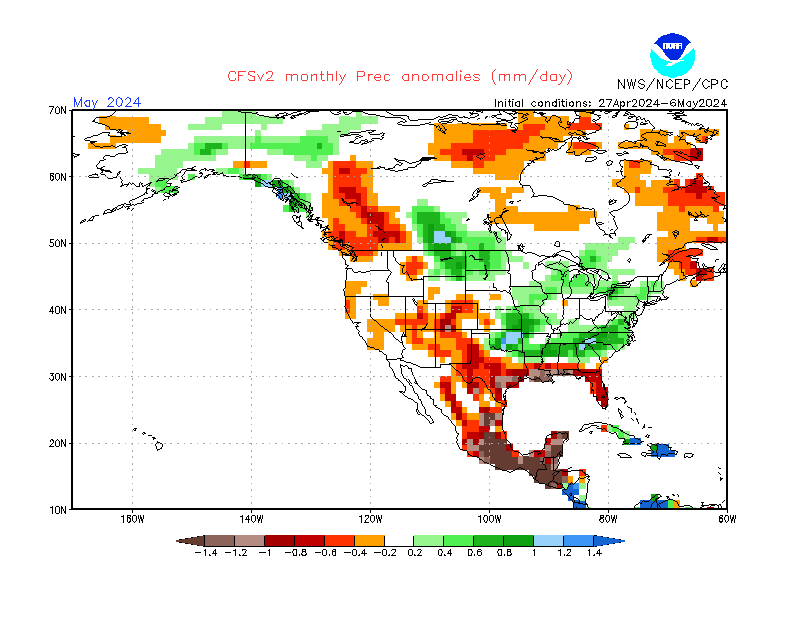
https://www.cpc.ncep.noaa.gov/products/CFSv2/imagesInd3/usPrecMonInd1.gif

The Outlook for the autumn reflects warmer with lesser precipitation conditions reflective in La Nina falls.
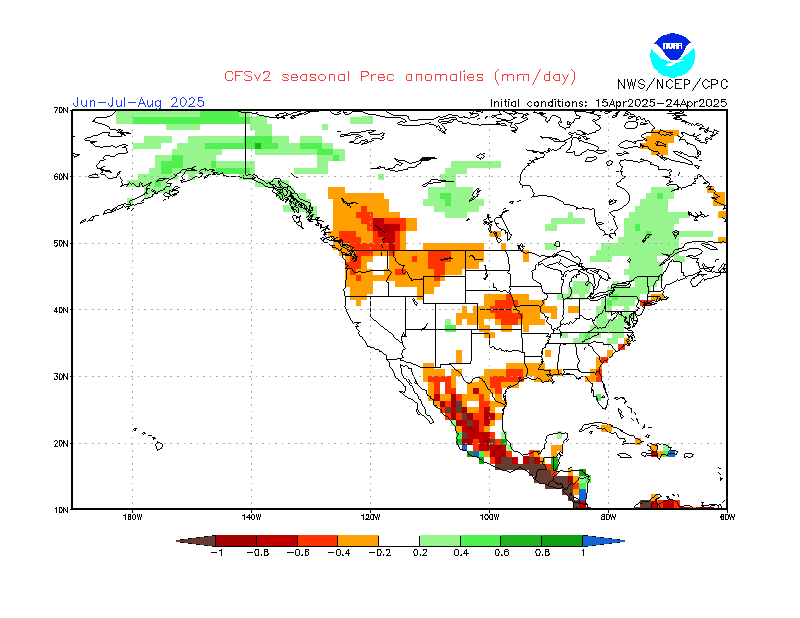
https://www.cpc.ncep.noaa.gov/products/CFSv2/imagesInd3/usPrecSeaInd2.gif

https://www.cpc.ncep.noaa.gov/products/CFSv2/imagesInd3/usPrecSeaInd2.gif

Taking a trip around the world and interrogating climate models shows a bit lean toward a stronger La Nina for the 2021-22 season. Engaging in that last year, the CFSv2 reflected that view for last year's La Nina.


Milder autumn temperatures are rule across the pond, also.


A drier trend also creeps into the Midwest and continues in parts of the Plains..


Newsworthy weather and other articles will pop-up from time to time on FB and here, on my Weather Historian page. Enjoy the rest of the summer and autumn!

Making weather fun while we all learn,
Bill Deedler -SEMI_WeatherHistorian


Jun 1, 2021

Will Variable Spring Weather Lead to a Variable Summer?

If the weather the past few months seemed unusually erratic -even for spring- with cold spells and frost, hot spells with near record highs, dry spells going on for a couple weeks without rain then only to be deluged in a week’s time or less with a couple inches of rain recently; that was our spring - now how about summer?

Strangely enough, while the summer analogues are initially saying the same thing; variable - the picture becomes clearer as we delve deeper into the analogues and computer guidance. It’s really not surprising that on the surface; the initial data intimates the same thing for a few reasons. We are going into a season that is least likely to be affected by hemispheric patterns, an ENSO that is outright neutral and analogues that seem to reflect various patterns. Since that is the case; further investigation, then the weighted years and trends must be uncovered and decided for this Outlook. After this researching, the following is forecast for the summer...

TEMPS:

Above normal temperatures should dominate the overall general pattern with occasional significant cooler shifts in temperatures due to retrograding and/or wavering upper air patterns. Still, I look for temperature departures from normals /1971-2010/ +1.0 to +2.5. For summer trends in temperatures; see Analogue section.

RAINFALL:

Summer rainfalls and departures are probably the most difficult to predict due to the majority of the rains being convective.  That being said; I look for quite variable rainfalls; below normal to above. Current trends suggest the better rains to fall from the Thumb Region to Ann Arbor and  southeast to the Michigan/Ohio border. Again; summer trends are discussed in the Analogue section


ANALOGUES FOR LA NINA TO NEUTRAL WINTER TO SUMMER 2020-21

Mainly because of the warming the latter quarter of the 20th century into the early 21st century; analogues from earliest periods have been generally discounted or less weighted than the later period analogues. Basically; many of the earlier analogues have been considered too cool for our present warmer period the past several years. However; all analogues are considered for patterns and timing. Note the average summer temperature of the highlighted warmer summers is 72.5/+0.8


Analogues highlighted are more weighted than others.

TEMPS/TRENDS

All Monthly trends of the summers reflect cooler Junes, warmer July's and normal August's. When discounting the cooler analogues; then leaning more toward the yellow highlighted years gives a different picture. Preferred, highlighted Junes averaged above normal, 70.6/ +1.2; July's 74.5/+0.9 and August's 72.4/+0.4. All averaged above normal with June's the largest departure at +1.2. July was a close second with a departure of +0.9. while August came in at +0.4.  Keeping one eye on the analogue data and the other on the projected upper air maps; early to mid summer has the best chance to average above normal with mid to late summer around normal. This matches well with a retrograding ridge mid to late summer and troughing also shifting west with time. (see maps).

RAIN/TRENDS

Rainfall is again, like many summers; feast or famine. When all rainfalls are averaged; they average  near normal (within a inch), 9.24"/-0.65; but there still was a decided slant to below normal by the departure and four summers being drier than average (more than an inch below normal). Only one summer was wetter and the other three were near normal. I feel there is a stronger than average case for below, above and normal rains this summer - location, location, location.

COMPUTER GUIDANCE

Generally upper high pressure is a dominant player during the summer; allowing only intermittent low pressure and surface fronts through the country. If upper air projected patterns are correct; this should become more common later in the summer. Upper air guidance from the CFS for the season and monthly shows the following scenario.

 SUMMER 2021


High pressure aloft focuses on the east-central area of the country early in the summer with a gradual retrograde westward mid-late summer. Note each month's map.

JUNE

1- Late May into June; a semi-permanent, subtropical area of high pressure in the North Atlantic off    the East Coast, normally spreads west across the Eastern and Central U.S.


JULY

 2- As the high pressure retrogrades westward; this allows troughing into the Northeast with time.

AUGUST

3- Later in the summer, troughing shifts westward into the Lakes.


Maps from CFS for temps/pcpn for the summer


 Enjoy the summer! Look for other notable weather write-ups and trends through the summer if conditions warrant.

Making weather fun while we all learn,
Bill Deedler -SEMI_WeatherHistorian


May 27, 2021

Winter 2020-21; A Rather Uneventful, Mild Winter - That is Until February

Winter of  20 - '21 was a somewhat boring, slow and mild winter with February the only "real winter month" of the three.

There was a rather mild intro to winter from the get-go in December that carried right on through January. Temperatures averaged several degrees above normal both months across Southeast Lower Michigan and it looked as though we were going "skate" through another relatively balmy winter as we had the winter before /Winter of 2019-2020/. All three winter months in that winter averaged above or well above normal. This left Detroit with its 9th warmest winter with 32.6 degrees; Flint had its 5th warmest winter with 31.5 and Saginaw checked in at 29.8 degrees/7th warmest winter. 

Our most recent winter didn't change direction until early in February with much colder weather; heralded in by a drastic shift in the predominant upper air pattern to the Arctic. Before the change; a rather persistent upper air troughs routinely pushed into the West Coast; as discussed in my Winter Outlook; 

Pacific/North American /PNA/ Pattern

 A negative /-PNA/ generally reflects a trough over the western portion of the US with ridging and warmer weather in the East.

The Pacific Jet Stream remained dominant much of the early to mid winter and thus; only occasionally allowed colder, polar air into the eastern part of the country. For much of December and January; colder and stormier weather slammed into the northeast Pacific; then down into the Rocky Mountain range (note white path and arrows in the negative PNA pattern above). This also encouraged a mild to warm, upper and surface wind flow from the southwest and south into the Ohio Valley and Great Lakes.

During February; the PNA shifted to a dominant positive pattern bringing the stored up, Arctic cold in the form of several polar vortexes pushing down into the center part of the country, then spreading out east and south. It was at this time; notable record cold and snow occurred mid month with the influx of the "blue norther".


Statistics for the Winter 2020-21

WINTER TEMPS


2020-21 SEASON SNOWFALL


 Winter Forecast & Analogue Performance

Closer to home; let's take a look at the winter statistics for Detroit, Flint and Saginaw and compare it to the Winter Analogue statistics...and most important; the forecast.

Forecast was for:

Temperatures - Normal to Above (or -1.0 to +2.5 temp departure)

Most analogue winters averaged normal to slightly below with an average sitting at 26.5 (30 year norm @ 27.9 or -1.4 below). Taking into account the more recent La Nina winters (including Modoki La Ninas), computer guidance and recent trends; I look for a normal to above normal temperature winter. This is both for the winter (Dec-Feb) and cold season (Nov-Mar). 

This projected milder winter average/departure verified well with the average for Southeast Lower Michigan coming in at 27.6. The normal for the area is 25.8; therefore the departure for the winter in Southeast Lower Michigan was +1.8 degrees. Keep in mind the normal range is for a departure -1.0 to +1.0 for our purposes. Expanding to the cold season, November thru March temperatures were also above normal with November averaging just above normal and March well above normal. Therefore; with the exception of only February; the entire cold season period averaged above normal.

Not only did the Winter Outlook temperature departure verify for the winter; so did the temperature and snow trends. 

The Forecast Winter Trend read:

Temperatures and Snowfall:

Most analogue winters averaged normal to slightly below with an average sitting at 26.5 (30 year norm @ 27.9 or -1.4 below). Taking into account the more recent La Nina winters - Modoki La Nina winters- computer guidance and recent trends; I surmise the average of the winter analogues are on the cooler side and therefore; I look for a normal to above normal temperature winter. This is both for the winter (Dec-Feb) and cold season (Nov-Mar). The analogues contained front-end loaded, mid-loaded or back-end loaded winters regarding temperatures (coldest relative to norms) and snowfall (relative to averages). There were twice as many snowier winters (8/4) as there were snowless (see analogues and legends below). Potential for a major snowstorm or two in the snowy La Nina analogues was slightly greater in every month Dec-Mar with a lean toward late season.

In descending order; back-end loaded (roughly late Jan-Mar) winters were favored in regard to colder temperature and/or heavier snowfall.

And one more thing; there are enough well below normal (or "snowless") months that showed up in every set of analogues to be concerned about a bust on the snowfall prediction but I'll hang tough with the normal to above - for the time being anyway.

Both colder temperatures and heavier snows did fall in all areas in February; especially across the Flint area. Detroit more than doubled its normal snow for February with 21.6" this was 11.6" above the norm /10.2'/. Up around Flint; snowfall for February was a whopping 29.7. This was nearly triple the norm of 10.8" /+18.9"/. Saginaw recorded 18.1" of snow for February; which was more than double /+9.5/ their normal amount of 8.6"

In spite of the heavy snows in February; the snow totals for the season just caught up to around normal at both Detroit and Flint (see analogue chart - stats for Winter 2020-21) - which shows just how dry and snowless much of the winter was up until February. Saginaw's seasonal snowfall still came in well below normal with 32.3" or 9.2" below normal. Snowfalls at both Detroit and Flint came close to their analogue means (Detroit - 44.9/48.8" & Flint 48.6/52.4"); whereas Saginaw was well below its snowy mean of 52.0" with just the 32.3". The storm track clipped the Flint and Detroit regions with the best snows of the season.

Analogues & Actual Winter 2020-21 Data


Precipitation and Snow Amount Forecast:

The most surprising trend of the winter was the lack of precipitation and a lesser extent; snowfall leading to below normal precipitation for the winter right into the spring and normal to below normal snowfall. This part of the forecast did not verify.  La Nina winter's are notoriously wet in the Ohio Valley into the Lower Lakes but not this time with much of this area being drier than average.


Reasoning and deductions as to why the La Nina precipitation and in some areas, snowfall didn't verify along with a longer, mild winter

 
Map I & Map III
 
First off; La Nina forecast intensity was not only off; so was the prime area it was to affect in the Pacific. The forecast and thus; the analogues used were for a weak to moderate La Nina. The La Nina generally was weak thru its life. Second and more important; La Nina was forecast to peak in the eastern and central Pacific early-mid winter. Not only did the La Nina weaken, it migrated into the central and western Pacific. This placement further west; at least partly affected our temperatures which remained above normal for two thirds of the winter season. The Pacific jet stream remained strong and shifted further inland and thus; cut off the polar and Arctic jet into the lower 48 (ironically, not unlike an El Nino).  Note the studies on La Nina placement in the Pacific. Note; La Nina mild winters in example #3 with the core of  La Nina over the central-west region of the Pacific. This; in conjunction a NAO which was neutral to positive until February, precipitated our mild winter.

Map II

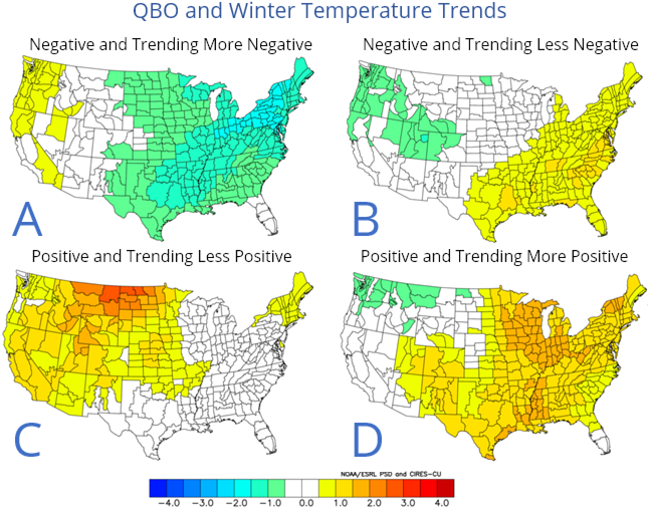
Another sideline but just as important was the lighter westerly QBO never dominated during the winter as expected. In fact at one point; it looked as though the QBO may start shifting to an easterly phase (negative) toward spring. Negative QBO's are notorious for aiding colder and stormier winters in the eastern two-thirds of the country. As of this writing; next winter looks more promising for a easterly QBO

 Map I


Map II


 QBO and WinterTemperatures Trends


Map III


Next up shortly the Summer Outlook

Making weather fun while we all learn,
Bill Deedler - SEMI_Weather Historian


May 5, 2021

Another Lousy May To Start off the Garden Season?

May of 2020 is all too familiar in the minds of gardeners across the Great Lakes and Michigan. The unseasonable cold weather last May that covered the region mid month with freezes and snow is still fresh in many of our minds. To recap; https://www.climatehubs.usda.gov/.../6.2...
 
So what about this May; are daily temperatures expected now to remain cool and average below normal? On average high temperatures in early to mid May in Southeast Michigan generally rise into the mid 60s to around 70; while lows fall into the mid 40s to around 50. Thus far; temperatures have actually averaged above normal for the month but May is only a few days old.
 
Latest weather guidance into at least early next week is not too encouraging for warm weather. Temperatures are expected to average 5 to 10 degrees below normal. And; there is still the risks of scattered frosts or freezes.
 
Latest estimate of temperatures through mid next week /May 12th/ are on the first map; while the reason for the cool weather is on the second map. The reason is in the form of an upper 500 mb cool low that remains trapped over Ontario and the Great Lakes (and routinely being recharged with polar air).
 
This anomaly map /Map 2/ shows the below normal heights/temperatures with the upper low with time. Fortunately; the cold low does migrate to the east-northeast and allows warmer weather to push back into the region toward the end of this period, next week.
 
Another period of cool weather is beginning to show up on extended models later in the month but at this time it remains further north and it's too far out to be reliable, anyway.


Making weather fun while we all learn,
Bill Deedler -SEMI_WeatherHistorian