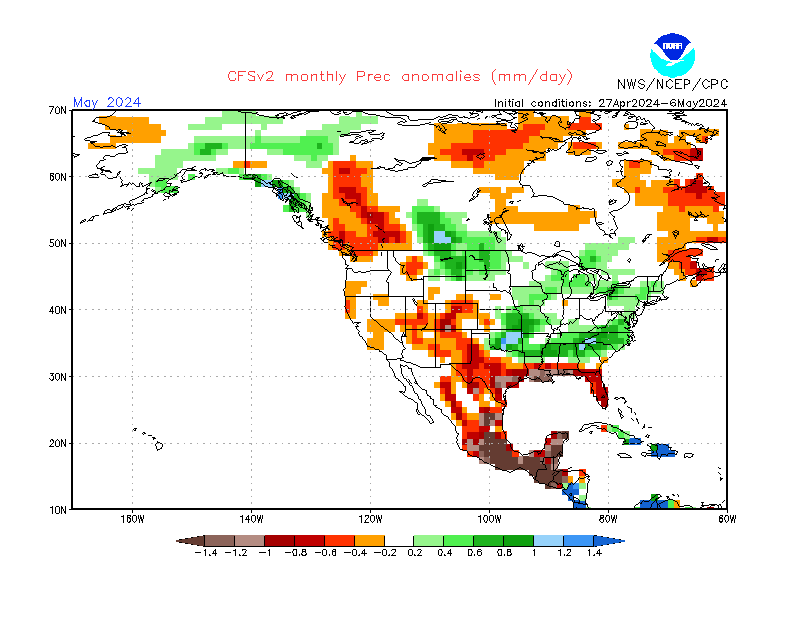
Watching the display of autumn upper winds across North America; many a meteorologist and weather enthusiast will inevitably wonder how the winter patterns will evolve and play out. Even though the pattern has been overwhelmingly warm and wet until recently; when a shift away from the warm pattern was noted late October - a classic time. In La Nina's autumn upper air patterns; it's been my observance a more exaggerated southerly shift in the upper and surface patterns happens mid to late October. As a result; frost and freezes blanket the landscape and many a plant goes into hibernation or dies off.
Occurring later than usual this fall; final frosts and freezes waited until the last week of October into the first week of November - about a week to 10 days behind the average times. This was precipitated by an unseasonably warm and wet autumn (especially October) leading to a very late autumn color change and subsequent, fall of leaves.
OCTOBER AVERAGE TEMPERATURE Location Ave Norm Depart Ranking DETROIT 59.4 53.0 +6.4 6TH WARMEST
FLINT 58.6 50.2 +8.4 2ND WARMEST
SAGINAW 57.7 50.8 +6.9 4TH WARMESTOCTOBER PRECIPITATION TOTAL Location Ave Norm Depart Ranking DETROIT 5.25" 2.53" +2.72" 7TH WETTEST
FLINT 5.45" 2.77" +2.68" 4TH WETTEST
SAGINAW 3.94" 2.91" +1.03" 22ND WETTEST___________________________________________________________________ WINTER - COLD SEASON OUTLOOK 2021-22
Local and Hemispheric Data Suggests
Temperatures:
Overall, temperatures are expected to be colder than the last few winters but with averages still around normal to slightly below /+1.0F to -1.5F/. Indications are of an early winter by upper air patterns and analogues relating a colder than average beginning of the cold season (Nov - Mar) which would be mid November into early December, anyway). Particular trends are discussed in the Analogue Section.
As the storm track shifts around this winter, look for temperatures to be quite variable. Rather strong storm tracks will ride on an oscillating southwest to northwest jet stream from the Arctic, northern Pacific and Sub-tropical (see storm tracks) . Once again, how much effect the various air masses have on Southeast Lower Michigan will be guided by La Nina in conjunction with the North Atlantic/Arctic Oscillation /NAO, AO/ (Arctic and Polar jets), the PDO (Pacific jets) and QBO discussed below. These will play a large part on temperature patterns across the Great Lakes. This pattern seen is very true to our typical second consecutive La Nina winters especially when occurring in conjunction with the aforementioned hemispheric players - and I see no reason to deviate from it.
Precipitation:
Precipitation is expected to average above normal which is typical in La Nina's winters, especially the second consecutive winter. Many indicators show above normal precipitation; models, analogues and typical La Nina patterns and storm tracks. Many of the analogues were wetter than normal, a few significantly.
Snowfall:
Normal to Above. A two-tier outlook seems suitable with the expected storm tracks and mixed precipitation included. One of the tracks is expected to be right over/around Southeast Lower Michigan. This would bring the expected precipitation in various forms. Snowfalls ranged around normal to above any dampening would be attributed to mixed precipitation events.
Note categories of snowfall:
Below normal snowfall; more than /-5.0"/ below the winter average snowfall
Normal snowfall; +/- 5.0" of the winter average snowfall and Above normal snowfall; better than /+5.0"/ of snow above the average. Actual analogue data and norms are listed on the Analogue Table below.
Hemispheric Discussion
In case you haven't surmised by now; the upcoming winter is expected to be, like last winter, a La Nina winter. In addition; this winter's La Nina is likely to be generally similar in strength to last year's; albeit possibly a bit stronger and may reach borderline moderate at -1.5 departure. I also look for this winter's La Nina to have more of an influence on our weather than last winter's; mainly due to the atmosphere's stronger resultant La Nina pattern reaction (not dominant last winter) along with the cool (negative) Pacific Decadal Oscillation and an easterly QBO in place.
ENSO REGIONS

Current ENSO SST anomalies as of early November


Last La Nina was in 2017-18 and previous La Ninas and El Ninos are noted below back to 1950-51.
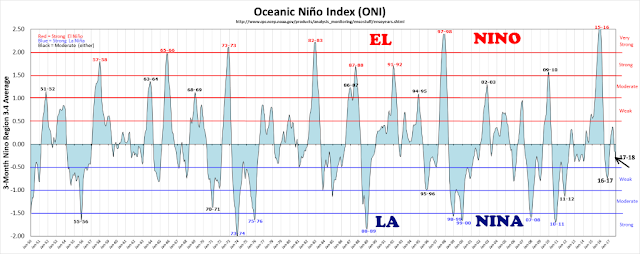
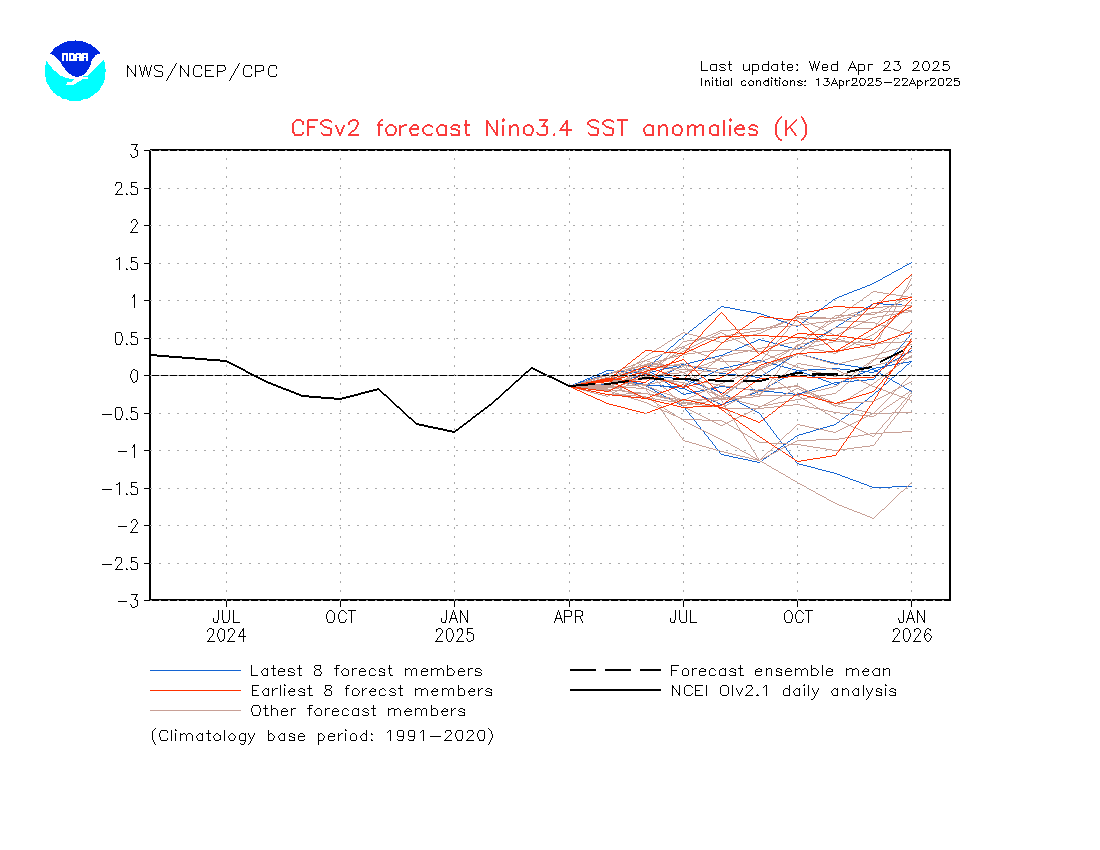
Below are projected various model ENSO patterns into the Summer of 2022. Mean La Nina SST anomalies fall to near -1.0C this winter. All models warm the SST's to at least Neutral ENSO by next summer.

North Atlantic/Arctic Oscillation - NAO/AO
Most winters; the phase of the NAO/AO is one of the most important ingredients to the type of winter to be-had over the central and eastern part of the country; and even parts of the mountainous areas of the west at times. This is one of the most elusive oscillations to predict for more than a week or two out. When the NAO/AO is in a negative phase, generally colder Polar and Arctic air is allowed to dive south over North America. And when in a positive phase, the Polar or Arctic retreats northward and moderating Pacific westerly winds lock-in and prevail. Below are the NAO index and phases into 1860 and I also use the Southern Oscillation Index /SOI/ to determine analogues pre-1950.

The Arctic Oscillation is tracked by observing 1000-millibar geopotential height anomalies over the far upper latitudes of the Northern Hemisphere, above 20 degrees North to be specific. The AO has two phases: a positive phase, and a negative phase. When the AO is said to be positive (+AO), geopotential height anomalies over the upper latitudes are lower than normal. This means the tropospheric polar vortex is stronger than normal, and this stronger vortex “locks up” the colder air at the upper latitudes, keeping it from flowing south. As a result, a positive AO is associated with above-normal temperatures in the United States. When the AO is said to be negative (-AO), geopotential height anomalies over the upper latitudes are higher than normal. This means the tropospheric polar vortex is weaker, and enables colder air masses to flow down to lower latitudes. As a result, a negative AO is commonly associated with below-normal temperatures in the United States.


One of the newer studies uses October snow-cover over Siberia/Eurasia compared to average to aid in projecting out the main phase and likely corresponding temperature pattern for the winter. In my analogues; I've included this past October's coverage (and looking at the rate of coverage) that has been researched since 1965. In the analogues; you will notice B/A/S for Below, Above and Same under SIB snow column. Simply put; this reflects this October's snow cover compared to the previous analogue La Ninas not average snow cover. As an example; October 2017 had one of the snowiest coverages by the end of October relative to any year since 1998 with only a few non-analogue years that equaled it. Therefore, October 2017 had more snow cover than this October of 2021. And, snow cover was below /B/ that of 2017. This year's study suggests more snow cover than on average and thus; a -NAO/-AO likely to prevail this winter and thus; colder temperatures (see discussions and map below).
Impacts /Dr. Judah Cohen/ Winter 2021-22
"I have been promising a preliminary winter forecast for surface temperature anomalies for the Northern Hemisphere and today I deliver. The forecast was generated the last week of October using my estimate of October Eurasian snow cover extent (SCE), the dominant sea level pressure anomaly across Northern Eurasia for October, the September Arctic sea ice extent anomaly and the predicted winter (December-February) Niño 3.4 index (a common indicator for El Niño/Southern Oscillation (ENSO)). Also I included in this winter’s forecast my own very rough estimate for the winter Pacific Decadal Oscillation (PDO) index. Typically, I don’t include the PDO index in my winter forecasts, but the strong negative PDO pattern has emerged, and it could very well be a factor. in Figure i, I present a preliminary AER winter forecast that was shared with clients at the end of October. I will share an update to the winter forecast on the blog at the end of the month. Please keep in mind since the forecast was generated the observed values for October SCE and SLP are now known and will be used in updated forecasts. Also, I used as my climatology the values from 1991-2020".


Pacific Decadal Oscillation /PDO/ and associated subset EPO
The previous warm phase Pacific Decadal Oscillation recently switched to a cool phase this year from 2020. A cool phase of the PDO is represented on the right of the following example and compare it to the current state.
Warm Phase of the PDO Cool Phase of the PDO

"When SSTs are anomalously cool in the interior North Pacific and warm along the Pacific Coast, and when sea level pressures are below average over the North Pacific, the PDO has a positive value. When the climate anomaly patterns are reversed, with warm SST anomalies in the interior and cool SST anomalies along the North American coast, or above average sea level pressures over the North Pacific, the PDO has a negative value" (Courtesy of Mantua, 1999).
"The Pacific Decadal Oscillation (PDO) is a pattern of Pacific climate variability similar to ENSO in character, but which varies over a much longer time scale. The PDO can remain in the same phase for up to 20 to 30 years, while ENSO cycles typically only last 6 to 18 months. The PDO, like ENSO, consists of a warm and cool phase which alters upper level atmospheric winds. Shifts in the PDO phase can have significant implications for global climate, affecting Pacific and Atlantic hurricane activity, droughts and flooding around the Pacific basin, the productivity of marine ecosystems, and global land temperature patterns. Experts also believe the PDO can intensify or diminish the impacts of ENSO according to its phase. If both ENSO and the PDO are in the same phase (as in this Winter of 2021-22), it is believed that El Niño/La Nina impacts may be magnified. Conversely, if ENSO and the PDO are out of phase, it has been proposed that they may offset one another, preventing "true" ENSO impacts from occurring".
http://www.john-daly.com/theodor/pdotrend.htm
Last Winter of 2020-21, the ENSO (La Nina) and PDO (warm phase) were out of phase and the winter was indeed notably warmer than what is generally seen in a La Nina winter. This was mentioned in last Winter's Outlook and one of the reasons noted that may interfere with the normal LA Nina winter jet and temperature pattern.
The evolving cold phase of the PDO (see below and above cold phase) and weak La Nina are displayed well in this recent Global SST scan on November 13th, 2021.

The evolving cold phase of the PDO (see below and above cold phase) and weak La Nina are displayed well in this recent Global SST scan on November 13th, 2021.

SOLAR CYCLE /SC/
Solar cycle actual effects on short term weather and longer term climate variability remain a controversial subject. I've read several articles which support or are against their shorter term winter relevancy. Some theorize that both natural solar cycles and man's influence affect our climate. I am in favor of the solar cycle being somewhat relevant and sometimes giving the present winter cycle a "little kick" in regard to hemispheric wind flow patterns and resulting temperatures. Numerous recent studies for example, do in fact make the connection to our climate and solar activity including wintertime effects. One of the studies stated the following:
Sirocko et al. (2012) recently reached the same con-

Solar Cycle 24 & 25 

The forecast comes from the Solar Cycle Prediction Panel representing NOAA, NASA and the International Space Environmental Services (ISES). This amounts to the ‘official’ forecast for the solar cycle. The Prediction Panel forecasts the sunspot number expected for solar maximum and has predicted Cycle 25 to reach a maximum of 115 occurring in July, 2025. The error bars on this prediction mean the panel expects the cycle maximum could be between 105-125 with the peak occurring between November 2024 and March 2026.
THE QBO INFLUENCE
The QBO, or Quasi-Biennial Oscillation, is an oscillation in the wind direction in the stratosphere within about 15 degrees of the equator. Over a roughly two-year period, winds tend to oscillate between westward and eastward, with the switch between west and east winds starting high in the stratosphere and then shifting lower in altitude with time. The QBO is the result of waves propagating vertically in the atmosphere that then interact with the mean flow to slowly change wind speeds and direction. These changes influence the overall global circulation patterns, which in turn influence winter weather patterns across North America.
Downward motion of the easterlies is usually more irregular than that of the westerlies. The amplitude of the easterly phase is about twice as strong as that of the westerly phase. At the top of the vertical QBO domain, easterlies dominate, while at the bottom, westerlies are more likely to be found. At the 30mb level, with regards to monthly mean zonal winds, the strongest recorded easterly was 29.55 m/s in November 2005, while the strongest recorded westerly was only 15.62 m/s in June 1995.
Effects of the QBO include mixing of stratospheric ozone by the secondary circulation caused by the QBO, modification of monsoon precipitation, and an influence on stratospheric circulation in northern hemisphere winter (mediated partly by a change in the frequency of sudden stratospheric warmings). Eastward phases of the QBO often coincide with more sudden stratospheric warmings, a weaker Atlantic jet stream and cold winters in Northern Europe and eastern USA whereas westward phases of the QBO often coincide with mild winters in eastern USA and a strong Atlantic jet stream with mild, wet stormy winters in northern Europe. In addition, the QBO has been shown to affect hurricane frequency during hurricane seasons in the Atlantic and research has also been conducted investigating a possible relationship between ENSO (El Nino Southern Oscillation) and the QBO.
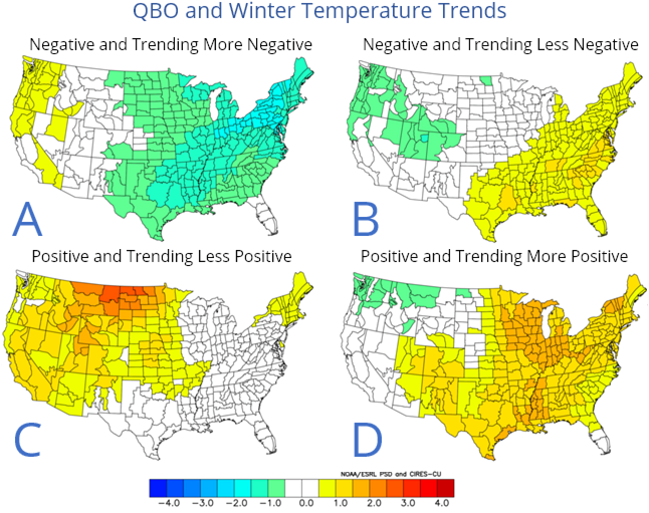
The following Map - 1 shows winters with weak La Nina (as in this upcoming winter) along with negative QBO values from November into March during the cold season (as expected this cold season). The Maps below Map - 1 (Maps - 2) show average winter temperatures with an easterly QBO and westerly QBO. We are presently in an easterly, negative QBO and trending more negative.
Map - 1

Maps - 2
500 MB HEIGHTS/JETS FROM COLD SEASON 2021-22 ANALOGUES

ANALOGUE STORM TRACKS

WINTER 2021-22 ANALOGUES - SOUTHEAST LOWER MICHIGAN

Click on chart to enlarge
Some additional category explanations in the analogue chart from left to right:
AO/SC
AO - The predominant phase of the Arctic Oscillation during that winter. AO- (negative), AOn
(neutral) or AO+ (positive).
SC - position of the solar cycle during that winter. Breaking it down (see solar cycle chart):
SC-- (opposite high cycle compared to the present, least similar) SC+/- (sunspots
waning but not near minimum or 2017 low level. Finally, S++ where solar sunspot cycle is
at or very close to the low cycle of 2017 and/or is at the same decline with 2017...the
best comparison and likeness.
QBO - W=West wind prevailed that winter or E=East wind prevailed. Trends: -/- (weak and
weakening trend), -/+ (weak but strengthening), no sign (steady trend, no change) +
moderate and strengthening +/- strong but weakening. Note that the trend now in the fall
of 2017 is E/+, a moderate east wind and still strengthening. This fits with all the winter's
that contained a easterly QBO. 1950-51 (weak easterly and weakening further), 1984-85 & 1996-97 (strong easterly but weakening), 2000-01 (moderate easterly and steady) then 2011-12 (weak easterly but increasing) and finally, 2017-18 (moderate easterly).
Winter 2021-22 and Cold Season


ANALOGUE TEMPS/SNOW
Analogue temperatures still have the biased of
slightly below normal temperatures with some impressive cold monthly
readings. However; at the same time they are balanced to a large extent with a
significant number of warmer months throughout the second La Nina sample. The
strongest trend in the lot is the normal or average temperature winters. This
will become more evident as to how and why when looking at the whole pattern
coming together with the key players, mentioned at opening. I expect a quite a
roller-coaster of air masses and temperatures with final tally of normal - to slightly below.
Snowfall is a crap-shoot like always relating to where storm tracks sets up and
how much moisture occurs with the cold air masses. All we can do is look at
recent Autumn patterns, La Nina, NAO, PDO and QBO. All suggest normal to above
snowfall. Snowiest regions initially lean to the center and northern half of
Southeast Michigan - basically I-696/Walter Reuther northward into the Saginaw
Valley and Thumb Region. One caveat however; has been the far northern regions
have been drier than the mid and southern areas this year. We'll see how it
plays out. Snowiest timing? Also scattered throughout the season but with a
edge to early-mid winter. Early analogue(s) that bear watching 1984-85.
Nov - Dec period shows a fairly strong biased toward periods of below normal temperatures by way of some aggressive early season cold snaps. This was offset by late autumn/early winter moderating periods between as the Pacific jet/ridging moves inland between "blows" of cold. Overall, nearly all (but two) Novembers averaged below normal with a significant number of Decembers also below - some impressively! What's really interesting is that a fair number of Decembers were more than a degree above normal, also. Feast or Famine. Six below to four above with one normal at Detroit. This even occurred intra-month and many times it does with cold first half/mild second or visa-versa.
Jan - Shows almost the identical pattern as Decembers with 5 colder and 4 warmer and two normal - very erratic but again with a slight cold biased. Still; looks like a bet for a "January Thaw" which does happen most winters. A snowy month?
Feb - Variety is again the name of the game but with a lean to more normal or moderate temperatures. If however, the winter begins cold in November-December, February's temperature pattern may also be colder than average.
Mar-Apr Let's hope for an early spring for a change. We'll deal with that later.
US CFV2 MODEL AND EUROPEAN SEASON MODELS
USA
CFSV2 - SST

700 MB WINDS/ANOMALIES

CFSV2 -TEMPS_DEC - FEB

CFSV2 -TEMPS_FEB - APR

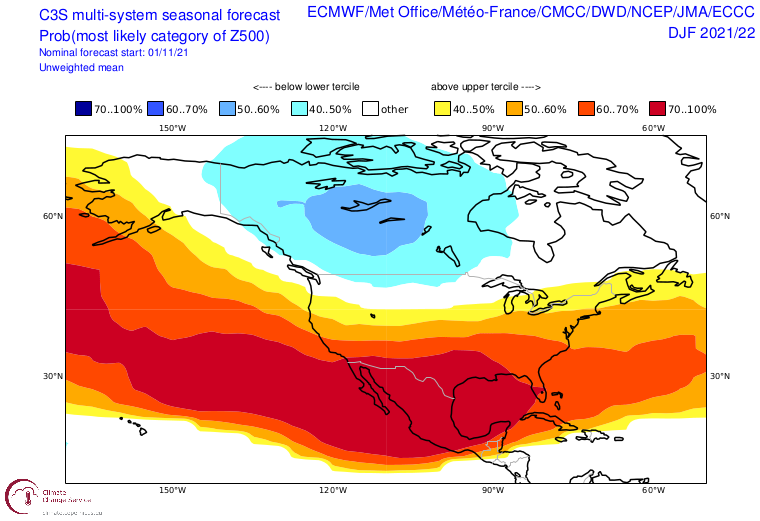
EURO MODELS /A BLEND/ 500 MB/TEMPS/PCPN


Look for more write-ups through the winter involving notable weather events, major storms and comparing the Winter Outlook trends and actual weather trends!
Making weather fun while we all learn,Bill Deedler - SEMI_WeatherHistorian