As the global pattern evolved into a La Nina by mid fall; autumn's weather across Southeast Lower Michigan was fairly nice but a bit cooler than average early to mid season but was interrupted by a very notable spell of warm Indian Summer weather the first half of November (more below). The fall season was also wetter than average into early November with much of the surplus coming in September.
As stated; one of the most notable autumn weather events was the well above normal temperatures in November that contrasted greatly to the cold and snowstorm during the first half of November 2019! One check of Detroit's LCD of November of 2020 to the November of 2019 LCD shows in detail, the astonishing contrast.
Indian Summer weather with a few highs flirting with the upper range of record high temperatures isn't all that unusual around Southeast Lower Michigan, especially during La Nina falls. This autumn's stretch of Indian Summer weather not only flirted with record warmth but created several record high days of its own with three record highs at Detroit and four record highs at both Flint and Saginaw from the 8-11th! The record warmth wasn't confined just to Southeast Lower Michigan but to all of Michigan


Glancing back at the first half of the last two Novembers at Detroit; makes some interesting contrasts - and what a difference a year makes!
PRELIMINARY LOCAL CLIMATOLOGICAL DATA (WS FORM: F-6)
STATION: DETROIT MI
MONTH: NOVEMBER
YEAR: 2019
LATITUDE: 42 13 N
LONGITUDE: 83 20 W
TEMPERATURE IN F: :PCPN: SNOW: WIND :SUNSHINE: SKY :PK WND
================================================================================
1 2 3 4 5 6A 6B 7 8 9 10 11 12 13 14 15 16 17 18
12Z AVG MX 2MIN
DY MAX MIN AVG DEP HDD CDD WTR SNW DPTH SPD SPD DIR MIN PSBL S-S WX SPD DR
================================================================================
1 42 35 39 -8 26 0 T T 0 12.8 26 280 M M 9 8 35 280
2 48 37 43 -4 22 0 0.03 T 0 11.3 30 270 M M 9 5 39 260
3 47 33 40 -6 25 0 T T 0 9.6 16 240 M M 9 21 250
4 54 42 48 2 17 0 0.02 0.0 0 13.0 25 220 M M 10 31 250
5 48 31 40 -6 25 0 0.00 0.0 0 10.4 22 250 M M 7 30 250
6 43 27 35 -10 30 0 T T 0 5.7 14 310 M M 8 18 17 310
7 38 25 32 -13 33 0 0.03 0.2 T 11.5 18 310 M M 8 1 25 340
8 39 22 31 -14 34 0 0.00 0.0 0 7.7 15 340 M M 4 21 290
9 41 27 34 -10 31 0 0.00 0.0 0 11.0 21 210 M M 9 27 210
10 47 34 41 -3 24 0 0.03 T 0 7.9 16 10 M M 10 18 20 10
11 34 23 29 -15 36 0 0.81 8.5 1 11.0 18 330 M M 10 128 24 330
12 25 13 19 -24 46 0 0.05 0.7 9 10.7 20 310 M M 6 18 27 300
13 25 7 16 -27 49 0 0.00 0.0 7 8.4 17 190 M M 8 18 23 180
14 33 24 29 -13 36 0 T 0.1 6 10.3 20 250 M M 10 18 26 250
15 36 26 31 -11 34 0 0.00 0.0 5 8.6 18 250 M M 8 18 24 260
16 34 22 28 -14 37 0 0.00 0.0 3 8.4 14 60 M M 7 19 40
__________________________________________________________________________________-11.0
STATION: DETROIT MIMONTH: NOVEMBER
YEAR: 2020 LATITUDE: 42 13 N LONGITUDE: 83 20 W TEMPERATURE IN F: :PCPN: SNOW: WIND :SUNSHINE: SKY :PK WND================================================================================1 2 3 4 5 6A 6B 7 8 9 10 11 12 13 14 15 16 17 18 12Z AVG MX 2MINDY MAX MIN AVG DEP HDD CDD WTR SNW DPTH SPD SPD DIR MIN PSBL S-S WX SPD DR================================================================================ 1 50 33 42 -5 23 0 0.04 T 0 20.3 32 280 M M 7 18 45 280 2 48 28 38 -9 27 0 0.00 0.0 0 15.9 26 240 M M 7 35 310 3 59 33 46 0 19 0 0.00 0.0 0 9.2 16 220 M M 2 21 270 4 72 42 57 11 8 0 0.00 0.0 0 12.1 23 210 M M 1 30 200 5 66 52 59 13 6 0 0.00 0.0 0 12.3 18 220 M M 7 23 220 6 71 46 59 14 6 0 0.00 0.0 0 9.3 18 230 M M 4 8 22 230 7 71 46 59 14 6 0 0.00 0.0 0 7.1 20 210 M M 4 18 24 240 8 73 43 58 13 7 0 0.00 0.0 0 2.6 10 140 M M 1 18 14 170 9 77 47 62 18 3 0 0.00 0.0 0 5.1 14 200 M M 4 18 20 18010 77 57 67 23 0 2 0.21 0.0 0 12.7 29 220 M M 7 1 36 19011 65 35 50 6 15 0 0.03 0.0 0 11.7 24 230 M M 5 1 31 24012 50 30 40 -3 25 0 0.00 0.0 0 1.9 9 180 M M 2 18 12 12013 48 31 40 -3 25 0 T 0.0 0 8.5 22 270 M M 9 18 29 29014 47 25 36 -6 29 0 0.08 0.0 0 6.9 17 170 M M 5 18 26 16015 54 39 47 5 18 0 0.75 T 0 22.3 45 240 M M 10 138 61 23016 46 37 42 0 23 0 T T 0 14.5 26 270 M M 8 8 36 270
________________________________________________________________________________
+5.5
The most impressive departures and in spite of several record highs this November; would certainly have to go to the cold in the first half of November of 2019. It was twice as cold /-11.0/ as this November was warm /+5.5/ relative to normal. Therefore; the first half of last November averaged 16.5 degrees colder than this November! Add to that; the record snowstorm on the 11-12th with 9.2" and a couple of record lows for good measure (November 12th- 13 & 13th- 7) at Detroit and you've got quite a contrast! Check out here the coldest November on record /1880/ with a severe cold wave for November.
=================================================================================
Winter Outlook for the Winter of 2020-21
Local Analogue Research, Hemispheric Data and Computer Modeling suggests:
Temperatures - Normal to Above (or -1.0 to +2.5 temp departure)
Most analogue winters averaged normal to slightly below with an average sitting at 26.5 (30 year norm @ 27.9 or -1.4 below). Taking into account the more recent La Nina winters (including Modoki La Ninas), computer guidance and recent trends; I look for a normal to above normal temperature winter. This is both for the winter (Dec-Feb) and cold season (Nov-Mar).
Since my October update on La Nina; latest computer guidance and the patterns of the more recent La Nina analogues present an argument for an overall milder winter but with aggressive cold snaps. In fact; past data in the analogues also argue for a sharply colder than average month (or period) into early spring see analogue section (or intra-month example; mid Jan to mid Feb, depending on timing). With the variability in these type of La Nina's; leaves me with a two-tier temperature forecast - normal to above.
Precipitation - Above
Analogue guidance and computer model guidance from numerous sources overwhelmingly call for a wetter than normal winter.
The majority of winters were active as there were three main storm tracks affecting the region.
Snowfall prognostication this season is more problematic than precipitation as a whole since storm tracks affecting the region will be north, over Southeast Lower Michigan and south over the Ohio Valley. This leads to snow, rain, rain to snow, snow to rain depending on the system. The unusually strong mid Pacific jet (for a La Nina) will lead systems to bring in milder Pacific/Gulf of Mexico air and thus; mixed precipitation should be a frequent visitor.
In addition; there is some conflicting data for this winter's La Nina. A winter that on first indication, should have been a more straight forward, moderate to strong La Nina. This year's unfolding La Nina and its hemispheric affects may not turn out a typical La Nina (see below).
Hemispheric Discussion - ENSO
Recent cooling of water temperatures across the central Pacific have led a rapidly developing La Nina that already is in moderate territory (SST anomaly between -1.0 and -1.4 degrees C). Latest temperature anomalies across the 3.4 ENSO have dropped to between -1.5 to -1.7 now and thus, just dipping into the strong category. It is my thinking that the La Nina has attained its general strength for this cycle, therefore the moderate or strong past La Nina's represent analogues best - with a couple of weaker ones.
Past ENSO La Ninas /blue/ and El Ninos /red/ thru 2006

Recent ENSO 2000-2018

A caveat now making an appearance is the coldest water departures have drifted to the center of the La Nina (see image below) and thus a La Nina "Modoki" could be in our meteorological midst.


Recent 5KM surface water temps show the colder waters of the La Nina have migrated out into the mid Pacific while the waters over the eastern Pacific, have moderated and warmed a bit (Fig's 1 & 2, click images).
Fig 1

Fig 2

I first introduced this (Modoki) ENSO phenomena back in the El Nino of 2018-19 and it's possible influnce on our winter. That winter was an "on and off" El Nino influenced winter as far as temperature and snowy/snowless winter pattern during the season and location. Detroit and areas south received much below normal snow but a heavy snow area occurred around the Flint region and areas north into the Saginaw Valley. Those locations received above to well above normal snow. The overall weather pattern across the country was more a-typical for a normal La Nina winter.
A La Nina Modoki (Fig 1) disrupts the typical La Nina atmospheric pattern as the waters remain colder over the center of the Pacific while moderating and warming over the eastern Pacific near South America (Fig 2). The result is a more complicated pattern across the States with the Pacific Coast receiving more moisture and rain than is normally seen in a La Nina (especially the northern half). In addition; troughing occurs more over the west and center part of the country leading to a stormy and colder pattern in the north; while the eastern half of the country oscillates more between cold and mild - snow and rain.

Figure 1 shows key differences in sea surface temperature distributions and atmospheric circulations; (a) A conventional La Niña and (b) A La Niña Modoki. The single-cell broad scale Walker circulation splits into two cells during a Modoki event.
Since the late 1970s, conventional ENSO La Niña and El Niño events have become less frequent, while a second “flavor” of ENSO – Modoki – from the Japanese language meaning ‘similar but different’ – has become slightly more prevalent. Both El Niño and La Niña Modoki events can occur independently at times when tropical ocean indices may not achieve thresholds in a classic El Niño or La Niña event.
Japanese research scientists later uncovered the Modoki phenomenon in 2007. Both El Niño and La Niña Modoki events can significantly influence the temperature and precipitation over many parts of the globe. For example, the West Coast of the United States is wet during El Niño but dry during El Niño Modoki.
Types of La Ninas related to placement of colder, below normal waters
Thus far the projection for the La Nina is for the coldest departures to be located in the center to east Pacific, closer to the seasonal to the mild winters

Latest computer projection consensus has La Nina peaking but still with varying intensities. Our CFSv2 model had continued to strengthen it further down into the stronger category, averaging around -2.0C (black dashed line, second chart) but now has been corrected recently further up to -1.5 to -1.7 (third chart) and current intensity. At one point the model had the La Nina peaking around -2.5C, which would have been a record La Nina, I believe.
Model Consensus

CFSv2 Model Projections


Running 3-Month Mean ONI values for past ENSOs

North Atlantic Oscillation/Arctic Oscillation - NAO/AO
As usual; this should be one of the most important meteorological influences for this winter In the last few years, it's had an on and off again effect on our weather, working with Stratospheric warming and the EPO (more later). Refreshing our memory on this little number shows why the major influence with our weather.
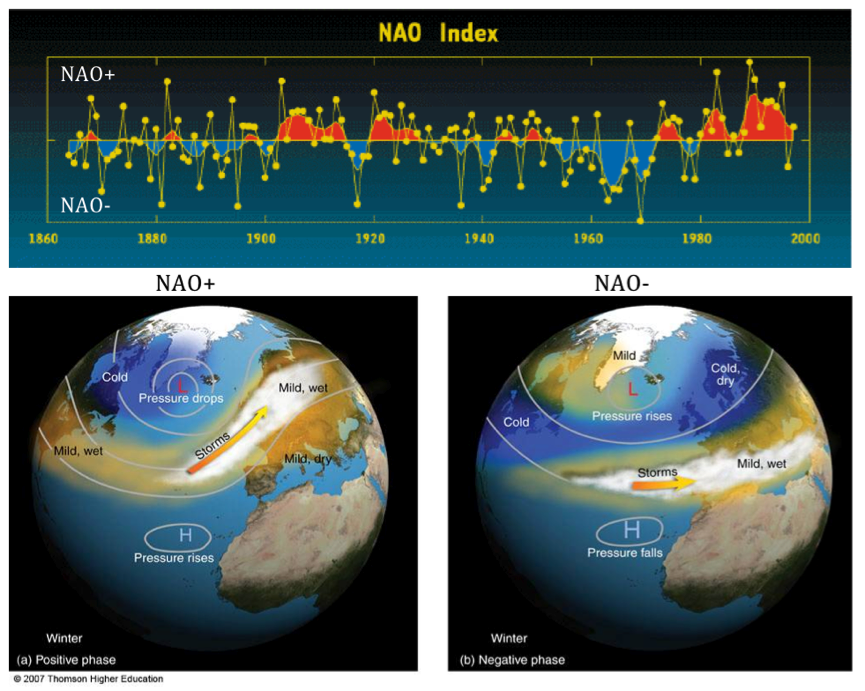
Generally when the NAO/AO index is in the positive phase; more
zonal winds dominate as the polar vortex lifts up toward or over it's
home, the North Pole region. However; when in a negative phase; the cold
vortex or wind flow is more meridional
and thus; cold Polar or Arctic air is readily pushed south from the
Pole; down into the eastern half of the U.S. (among other Northern
Hemisphere areas). Many times ridges of higher pressure develops in
conjunction on the North American west coast and/or into Greenland.

Most
winters; the phase of the NAO/AO is one of the most important ingredients to
the type of winter to be had over the central and eastern part of the country.
However, this is also one of the most elusive oscillations to predict
for more than a week or two. Last winter the NAO was dominated by a positive phase and that in conjunction with the weak El Nino resulted in a mild winter (Dec-Feb)
Seasonal NAO
| Recent winter/cold season NAO index values | |||
|---|---|---|---|
| Year | DJF | DJFM | ONDJFM |
| 2009-2010 | -3.34 | -2.71 | -1.78 |
| 2010-2011 | -1.06 | -0.84 | -1.52 |
| 2011-2012 | +2.18 | +2.08 | +1.73 |
| 2012-2013 | +0.47 | -0.58 | -1.11 |
| 2013-2014 | +2.19 | +2.05 | +1.31 |
| 2014-2015 | +2.06 | +2.04 | +1.05 |
| 2015-2016 | +2.33 | +1.83 | +1.62 |
| 2016-2017 | +1.22 | +1.17 | +0.27 |
| 2017-2018 | +0.91 | +0.40 | +0.34 |
| 2018-2019 | +1.16 | +1.47 | +0.57 |
| 2019-2020 | +2.85 | +2.23 | +0.99 |
Latest NAO projections shows the positive phase during November (yellow highlighted) to fall into neutral and negative with time, thus predicting colder weather within the time-period. Be advised; this is updated daily and doesn't always remain consistent.

Pacific Decadal Oscillation /PDO/ and associated subset EPO
Warm Phase of the PDO Cool Phase of the PDO

Latest SST's (below) seemed to have evolved into a cool phase recently. Note the above or well above normal
SST's west of Alaska and south over the mid Pacific. Relatively cooler anomalies have formed further east right along the West Coast.
The warmer SST's further off the West Coast south of Alaska;
generally encourages high pressure ridging which may help at times, deliver
Polar and Arctic air from the northern Canadian regions into the Lakes. This
was especially true during the hard, snowy winter of 2013-14 even when the NAO was
not always negative.
Recent Global SST

Eastern Pacific Oscillation
A negative Eastern Pacific Oscillation /-EPO/ is displayed below along with its cold affects it can have downwind on North America. The Winter of 2013-14 was
one cold, bitter winter along with exceptionally heavy amounts of snow
across Southeast Lower Michigan. The brutal cold delivered to the region
on many occasions was either the cause or was aided by a strong -EPO
helping to build a strong high pressure ridge on the West Coast which in
turn; slammed our region with a deep low pressure trough filled with
cross polar air from Siberia and North Pole.

Likewise; a positive Eastern Pacific Oscillation /+EPO/ pattern is displayed below along with its mild affects it can have downwind on North America.

A three-way indices pattern /NAO, AO and EPO/ evolving together can have interesting weather for the eastern half of the country as seen below in the autumn of 2019.

Pacific/North American /PNA/ Pattern
-PNA


Solar Cycle Relevance
Note the analogues years that are below 100 (1-8) on the solar threshold and particularly the ones below 50 which are near/or at the bottom of the cycles (2-8). Interesting we have so many La Nina analogues (2-8) near the bottom of the solar cycles. Out of the 13 analogues, a little over half /7/ are at the bottom. The second chart shows we are in the beginning phase of the 25th cycle.


Siberia/Eurasia /North America Snow Cover
The snow-cover over Siberia has actually been less than average until recently (second-third week of Nov?) and now one of the higher of recent years. While across North America; snow-cover extent had been the largest in recent years from mid October to early November with a drop-off recently.
From recent Dr Jonah Cohen blog:
Northern Hemisphere Snow Cover
Snow cover advanced rapidly over the past week across Eurasia and is
currently near decadal highs. Snow cover advance will likely continue to
increase especially across East Asia and possibly into Europe the next
two weeks. Above normal snow cover extent in October, favors a strengthened Siberian high, cold temperatures across northern Eurasia
and a weakened polar vortex/negative AO this upcoming winter followed by
cold temperatures across the continents of the NH.
North American snow cover has stalled and is now near decadal means. The early advance of snow cover across Canada this fall, has likely contributed to an early start of cold temperatures across the Central and Eastern US.

WINTER 2020-21 ANALOGUES

Some additional analogue conclusions and category explanations in the analogue chart
AO/SC
AO - The predominant phase of the Arctic Oscillation during that winter. AO- (negative), AOn (neutral) or AO+ (positive).
SC - position of the solar cycle during that winter. Breaking it down (see solar cycle chart):
SC-- (opposite high cycle compared to the present, least similar) SC+/- (sunspots
waning but not near minimum or 2019 low level. Finally, S++ where solar sunspot cycle is at or very close to the low cycle of 2019-20 and/or is at the same positioning 2019-20...the best comparison and likeness. There are several this time at 8, one of the highest likes - meaning the sunspot phase of the sun is very close to 7 other analogues out of the 13.
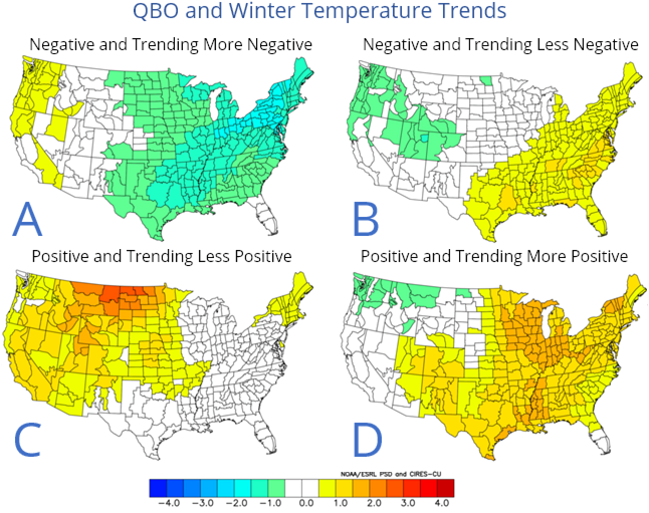
QBO - W=West wind prevailed that winter or E=East wind prevailed. Trends: -/- (weak and weakening trend), -/+ (weak but strengthening), s (steady trend, no change) +
moderate and strengthening +/- strong but weakening. Note that the trend now in the fall of 2020 is W-, a light west wind and steady or slowly increasing /W/. This fits with all the analogue winter's that contained a light westerly to possibly moderate westerly QBO.
Sib snow - Siberian snow cover in October and rate of change. Only one previous analogue winter had below compared to this past October's/early November since the data only goes back to the late 1990s. Notations are this fall compared to analogue fall: WA=Way above, A= above, B=below, % = equal to.
Letter n /next to the analogue winter years at Detroit/ - A warm November preceded these winters in all of Southeast Lower Michigan - like this present November 2020.
Warmer than normal Novembers preceded several of my later Novembers in my analogues. Five analogues in the last six contained warmer than average Novembers. The best was November of 1975 which may turn out to be the closest to this November's average at 46 (and early indications not a bad analogue either). My set of analogues included mainly moderate to strong La Ninas with some weak in the 13 count this go around. The 1949-51 strong La Nina was not included due to it beginning during the winter of the 49-50 and ending during the early winter of 1950-51. Several are Modoki La Nina's with just as many "classic" La Nina's to give a good representation to both including various intensities but as stated, a decided preference to moderate to strong -as this year's.
A short detour on Detroit's warming if you can stand it:
One of the first things noticed is many of the earlier La Nina winters being a bit colder than the later La Ninas (since the 1980s). Ironically; the last four winters averaged 27.7 degrees; whereas all /13/ the winters averaged 26.5 or -1.2 lower. Therefore; the earlier winters before the 1980s have to be colder on average than 26.5 for all winters since the later four winters warmed the average up some. Sure enough; the first nine winters averaged 26.0 degrees. I only use the winter's since the 1980s for warmer because that is also when the heat island migrated out and around Metro Airport. Ironically (and what this paragraph is leading to) is that part of the 1.7 degree difference in the later four winters reflects the Detroit heat island rise in temperature at Detroit Metro; part is also due to the climate change warming and most likely, those winters were a bit warmer because of the heat island and climate warming. The 100 year average winter temperature is about 26.7 degrees. Now the latest 30 year average from 1980 - 2010 is 27.9 or about 1.2 degrees warmer than the 100 year. In a year or two, we'll have the 1990-2020; 30 year average - and one guess which way that will trend). Working at Detroit Metro Airport better than half my career and all of my career in Southeast Michigan, I can assuredly say that Detroit's average temperature since the 1980s has been strongly influenced by meso-heat island due to expanding population and infrastructure in Southeast Lower Michigan and the airport itself.
Back to the Winter Outlook:
Temperatures and Snowfall:
Most analogue winters averaged normal to slightly below with an average sitting at 26.5 (30 year norm @ 27.9 or -1.4 below). Taking into account the more recent La Nina winters - Modoki La Nina winters- computer guidance and recent trends; I surmise the average of the winter analogues are on the cooler side and therefore; I look for a normal to above normal temperature winter. This is both for the winter (Dec-Feb) and cold season (Nov-Mar). The analogues contained front-end loaded, mid-loaded or back-end loaded winters regarding temperatures (coldest relative to norms) and snowfall (relative to averages). There were twice as many snowier winters (8/4) as there were snowless (see analogues and legends below). Potential for a major snowstorm or two in the snowy La Nina analogues was slightly greater in every month Dec-Mar with a lean toward late season.
In descending order; back-end loaded (roughly late Jan-Mar) winters were favored in regard to colder temperature and/or heavier snowfall with front-end loaded (roughly mid Nov-to late Jan) second. There were just a hand-full of cold Decembers, Januarys and Februarys which helps gives more credence to a sharply colder month or period mentioned earlier. On the flip-side; chances of mild periods increase with time with February looking the best.
And one more thing; there are enough well below normal (or "snowless") months that showed up in every set of analogues to be concerned about a bust on the snowfall prediction but I'll hang tough with the normal to above - for the time being anyway.
Analogue Maps
Computer Guidance
The predominant upper flow shows up well in both the analogues and the computer projections. In addition; the temperature and precipitation projections from both are a close match. Note; how the Canadian Upper low settles in and expands with time as the Arctic/Polar jets dig into the northern part of the country. Meanwhile; the Pacific and subtropical jet remains strong bringing in milder air aided by higher pressure ridging from the Pacific into Southeastern US. The two dominant features also show up well in the temperature predictions from both the analogues and computer outlooks.
Annotated analogue maps and storm tracks


Active storm tracks from the north and west (southern Canada, north and central US) and south and east (Mississippi and Ohio Valley, Eastern Lakes and East Coast) will follow the jets. Placement of the jet core and surface air will determine temperatures and types of precipitation

Placement of storm tracks
Atmospheric storm tracks are very important for climate dynamics. They indicate regions of maximum transient poleward energy transport and zonal momentum transport (Chang et al. 2002) and play an important role in setting the dynamical response of the mid latitudes to global warming through their radiative forcing (Voigt and Shaw 2015). Storm tracks are generally calculated as the standard deviation of atmospheric data that has been filtered in the time domain to isolate synoptic variability (Blackmon 1976). Typical variables used to calculate storm tracks are meridional wind, eddy kinetic energy, or geopotential height at a fixed vertical level. This metric represents the climatology of baroclinic wave activity (i.e., high and low pres-sure systems), but for historical reasons has been termed ‘‘storm track’’ [see Wallace et al. (1988) for more discussion; go here.
Temperature/Precipitation Maps from Analogues then CFSv2 model


A Blend of various Foreign Models is very similar to our CFSv2 for upper air patterns; temperatures and precipitation.
Predominant 500 Heights

TEMPS

PRECIPITATION

Bill Deedler - SEMI_WeatherHistorian
Hope you have a Good Thanksgiving
