Nov 26, 2020

Winter Outlook 2020-21~ Type of La Nina Conditions, Polar Vortex and Busy Northern Pacific

As the global pattern evolved into a La Nina by mid fall; autumn's weather across Southeast Lower Michigan was fairly nice but a bit cooler than average early to mid season but was interrupted by a very notable spell of warm Indian Summer weather the first half of November (more below). The fall season was also wetter than average into early November with much of the surplus coming in September.

As stated; one of the most notable autumn weather events was the well above normal temperatures in November that contrasted greatly to the cold and snowstorm during the first half of November 2019! One check of Detroit's LCD of November of 2020 to the November of 2019 LCD shows in detail, the astonishing contrast. 

Indian Summer weather with a few highs flirting with the upper range of record high temperatures isn't all that unusual around Southeast Lower Michigan, especially during La Nina falls. This autumn's stretch of Indian Summer weather not only flirted with record warmth but created several record high days of its own with three record highs at Detroit and four record highs at both Flint and Saginaw from the 8-11th! The record warmth wasn't confined just to Southeast Lower Michigan but to all of Michigan


                                                    Courtesy of the NWS DTX
 
                                                  Courtesy of WJRT TV_Channel 12

Glancing back at the first half of the last two Novembers at Detroit; makes some interesting contrasts - and what a difference a year makes!


PRELIMINARY LOCAL CLIMATOLOGICAL DATA (WS FORM: F-6)


                                          STATION:   DETROIT MI

                                          MONTH:     NOVEMBER

                                          YEAR:      2019

                                          LATITUDE:   42 13 N

                                          LONGITUDE:  83 20 W


  TEMPERATURE IN F:       :PCPN:    SNOW:  WIND      :SUNSHINE: SKY     :PK WND

================================================================================

1   2   3   4   5  6A  6B    7    8   9   10  11  12  13   14  15   16   17  18

                                     12Z  AVG MX 2MIN

DY MAX MIN AVG DEP HDD CDD  WTR  SNW DPTH SPD SPD DIR MIN PSBL S-S WX    SPD DR

================================================================================


 1  42  35  39  -8  26   0    T    T    0 12.8 26 280   M    M   9 8      35 280

 2  48  37  43  -4  22   0 0.03    T    0 11.3 30 270   M    M   9 5      39 260

 3  47  33  40  -6  25   0    T    T    0  9.6 16 240   M    M   9        21 250

 4  54  42  48   2  17   0 0.02  0.0    0 13.0 25 220   M    M  10        31 250

 5  48  31  40  -6  25   0 0.00  0.0    0 10.4 22 250   M    M   7        30 250

 6  43  27  35 -10  30   0    T    T    0  5.7 14 310   M    M   8 18     17 310

 7  38  25  32 -13  33   0 0.03  0.2    T 11.5 18 310   M    M   8 1      25 340

 8  39  22  31 -14  34   0 0.00  0.0    0  7.7 15 340   M    M   4        21 290

 9  41  27  34 -10  31   0 0.00  0.0    0 11.0 21 210   M    M   9        27 210

10  47  34  41  -3  24   0 0.03    T    0  7.9 16  10   M    M  10 18     20  10

11  34  23  29 -15  36   0 0.81  8.5    1 11.0 18 330   M    M  10 128    24 330

12  25  13  19 -24  46   0 0.05  0.7    9 10.7 20 310   M    M   6 18     27 300

13  25   7  16 -27  49   0 0.00  0.0    7  8.4 17 190   M    M   8 18     23 180

14  33  24  29 -13  36   0    T  0.1    6 10.3 20 250   M    M  10 18     26 250

15  36  26  31 -11  34   0 0.00  0.0    5  8.6 18 250   M    M   8 18     24 260

16  34  22  28 -14  37   0 0.00  0.0    3  8.4 14  60   M    M   7        19  40

 
__________________________________________________________________________________
              -11.0                           
                                                              
                                          STATION:   DETROIT MI
                                           MONTH:     NOVEMBER
                                          YEAR:      2020
                                          LATITUDE:   42 13 N
                                          LONGITUDE:  83 20 W
 
  TEMPERATURE IN F:       :PCPN:    SNOW:  WIND      :SUNSHINE: SKY     :PK WND
================================================================================
1   2   3   4   5  6A  6B    7    8   9   10  11  12  13   14  15   16   17  18
                                     12Z  AVG MX 2MIN
DY MAX MIN AVG DEP HDD CDD  WTR  SNW DPTH SPD SPD DIR MIN PSBL S-S WX    SPD DR
================================================================================
 
 1  50  33  42  -5  23   0 0.04    T    0 20.3 32 280   M    M   7 18     45 280
 2  48  28  38  -9  27   0 0.00  0.0    0 15.9 26 240   M    M   7        35 310
 3  59  33  46   0  19   0 0.00  0.0    0  9.2 16 220   M    M   2        21 270
 4  72  42  57  11   8   0 0.00  0.0    0 12.1 23 210   M    M   1        30 200
 5  66  52  59  13   6   0 0.00  0.0    0 12.3 18 220   M    M   7        23 220
 6  71  46  59  14   6   0 0.00  0.0    0  9.3 18 230   M    M   4 8      22 230
 7  71  46  59  14   6   0 0.00  0.0    0  7.1 20 210   M    M   4 18     24 240
 8  73  43  58  13   7   0 0.00  0.0    0  2.6 10 140   M    M   1 18     14 170
 9  77  47  62  18   3   0 0.00  0.0    0  5.1 14 200   M    M   4 18     20 180
10  77  57  67  23   0   2 0.21  0.0    0 12.7 29 220   M    M   7 1      36 190
11  65  35  50   6  15   0 0.03  0.0    0 11.7 24 230   M    M   5 1      31 240
12  50  30  40  -3  25   0 0.00  0.0    0  1.9  9 180   M    M   2 18     12 120
13  48  31  40  -3  25   0    T  0.0    0  8.5 22 270   M    M   9 18     29 290
14  47  25  36  -6  29   0 0.08  0.0    0  6.9 17 170   M    M   5 18     26 160
15  54  39  47   5  18   0 0.75    T    0 22.3 45 240   M    M  10 138    61 230
16  46  37  42   0  23   0    T    T    0 14.5 26 270   M    M   8 8      36 270

________________________________________________________________________________

                                +5.5               

The most impressive departures and in spite of several record highs this November; would certainly have to go to the cold in the first half of November of 2019. It was twice as cold /-11.0/ as this November was warm /+5.5/ relative to normal. Therefore; the first half of last November averaged 16.5 degrees colder than this November! Add to that; the record snowstorm on the 11-12th with 9.2" and a couple of record lows for good measure (November 12th- 13 & 13th- 7) at Detroit and you've got quite a contrast! Check out here the coldest November on record /1880/ with a severe cold wave for November.

=================================================================================

Winter Outlook for the Winter of 2020-21


Local Analogue Research, Hemispheric Data and Computer Modeling suggests:  

Temperatures - Normal to Above (or -1.0 to +2.5 temp departure)

Most analogue winters averaged normal to slightly below with an average sitting at 26.5 (30 year norm @ 27.9 or -1.4 below). Taking into account the more recent La Nina winters (including Modoki La Ninas), computer guidance and recent trends; I look for a normal to above normal temperature winter. This is both for the winter (Dec-Feb) and cold season (Nov-Mar).  


Since my October update on La Nina; latest computer guidance and the patterns of the more recent La Nina analogues present an argument for an overall milder winter but with aggressive cold snaps. In fact; past data in the analogues also argue for a sharply colder than average month (or period) into early spring see analogue section (or intra-month example; mid Jan to mid Feb, depending on timing). With the variability in these type of La Nina's; leaves me with a two-tier temperature forecast - normal to above.


Precipitation - Above

Analogue guidance and computer model guidance from numerous sources overwhelmingly call for a wetter than normal winter.


Snow - Normal to Above

The majority of winters were active as there were three main storm tracks affecting the region.

Snowfall prognostication this season is more problematic than precipitation as a whole since storm tracks affecting the region will be north, over Southeast Lower Michigan and south over the Ohio Valley. This leads to snow, rain, rain to snow, snow to rain depending on the system. The unusually strong mid Pacific jet (for a La Nina) will lead systems to bring in milder Pacific/Gulf of Mexico air and thus; mixed precipitation should be a frequent visitor.

In addition; there is some conflicting data for this winter's La Nina. A winter that on first indication, should have been a more straight forward, moderate to strong La Nina. This year's unfolding La Nina and its hemispheric affects may not turn out a typical La Nina (see below). 


Hemispheric Discussion - ENSO

Recent cooling of water temperatures across the central Pacific have led a rapidly developing La Nina that already is in moderate territory (SST anomaly between -1.0 and -1.4 degrees C). Latest temperature anomalies across the 3.4 ENSO have dropped to between -1.5 to -1.7 now and thus, just dipping into the strong category. It is my thinking that the La Nina has attained its general strength for this cycle, therefore the moderate or strong past La Nina's represent analogues best - with a couple of weaker ones. 

                        Past ENSO La Ninas /blue/ and El Ninos /red/ thru 2006

 Recent ENSO 2000-2018

A caveat now making an appearance is the coldest water departures have drifted to the center of the La Nina (see image below) and thus a La Nina "Modoki" could be in our meteorological midst.


Recent 5KM surface water temps show the colder waters of the La Nina have migrated out into the mid Pacific while the waters over the eastern Pacific, have moderated and warmed a bit (Fig's 1 & 2, click images).

 Fig 1

                                                  Fig 2                                                 


I first introduced this (Modoki) ENSO phenomena back in the El Nino of 2018-19 and it's possible influnce on our winter.  That winter was an "on and off" El Nino influenced winter as far as temperature and snowy/snowless winter pattern during the season and location. Detroit and areas south received much below normal snow but a heavy snow area occurred around the Flint region and areas north into the Saginaw Valley. Those locations received above to well above normal snow. The overall weather pattern across the country was more a-typical for a normal La Nina winter.

A La Nina Modoki (Fig 1) disrupts the typical La Nina atmospheric pattern as the waters remain colder over the center of the Pacific while moderating and warming over the eastern Pacific near South America (Fig 2).  The result is a more complicated pattern across the States with the Pacific Coast receiving more moisture and rain than is normally seen in a La Nina (especially the northern half). In addition; troughing occurs more over the west and center part of the country leading to a stormy and colder pattern in the north; while the eastern half of the country oscillates more between cold and mild - snow and rain.  

Figure 1 shows key differences in sea surface temperature distributions and atmospheric circulations; (a) A conventional La Niña and (b) A La Niña Modoki. The single-cell broad scale Walker circulation splits into two cells during a Modoki event.

Since the late 1970s, conventional ENSO La Niña and El Niño events have become less frequent, while a second “flavor” of ENSO – Modoki – from the Japanese language meaning ‘similar but different’ – has become slightly more prevalent. Both El Niño and La Niña Modoki events can occur independently at times when tropical ocean indices may not achieve thresholds in a classic El Niño or La Niña event.

Japanese research scientists later uncovered the Modoki phenomenon in 2007. Both El Niño and La Niña Modoki events can significantly influence the temperature and precipitation over many parts of the globe. For example, the West Coast of the United States is wet during El Niño but dry during El Niño Modoki.

Types of La Ninas related to placement of colder, below normal waters

Thus far the projection for the La Nina is for the coldest departures to be located  in the center to east Pacific, closer to the seasonal to the mild winters


Latest computer projection consensus has La Nina peaking but still with varying intensities. Our CFSv2 model had continued to strengthen it further down into the stronger category, averaging around -2.0C (black dashed line, second chart) but now has been corrected recently further up to -1.5 to -1.7 (third chart) and current intensity. At one point the model had the La Nina peaking around -2.5C, which would have been a record La Nina, I believe. 


                                                  Model Consensus


   CFSv2 Model Projections

 
A corrected version of the CFSv2 SST's was put out which projected the La Nina to be less intense and frankly; more believable.


  Running 3-Month Mean ONI values for past ENSOs


                     North Atlantic Oscillation/Arctic Oscillation - NAO/AO


As usual; this should be one of the most important meteorological influences for this winter In the last few years, it's had an on and off again effect on our weather, working with Stratospheric warming and the EPO (more later). Refreshing our memory on this little number shows why the major influence with our weather.
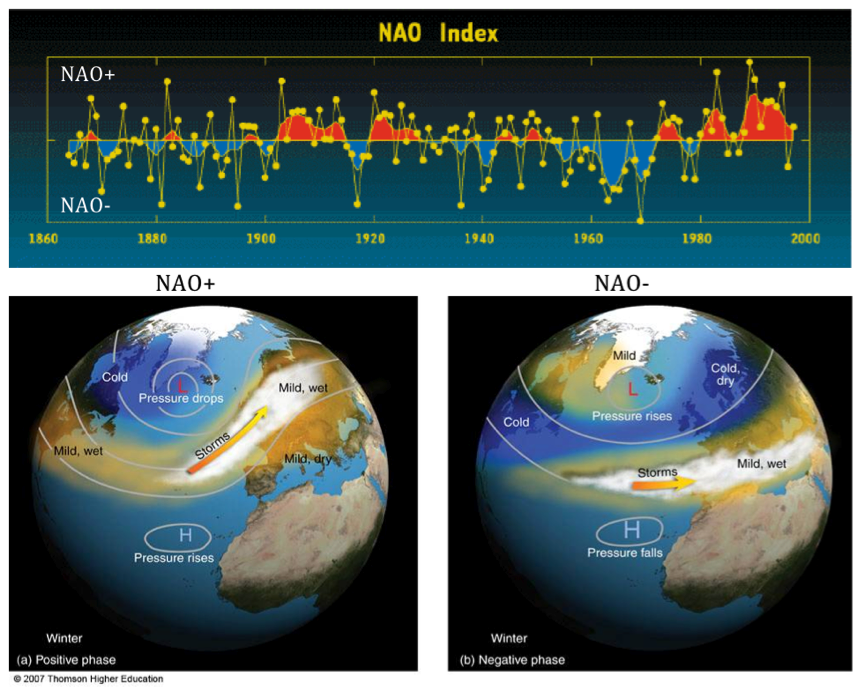
 

Generally when the NAO/AO index is in the positive phase; more zonal winds dominate as the polar vortex lifts up toward or over it's home, the North Pole region. However; when in a negative phase; the cold vortex or wind flow is more meridional and thus; cold Polar or Arctic air is readily pushed south from the Pole; down into the eastern half of the U.S. (among other Northern Hemisphere areas). Many times ridges of higher pressure develops in conjunction on the North American west coast and/or into Greenland.


Most winters; the phase of the NAO/AO is one of the most important ingredients to the type of winter to be had over the central and eastern part of the country. However, this is also one of the most elusive oscillations to predict for more than a week or two. Last winter the NAO was dominated by a positive phase and that in conjunction with the weak El Nino resulted in a mild winter (Dec-Feb)

Seasonal NAO

Recent winter/cold season NAO index values
YearDJFDJFMONDJFM
2009-2010-3.34-2.71-1.78
2010-2011-1.06-0.84-1.52
2011-2012+2.18+2.08+1.73
2012-2013+0.47-0.58-1.11
2013-2014+2.19+2.05+1.31
2014-2015+2.06+2.04+1.05
2015-2016+2.33+1.83+1.62
2016-2017+1.22+1.17+0.27
2017-2018+0.91+0.40+0.34
2018-2019+1.16+1.47+0.57
2019-2020+2.85+2.23+0.99

Latest NAO projections shows the positive phase during November (yellow highlighted) to fall into neutral and negative with time, thus predicting colder weather within the time-period. Be advised; this is updated daily and doesn't always remain consistent.


Pacific Decadal Oscillation /PDO/ and associated subset EPO


The warm phase of the Pacific Decadal Oscillation is represented on the left side of the following example and the cold phase on the right.


                               Warm Phase of the PDO               Cool Phase of the PDO

Latest SST's (below) seemed to have evolved into a cool phase recently. Note the above or well above normal SST's west of Alaska and south over the mid Pacific. Relatively cooler anomalies have formed further east right along the West Coast.

The warmer SST's further off the West Coast south of Alaska; generally encourages high pressure ridging which may help at times, deliver Polar and Arctic air from the northern Canadian regions into the Lakes. This was especially true during the hard, snowy winter of 2013-14 even when the NAO was not always negative.

Recent Global SST


Eastern Pacific Oscillation

A negative Eastern Pacific Oscillation /-EPO/ is displayed below along with its cold affects it can have downwind on North America. The Winter of 2013-14 was one cold, bitter winter along with exceptionally heavy amounts of snow across Southeast Lower Michigan. The brutal cold delivered to the region on many occasions was either the cause or was aided by a strong -EPO helping to build a strong high pressure ridge on the West Coast which in turn; slammed our region with a deep low pressure trough filled with cross polar air from Siberia and North Pole.


Likewise; a positive Eastern Pacific Oscillation /+EPO/  pattern is displayed below along with its mild affects it can have downwind on North America.


A three-way indices pattern /NAO, AO and EPO/ evolving together can have interesting weather for the eastern half of the country as seen below in the autumn of 2019.


Pacific/North American /PNA/ Pattern


The above oscillations help create the Pacific/North American /PNA/ pattern. A negative /-PNA/ generally reflects a trough over the western portion of the US with ridging and warmer weather in the East. A positive /+PNA/ is reflected by a broadening trough and influx of colder air into the center and subsequently, the eastern portion of the US.

                                                                        -PNA


+PNA


 Solar Cycle Relevance

Solar cycle actual effects on short term weather and longer term climate variability remain a controversial subject. I've read several articles which support or are against their shorter term winter relevancy. Some theorize that both natural solar cycles and man's influence affect our climate. I am in favor of the solar cycle being somewhat relevant and sometimes giving the present winter cycle a "little kick" in regard to hemispheric wind flow patterns and resulting temperatures.  Numerous recent studies for example, do in fact make the connection to our climate and solar activity including wintertime effects. One of the studies stated the following:


The Euro–Atlantic sector seems to be a region with a particularly strong solar influence on the troposphere. In fact, significant positive correlations between solar activity and surface temperature in Europe have been reported in several papers (e.g. Tung and Camp, 2008; Lean and Rind, 2008; Lockwood et al., 2010; Woollings et al., 2010), although long records tend to give very weak signals (van Oldenborgh et al., 2013). We found a weak but significant change in the mean late winter circulation over Europe, which results in detectable impacts on the near-surface climate. Figure 9 suggests that during solar minima more cold air is ad-   vected from the Arctic, thus resulting in a slightly increased probability of colder winters for large parts of the continent. Sirocko et al. (2012) recently reached the same conclusion after analyzing 140 yr in 20CR, although their results bare strongly dependent on their selection criteria for the solar minimum composite (van Oldenborgh et al., 2013), which includes only one winter for each solar cycle". 

Comparing solar cycles of the past analogue winters to the present is a possible influence only and not a major contributor. While the solar cycle was in various modes, the tendency is for La Nina winters to occur during the lower part of the cycle or during an overall, weaker cycle. This season's La Nina analogues resulted in about two thirds in the lower part of the sunspot cycle.

Longer Term Solar Sunspot Activity since 1850 ( X includes this season's Winter Analogues)

Note the analogues years that are below 100 (1-8) on the solar threshold and particularly the ones below 50 which are near/or at the bottom of the cycles (2-8). Interesting we have so many La Nina analogues (2-8) near the bottom of the solar cycles. Out of the 13 analogues, a little over half /7/ are at the bottom. The second chart shows we are in the beginning phase of the 25th cycle.


This year's solar sunspot cycle; at the bottom/start of the 25th cycle.

http://www.sidc.be/images/wolfjmms.png 

Siberia/Eurasia /North America Snow Cover 

One of the studies by Dr. Jonah Cohen uses October snow-cover over Siberia/Eurasia to aid in projecting out the main phase of the NAO and likely corresponding temperature pattern for the winter. Recently, early November is also considered in the comparisons.

The snow-cover over Siberia has actually been less than average until recently (second-third week of Nov?) and now one of the higher of recent years.  While across North America; snow-cover extent had been the largest in recent years from mid October to early November with a drop-off recently.

From recent Dr Jonah Cohen blog:

Northern Hemisphere Snow Cover

Snow cover advanced rapidly over the past week across Eurasia and is currently near decadal highs. Snow cover advance will likely continue to increase especially across East Asia and possibly into Europe the next two weeks. Above normal snow cover extent in October, favors a strengthened Siberian high, cold temperatures across northern Eurasia and a weakened polar vortex/negative AO this upcoming winter followed by cold temperatures across the continents of the NH.

 North American snow cover has stalled and is now near decadal means. The early advance of snow cover across Canada this fall, has likely contributed to an early start of cold temperatures across the Central and Eastern US.



THE QBO INFLUENCE

The QBO, or Quasi-Biennial Oscillation, is an oscillation in the wind direction in the stratosphere within about 15 degrees of the equator. Over a roughly two-year period, winds tend to oscillate between westward and eastward, with the switch between west and east winds starting high in the stratosphere and then shifting lower in altitude with time. The QBO is the result of waves propagating vertically in the atmosphere that then interact with the mean flow to slowly change wind speeds and direction. These changes influence the overall global circulation patterns, which in turn influence winter weather patterns across North America. 
 
The amplitude of the easterly phase is about twice as strong as that of the westerly phase. At the top of the vertical QBO domain, easterlies dominate, while at the bottom, westerlies are more likely to be found. At the 30mb level, with regards to monthly mean zonal winds, the strongest recorded easterly was 29.55 m/s in November 2005 and the strongest recorded westerly was only 15.62 m/s in June 1995 (Wikipedia).

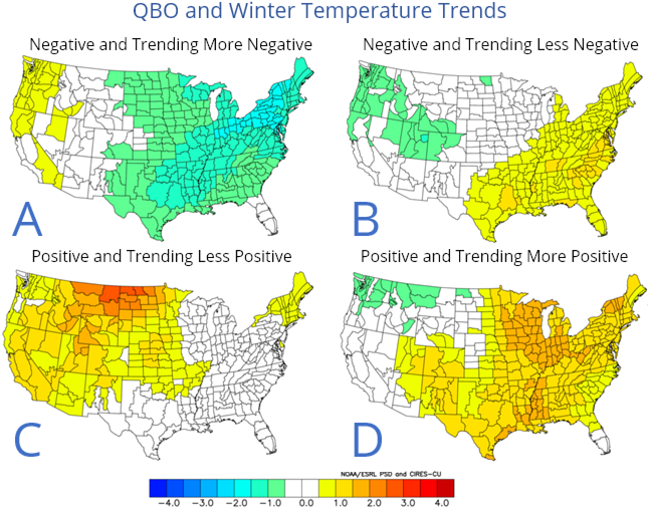
If you notice on my analogues; I included the QBO's for each available winter and compared it to the upcoming winter's QBO phase and trend. The present and expected QBO this winter is for a light to possibly moderate westerly wind.  The set of maps below show the differing influences of the QBO dependent on phase and trend. The QBO is presently in the light westerly (closest being maps in sequence; C then A).
 
 QBO and WinterTemperatures Trends


 WINTER 2020-21 ANALOGUES


Some additional analogue conclusions and category explanations in the analogue chart


AO/SC

AO - The predominant phase of the Arctic Oscillation during that winter. AO- (negative), AOn (neutral) or AO+ (positive).

SC -  position of the solar cycle during that winter. Breaking it down (see solar cycle chart):  

SC-- (opposite high cycle compared to the present, least similar) SC+/- (sunspots 
waning but not near minimum or 2019 low level. Finally, S++ where solar sunspot cycle is at or very close to the low cycle of 2019-20 and/or is at the same positioning 2019-20...the best comparison and likeness. There are several this time at 8, one of the highest likes - meaning the sunspot phase of the sun is very close to 7 other analogues out of the 13.
          
QBO - W=West wind prevailed that winter or E=East wind prevailed. Trends: -/- (weak and weakening trend), -/+ (weak but strengthening), s (steady trend, no change) +       
moderate and strengthening +/- strong but weakening. Note that the trend now in the fall of 2020 is W-, a light west wind and steady or slowly increasing /W/. This fits with all the analogue winter's that contained a light westerly to possibly moderate westerly QBO. 
 
Sib snow - Siberian snow cover in October and rate of change. Only one previous analogue winter had below compared to this past October's/early November since the data only goes back to the late 1990s. Notations are this fall compared to analogue fall: WA=Way above, A= above, B=below, % = equal to.

Letter n /next to the analogue winter years at Detroit/ - A warm November preceded these winters in all of Southeast Lower Michigan - like this present November 2020. 

Warmer than normal Novembers preceded several of my later Novembers in my analogues. Five analogues in the last six contained warmer than average Novembers. The best was November of  1975 which may turn out to be the closest to this November's average at 46 (and early indications not a bad analogue either). My set of analogues included mainly moderate to strong La Ninas with some weak in the 13 count this go around. The 1949-51 strong La Nina was not included due to it beginning during the winter of the 49-50 and ending during the early winter of 1950-51. Several are Modoki La Nina's with just as many "classic" La Nina's to give a good representation to both including various intensities but as stated, a decided preference to moderate to strong -as this year's.

A short detour on Detroit's warming if you can stand it:

One of the first things noticed is many of the earlier La Nina winters being a bit colder than the later La Ninas (since the 1980s). Ironically; the last four winters averaged 27.7 degrees; whereas all /13/ the winters averaged 26.5  or -1.2 lower. Therefore; the earlier winters before the 1980s have to be colder on average than 26.5 for all winters since the later four winters warmed the average up some. Sure enough; the first nine winters averaged 26.0 degrees. I only use the winter's since the 1980s for warmer because that is also when the heat island migrated out and around Metro Airport. Ironically (and what this paragraph is leading to) is that part of the 1.7 degree difference in the later four winters reflects the Detroit heat island rise in temperature at Detroit Metro; part is also due to the climate change warming and most likely, those winters were a bit warmer because of the heat island and climate warming.  The 100 year average winter temperature is about 26.7 degrees. Now the latest 30 year average from 1980 - 2010 is 27.9 or about 1.2 degrees warmer than the 100 year. In a year or two, we'll have the 1990-2020; 30 year average - and one guess which way that will trend). Working at Detroit Metro Airport better than half my career and all of my career in Southeast Michigan, I can assuredly say that Detroit's average temperature since the 1980s has been strongly influenced by meso-heat island due to expanding population and infrastructure in Southeast Lower Michigan and the airport itself.

Back to the Winter Outlook:

Temperatures and Snowfall:

Most analogue winters averaged normal to slightly below with an average sitting at 26.5 (30 year norm @ 27.9 or -1.4 below). Taking into account the more recent La Nina winters - Modoki La Nina winters- computer guidance and recent trends; I surmise the average of the winter analogues are on the cooler side and therefore; I look for a normal to above normal temperature winter. This is both for the winter (Dec-Feb) and cold season (Nov-Mar). The analogues contained front-end loaded, mid-loaded or back-end loaded winters regarding temperatures (coldest relative to norms) and snowfall (relative to averages). There were twice as many snowier winters (8/4) as there were snowless (see analogues and legends below). Potential for a major snowstorm or two in the snowy La Nina analogues was slightly greater in every month Dec-Mar with a lean toward late season.

In descending order; back-end loaded (roughly late Jan-Mar) winters were favored in regard to colder temperature and/or heavier snowfall with front-end loaded (roughly mid Nov-to late Jan) second. There were just a hand-full of cold Decembers, Januarys and Februarys which helps gives more credence to a sharply colder month or period mentioned earlier. On the flip-side; chances of mild periods increase with time with February looking the best.

And one more thing; there are enough well below normal (or "snowless") months that showed up in every set of analogues to be concerned about a bust on the snowfall prediction but I'll hang tough with the normal to above - for the time being anyway. 

Analogue Maps
Computer Guidance

The predominant upper flow shows up well in both the analogues and the computer projections. In addition; the temperature and precipitation projections from both are a close match. Note; how the Canadian Upper low settles in and expands with time as the Arctic/Polar jets dig into the northern part of the country. Meanwhile; the Pacific and subtropical jet remains strong bringing in milder air aided by higher pressure ridging from the Pacific into Southeastern US. The two dominant features also show up well in the temperature predictions from both the analogues and computer outlooks.

Annotated analogue maps and storm tracks


Active storm tracks from the north and west (southern Canada, north and central US) and south and east (Mississippi and Ohio Valley, Eastern Lakes and East Coast) will follow the jets. Placement of the jet core and surface air will determine temperatures and types of precipitation   

Placement of storm tracks

Atmospheric storm tracks are very important for climate dynamics. They indicate regions of maximum transient poleward energy transport and zonal momentum transport (Chang et al. 2002) and play an important role in setting the dynamical response of the mid latitudes to global warming through their radiative forcing (Voigt and Shaw 2015). Storm tracks are generally calculated as the standard deviation of atmospheric data that has been filtered in the time domain to isolate synoptic variability (Blackmon 1976). Typical variables used to calculate storm tracks are meridional wind, eddy kinetic energy, or geopotential height at a fixed vertical level. This metric represents the climatology of baroclinic wave activity (i.e., high and low pres-sure systems), but for historical reasons has been termed ‘‘storm track’’ [see Wallace et al. (1988) for more discussion; go here.

Temperature/Precipitation Maps from Analogues then CFSv2 model


A Blend of various Foreign Models is very similar to our CFSv2 for upper air patterns; temperatures and precipitation.

Predominant 500 Heights


TEMPS


PRECIPITATION


Look for winter weather write-ups from time to time here and on Facebook! 

 
Making weather fun while we all learn,
Bill Deedler - SEMI_WeatherHistorian


Hope you have a Good Thanksgiving


Nov 8, 2020

JUST WHAT IS INDIAN SUMMER AND DID INDIANS REALLY HAVE ANYTHING TO DO WITH IT?

While we've been enjoying this beautiful stretch of Indian Summer weather;  it reminds me of one of my very first articles on the orientations of the term "Indian Summer"

JUST WHAT IS INDIAN SUMMER AND DID INDIANS REALLY HAVE ANYTHING TO DO WITH IT?

Written by: William R. Deedler, Weather Historian
(originally written in the Autumn of 1996)

An early American writer described Indian Summer well when he wrote, "The air is perfectly quiescent and all is stillness, as if Nature, after her exertions during the Summer, were now at rest." This passage belongs to the writer John Bradbury and was written nearly an "eternity" ago, back in 1817. But this passage is as relevant today as it was way back then. The term "Indian Summer" dates back to the 18th century in the United States. It can be defined as "any spell of warm, quiet, hazy weather that may occur in October or even early November." Basically, autumn is a transition season as the thunderstorms and severe weather of the summer give way to a tamer, calmer weather period before the turbulence of the winter commences.

The term "Indian Summer" is generally associated with a period of considerably above normal temperatures, accompanied by dry and hazy conditions ushered in on a south or southwesterly breeze. Several references make note of the fact that a true Indian Summer can not occur until there has been a killing frost/freeze. Since frost and freezing temperatures generally work their way south through the fall, this would give credence to the possibility of several Indian Summers occurring in a fall, especially across the northern areas where frost/freezes usually come early.

While almost exclusively thought of as an autumnal event, I was surprised to read that Indian Summers have been given credit for warm spells as late as December and January (but then, just where does that leave the "January Thaw" phenomenon?). Another topic of debate about Indian Summer has been "location, location". Evidently, some writers have made reference to it as native only to New England, while others have stated it happens over most of the United States, even along the Pacific coast. Probably the most common or accepted view on location for an Indian Summer would be from the Mid-Atlantic states north into New England, and then west across the Ohio Valley, Great Lakes, Midwest and Great Plains States. In other words, locations that generally have a winter on the horizon! But then, what about the king of winter weather in the United States, Alaska? Do they have an "Indian Summer", or something similar? Some places in Alaska are lucky to have a "summer", let alone an Indian Summer! One would certainly have to throw out the notion of it usually happening in October or November, when, winter generally has already taken an aggressive foothold on much of the state. What about other locations that come to mind, The Rocky Mountain States and parts of Canada, particularity in the east and south? Note: If anyone reading this has any information on Indian Summers in those areas questioned, or just thoughts on Indian Summers drop me a note or comment. (Editors note: Over the years while at the NWS and after, I received several fascinating notes from all over the world on how common and widespread "Indian Summers" were with each having it's own specific local or regional definition).

A typical weather map that reflects Indian Summer weather involves a large area of high pressure along or just off the East Coast. Occasionally, it will be this same high pressure that produced the frost/freeze conditions only a few nights before, as it moved out of Canada across the Plains, Midwest and Great Lakes and then finally, to the East Coast. Much warmer temperatures, from the deep South and Southwest, are then pulled north on southerly breezes resulting from the clockwise rotation of wind around the high pressure. It is characteristic for these conditions to last for at least a few days to well over a week and there may be several cases before winter sets in. Such a mild spell is usually broken when a strong low pressure system and attending cold front pushes across the region. This dramatic change results from a sharp shift in the upper winds or "jet stream" from the south or southwest to northwest or north. Of course, there can be some modifications to the above weather map scenario, but for simplicity and common occurrence sake, this is the general weather map.

Now we come to the origin of the term itself, "Indian Summer". Over the years, there has been a considerable amount of interest given to this topic in literature. Probably one of the most intensive studies occurred way back around the turn of the century. A paper by Albert Matthews, written in 1902, made an exhaustive study of the historical usage of the term. Evidently, the credit for the first usage of the term was mistakenly given to a man by the name of Major Ebenezer Denny, who used it in his "Journal", dated October 13th, 1794. The journal was kept at a town called Le Boeuf, which was near the present day city of Erie, Pennsylvania. Matthews however, uncovered an earlier usage of the term in 1778 by a frenchman called St. John de Crevecoeur. It appeared in a letter Crevecoeur wrote dated "German-flats, 17 Janvier, 1778." The following is a translation of a portion of the letter:
"Sometimes the rain is followed by an interval of calm and warmth which is called the Indian Summer; its characteristics are a tranquil atmosphere and general smokiness. Up to this epoch the approaches of winter are doubtful; it arrives about the middle of November, although snows and brief freezes often occur long before that date."

Since the writer says, "it is called the Indian Summer", obviously one could argue that term would have had to been used before him and became popular, but by whom, an earlier explorer or possibly an Indian tribe?

Now, after looking at all of this, the question you might ask yourself is, "Does the term 'Indian Summer' really have anything to do with Indians?" Again, there is host of possibilities, read on...

One explanation of the term "Indian Summer" might be that the early native Indians chose that time of year as their hunting season. This seems reasonable seeing the fall months are still considered the main hunting season for several animals. Also, the mild and hazy weather encourages the animals out, and the haziness of the air gives the hunter the advantage to sneak up on its prey without being detected. Taking this idea one step further, Indians at that time were known to have set fires to prairie grass, underbrush and woods to accentuate the hazy, smokey conditions. But Albert Matthews pointed out that the Indians also did this at other times of the year. Other possibilities include; the Indians made use of the dry, hazy weather to attack the whites before the hard winter set in; that this was the season of the Indian harvest; or, that the predominant southwest winds that accompanied the Indian Summer period were regarded by the Indians as a favor or "blessing" from a "god" in the desert Southwest. Another idea, of a more prejudicial origin, was that possibly the earliest English immigrants equated Indian Summer to "fools" Summer, given the reliability of the resulting weather. Finally, another hypothesis, not at all in the American Indian "camp" of theories, was put forward by an author by the name of H. E. Ware, who noted that ships at that time traversing the Indian Ocean loaded up their cargo the most during the "Indian Summer", or fair weather season. Several ships actually had an "I.S." on their hull at the load level thought safe during the Indian Summer.

In any event, there are several theories or possibilities of the explanation and origin of the term "Indian Summer", yet no one theory has actually been proven. Given the fact it has been centuries since the term first appeared, it will probably rest with its originators. All in all, even with the variety of opinions on this weather (or seasonal) phenomenon, the most popular belief of Indian Summer is as follows...It is an abnormally warm and dry weather period, varying in length, that comes in the autumn time of the year, usually in October or November, and only after the first killing frost/freeze. There may be several occurrences of Indian Summer in a fall season or none at all.

Since Indian Summers are fairly common, it would be interesting to find out if there is any correlation between the years that had no Indian Summer (in a particular area) and the type of winter weather that followed. Oh well, possibly another time and another article but enjoy the Indian Summer while its around, because one thing is for certain, it never lasts!

Making weather fun while we all learn,
Bill Deedler -SEMI_WeatherHistorian


Oct 20, 2020

LA NINA WINTER IS ASSURED FOR WINTER 2020-21 ~ BUT OF WHAT INTENSITY?

Latest data coming in on the La Nina developing over the Pacific for the upcoming winter continues to change - and intensify - with updates; especially with the American CFSv2. Latest data shows the differences in each individual model and within the CFSv2 itself. Researching ahead of my traditional Winter Outlook is bringing up some interesting trending features in the CFSv2.

First off; here's where we are as of early-mid October as far as La Nina (note the increase in below normal anomaly sea surface temps in blue - /SST/)


CFSv2 Modeling as of mid October


As you can see by the dashed ave line (above) on the Nina 3.4 SST forecast; the CFSv2 has gone full marks on the La Nina anomaly intensity by projecting a solid -2.2C or strong La Nina this winter. The CFSv2 Model sits in the outlying range for La Nina intensity this go-around and it does appear she's a bit aggressive at this time.

Meanwhile; other dynamic and statistical models have their own idea how strong the La Nina will be this winter (below).


The consolidation zero's in around -1.5C or Moderate La Nina


In my process of "analoging"; I try to align similar hemispheric and local patterns in previous similar ENSO years to match up with the present patterns. Sometimes, these similar patterns can go back several months and even years. And, these are not only meteorological patterns; various ocean cycles and solar cycles are researched and where possible, paralleled and also considered.  Of course this can lead to problems from the "get-go" when and if ENSO projection models are varying on what type of ENSO, strength and timing. Usually the type of ENSO isn't as much of an issue as its strength and timing (actually, really not unlike general weather forecasting).

Below are the CFSv2 latest ENSO SST La Nina forecast - November - and the winter. But remember; the model is projecting a strong la Nina through the winter and it's one of the strongest.


The temperature/precipitation winter forecasts (below) are very interesting from the CFSv2 and is beginning to reflect what I'm seeing in Long Range GFS/CFS. Very cold air storing up in Canada, milder conditions in the much of southern and central States and strong baroclinic zone across the northern tier of the US. And, of course, SE Lower Michigan is in that zone. Remember, the CFSv2 is just showing temperature and precipitation anomalies based on its ENSO outlook. Therefore at this junction; this particular model projection shows basically a normal to slightly above normal temperature winter accompanied by above normal precipitation.

There is a lot more current and Global Model information pouring in now along with my hybrid set of Winter Analogues.

Look for my Winter Outlook in November.

Making weather fun while we all learn,
Bill Deedler -SEMI_WeatherHistorian


Jul 4, 2020

THE "GRAND DADDY" OF SOUTHEAST MICHIGAN HEAT WAVES AND OTHER HEATWAVES

In the midst of a summer heatwave; I thought it imperative to put our present heatwave in perspective and compare to other notable heatwaves in Southeast Lower Michigan's past.  Several 90+ days are expected this week /4th-10th anyway/. There are some subtle signs of a possible break next weekend.


THE "GRAND DADDY" OF SOUTHEAST MICHIGAN HEAT WAVES 

                                                        July 8th - July 14th, 1936

 (originally written in the late 1990s with updates 2013/2020)

Written by: William R. Deedler, Weather Historian 
 
Though heat waves or hot spells generally occur nearly every summer, no heat wave compares in intensity nor in duration than the heat wave that occurred across Southeast Lower Michigan in the summer of 1936. For many of us, it was when our grandparents were in their young or middle-age adult years. Little, if any, exaggeration would accompany their tales of the oppressive heat experienced sixty years ago, back in July 1936.

The last week of June into the first week of July 1936 was quite variable with afternoon highs ranging from around 70 to near 90. Evidently, weather patterns were quite progressive. After a day or two of heat build up, a cold front would push through the area and sweep the heat to the south and east on a regular basis. A change in the weather pattern was heralded by a strong but dry warm front that pushed across the area midday on July 6th. Very warm air rushed north into Southeast Lower Michigan, causing the mercury to rise up to near 90 on the 7th, but this was merely a hint of the heat to come.

On the afternoon of the 8th, the temperature soared to just shy of 105 (104.4) degrees and thus, the unprecedented heat was on. For the next seven consecutive days, the mercury would "bubble" above the 100 degree mark (see Table 1). The oppressive heat was compounded by humidity levels generally ranging in the 30s and 40s during the afternoon hours. While those levels are relatively low any other time, when combined with temperatures 100+, the heat index or, how hot it really felt, ranged roughly from 110 to 130 degrees. Little, if any relief was found during the evening hours into midnight with temperatures ranging from the mid and upper 90s at the start (6 to 7 pm) to hovering still in the mid 80s at midnight. For a few hours before dawn, overnight low temperatures "cooled" into the mid 70s. Desert-like conditions were exaggerated by the non-existence of rain. The thirst of the parched land was left un-quenched as not one drop of rain was officially recorded at the Detroit downtown office through the period.

Since this was 1936, the residents of Southeast Lower Michigan did not have the luxury of air conditioned homes, businesses or shopping malls to take refuge from the heat. Most people had to make do with the old standbys such as fans, blocks of ice from the Ice Man (the Ice Man cometh') or maybe by just taking a swim. While other heat waves in Southeast Lower Michigan have lasted longer, none had been longer accompanied by the fierce heat of this one. I was unable to find any documentation of heat related deaths (I'm not sure it was even done at this time), but with this intense of a heat wave, I'm sure there were cases.

The break in this torturous heat wave came without fanfare (storms). Not even a shower was noted in the log. Looking at the observations on the 14th...the wind shifted from the southwest to the northwest and then to the northeast. A lot of the characteristics of a "backdoor" cold front pushing south- southwest out of southern Canada. Occasionally these fronts will come through dry with an abrupt wind shift and falling temperatures. The temperatures fell from 104 at 200 pm...to 85 at 400 pm to a relatively chilly 69 by midnight. The heat wave started with a 104 degree reading on the 8th and ended with the same on the 14th. The first drop of rain was long in coming and not observed until a measly .08 fell on the 23rd.
 
Table-1 - Summary of the daily highs, lows and resultant means
-------   for July 8th - 14th, 1936 in Detroit, Michigan.
         
           Date          High      Low       Mean
                       
         July  8th       104 *      72        88
                  
         July  9th       102        75        89
                                    
         July 10th       102        77        90 **
                                    
         July 11th       101        77        89 
                                    
         July 12th       100        76        88 
                                    
         July 13th       102        73        88
                                    
         July 14th       104        69        87
                                                        
              *  Second highest all time temp 
              ** Second highest all time mean

Another, very notable heat wave that baked the area for a longer period of time but was not quite as hot, occurred in the late summer of 1953 from August 26th - September 3rd. An eleven day string 90 degrees or better, cooked the area. What's worse, nine of those days were 95 degrees or higher, with two of those hitting the century mark. Those two 100 degree days occurred near the end of the heat wave on September 2nd and 3rd, and with the exception of one other day, were the latest 100 degree days ever reported in Detroit (the latest 100 was also back in the "dust bowl" 1930s, on September 15th, 1939). Still another heat wave, in the Summer of '64, was one day longer (12) than the one in 1953 and has the "honor" of the longest heat wave on record when looking at just consecutive days of 90 degrees or greater. This heat wave extended from July 17th - 28th, 1964. There were no 100 degree days during this period, with the highest temperature being "only" 95.

On a more recent note and better in the memory of Southeast Lower Michiganders, is the hot summer of 1988, when a record amount of 90 degree or better days, 39 to be exact, produced one hot, sultry summer. The previous record was 36 days which again, occurred in "dust bowl 30s" (1934) when also, the hottest temperature of all time, (105 July 24th, 1934), occurred in Detroit. In addition to the record amount of 90 degree days in 1988, we topped the 100 mark 5 times, with the highest at 104 on June 25th. We missed the all time high by just a degree, but for those who remember, a hot, desert-like wind blew across the area that day as dew points dropped into the lower 60s, and humidities fell into the 20s.

That memorable summer of '88 became the seventh hottest summer (Jun-Aug) ever recorded in Detroit with a average of 74.2 (see updated listings below). The fourth hottest summer goes to 1955, with an average of 74.4 degrees. During that hot summer, the month of July set the record for days of 90 degrees or greater in a month with 17. This was the primary reason why July 1955 became second hottest month ever in Detroit, with a average temperature of 79.1. Last July (2012) superseded that temperatures with 79.3 for Detroit's hottest July. We now come to our hottest summers, at least in the last 142 years (1870). The "gold" medals goes to 1995 and again,  just last year in 2012! That's right, just last year during the 3 month summer period (Jun-Aug), Detroit averaged 74.5 degrees helped tremendously by the hottest July. Strangely enough though, back in July 1995 that July didn't even place in the top 10 hottest months. The hot month in the Summer of '95 was August, with an average temperature of 77.1, making it the hottest August on record. June 1995 placed in at the eleventh hottest.

Here is the updated top  20 Hottest/Coldest Summers on record at Detroit, Flint and Saginaw. Several of our recent summers have entered the record books for heat and changed previous rankings, especially at Detroit.

Top 20 Coldest/Warmest Summers in Southeast Lower Michigan /through 2019/

RankDetroit Area* Flint Bishop** Saginaw Area***
Coldest Warmest Coldest Warmest Coldest Warmest
Temp Year Temp Year Temp Year Temp Year Temp Year Temp Year
1 66.5 1915 74.9 2016 65.4 1992 74.2 1933 64.8 1915 73.0 1931
2 67.0 1992 74.8 2012 66.1 2009 74.0 1934 65.1 1992 72.9 1933
3 67.3 1927 74.8 2005 66.2 1958 73.8 2016 65.5 1982 72.5 1955
4 67.5 1875 74.5 1995 66.3 1960 72.7 1936 65.8 1945 72.3 1995
5 67.6 1903 74.5 1955 66.5 1969 72.6 1939 65.9 1950 72.1 1930
6 67.8 1985 74.4 2018 66.6 2004 72.6 1931 65.9 1924 72.1 1921
7 67.9 1912 74.4 2011 66.7 1985 72.6 1921 66.1 1985 72.0 2012
8 67.9 1907 74.4 2010 66.8 1972 72.3 2010 66.4 2009 72.0 2010
9 68.1 1982 74.2 1988 66.8 1967 72.3 1949 66.4 2004 72.0 1937
10 68.2 1972 74.0 1933 66.9 1962 72.2 1955 66.4 1979 71.9 1988
11 68.3 1979 73.8 1949 66.9 1927 72.0 1935 66.5 1977 71.9 1936
12 68.3 1902 73.7 1921 67.0 1982 71.9 2011 66.6 1951 71.8 2016
13 68.3 1891 73.6 1952 67.0 1950 71.9 1938 66.8 1946 71.7 1998
14 68.4 1889 73.5 1991 67.1 1965 71.8 1988 66.9 1965 71.5 1934
15 68.5 1883 73.5 1959 67.1 1945 71.7 2012 66.9 1962 71.5 2018
16 68.7 1917 73.5 2002 67.2 1997 71.7 1995 66.9 1917 71.5 1932
17 68.8 1924 73.5 1931 67.4 1951 71.7 2002 67.0 1958 71.4 2011
18 68.8 1904 73.2 1944 67.4 1957 71.7 1987 67.0 1926 71.4 1959
19 68.9 1967 73.0 1987 67.4 1924 71.6 2005 67.2 1972 71.2 1973
20 69.1 1897 73.0 1919 67.5 2000 71.6 1983 67.3 1981 71.2 1949


The Deadly Summer Heat

Written by: Jeff Boyne - National Weather Service La Crosse Wi
 
In a normal summer, about a 175 Americans die as a result of the taxing effect that excessive heat and humidity can have on the body. In a disastrous heat wave of 1980 more than 1,250 people died in St. Louis, Missouri. Just last summer, Chicago experienced its worst weather-related disaster with 465 heat related deaths recorded during the period from July 11-27.

How Heat and Humidity Affects the Body:

The human body gets rid of excessive heat (above 98.6 F) by increasing the rate of the blood circulation. This causes the blood vessels to expand to accommodate the increased flow. The tiny blood capillaries in the upper layers of the skin are also put into operation. By doing this, the blood is able to circulate closer to the skin's surface and the excess heat in the body is able to be dispensed into the cooler atmosphere surrounding the body.

At the same time, water diffuses through the skin from the sweat glands in the form of perspiration. Sweating, by itself, does nothing to cool the body. Evaporation of the perspiration must take place in order for the process of sweating to be of any use. When perspiration evaporates, it takes some of the excess heat away from the body; thus, the body is cooled.

If high humidity accompanies the hot temperatures, the body will have a very hard time cooling itself down, because the perspiration on the skin will not evaporate off of the skin. As a result, the body will continue to try to cool itself down by sweating. This will not only cause the body to lose water, but it will also lose salt. If the body cannot cool itself down or if it loses too much salt, one of the following three heat disorders will result in the table-2 below.

Table-2 3 Types of Heat Disorders
HEAT DISORDER SYMPTOMS FIRST AID
Heat Cramps Painful spasms usually in the muscles of the legs and abdomen. Heavy sweating. Get the person to a cooler place. If the victim has no other injuries and can tolerate water, give one- glassful every 15 minutes for an hour.
Heat Exhaustion Heavy sweating, weakness, skin cold, pale and clammy. Pulse thready. Normal temperature possible. Fainting and vomiting. Get the person out of the heat and and into a cooler place. Have them lie down on their back and elevate their feet with something. Either remove or loosen the victims clothing Cool them by fanning and applying cold packs (putting a cloth between the pack and the victim's skin) or wet towels or sheets. Care for shock. Give the victim one-half glassful of water to drink every 15 minutes, if they can tolerate it. These first aid steps should bring improvement within a half hour.
Heat Stroke High body temperature (106 F or higher). Hot, dry skin. Rapid and strong pulse. Possible unconsciousness Heat stroke is a life-threatening situation. Call 911. Get the person out of the heat and into a cooler place. Cool the victim fast. Immerse them in a cool bath, or wrap the wet sheets around their body and fan it. Care for shock by laying the victim on their back and elevate the feet with something Wait for medical help to arrive. Also do not give anything by the mouth.

The most susceptible people to the above heat disorders are the very young, very old, chronically ill, overweight, those who work in hot places, and athletes. Studies indicate that, other things being equal, the severity of heat disorders tends to increase with age. Heat cramps in a 17-year old may be heat exhaustion in someone 40, and heat stroke in a person over 60.

The Heat Index:

This index is used to alert the public how hot it really feels when the Relative Humidity is added to the actual air temperature. These values were devised for shady, light wind conditions.

Table-3 Heat Index (or Apparent Temperature) Chart


Heat Index


Relative Humidity (%)


40 45 50 55 60 65 70 75 80 85 90 95 100
A 110 136


i 108 130 137


r 106 124 130 137


104 119 124 131 137


T 102 114 119 124 130 137


e 100 109 114 118 124 129 136


m 98 105 109 113 117 123 128 134


p 96 101 104 108 112 116 121 126 132


e 94 97 100 103 106 110 114 119 124 129 136


r 92 94 96 99 101 105 108 112 116 121 126 131

a 90 91 93 95 97 100 103 103 109 113 117 122 127 132
t 88 88 89 91 93 95 98 100 103 106 110 113 117 121
u 86 85 87 88 89 91 93 95 97 100 102 105 108 112
r 84 83 84 85 86 88 89 90 92 94 96 98 100 103
e 82 81 82 83 84 84 85 86 88 89 90 91 93 95
(°F) 80 80 80 81 81 82 82 83 84 84 85 86 86 87

With Prolonged Exposure and/or Physical Activity
Extreme Danger Danger Extreme Caution Caution
Heat stroke or sunstroke highly likely Sunstroke, muscle cramps, and/or heat exhaustion likely Sunstroke, muscle cramps, and/or heat exhaustion possible Fatigue possible


*Editor's note: 7/11/13
I wrote the above article in the late 1990s. At the time, 1964 looked to be the longest streak BUT an 89 degree high occurred at DET City Arpt during the hot stretch (checked DET to DTW), In 1964, DET WAS the official site...so it can't be used...DTW Metro Arpt became the official site in April 1966. Funny what a problem a digit can cause (and it WAS 90 at DTW so it was hot anyway)!

The 1953 hot and miserable streak IS the longest heatwave with the Grand Daddy of all Heatwaves in Detroit in 1936 with the hottest and most miserable streak of days above 100 degrees. The all time hottest day at Detroit though was 105 back on July 24th, 1934. Back in the hot summer of 1988 we almost tied that with a 104 on June 25th 1988!

Before I retired, I went over all of Detroit's records and caught a few other mistakes... some back to the 1800s. Detroit's observation site moved several times in its history.

Making weather fun while we all learn,
Bill Deedler -SEMI_WeatherHistorian