Jul 4, 2020

THE "GRAND DADDY" OF SOUTHEAST MICHIGAN HEAT WAVES AND OTHER HEATWAVES

In the midst of a summer heatwave; I thought it imperative to put our present heatwave in perspective and compare to other notable heatwaves in Southeast Lower Michigan's past.  Several 90+ days are expected this week /4th-10th anyway/. There are some subtle signs of a possible break next weekend.


THE "GRAND DADDY" OF SOUTHEAST MICHIGAN HEAT WAVES 

                                                        July 8th - July 14th, 1936

 (originally written in the late 1990s with updates 2013/2020)

Written by: William R. Deedler, Weather Historian 
 
Though heat waves or hot spells generally occur nearly every summer, no heat wave compares in intensity nor in duration than the heat wave that occurred across Southeast Lower Michigan in the summer of 1936. For many of us, it was when our grandparents were in their young or middle-age adult years. Little, if any, exaggeration would accompany their tales of the oppressive heat experienced sixty years ago, back in July 1936.

The last week of June into the first week of July 1936 was quite variable with afternoon highs ranging from around 70 to near 90. Evidently, weather patterns were quite progressive. After a day or two of heat build up, a cold front would push through the area and sweep the heat to the south and east on a regular basis. A change in the weather pattern was heralded by a strong but dry warm front that pushed across the area midday on July 6th. Very warm air rushed north into Southeast Lower Michigan, causing the mercury to rise up to near 90 on the 7th, but this was merely a hint of the heat to come.

On the afternoon of the 8th, the temperature soared to just shy of 105 (104.4) degrees and thus, the unprecedented heat was on. For the next seven consecutive days, the mercury would "bubble" above the 100 degree mark (see Table 1). The oppressive heat was compounded by humidity levels generally ranging in the 30s and 40s during the afternoon hours. While those levels are relatively low any other time, when combined with temperatures 100+, the heat index or, how hot it really felt, ranged roughly from 110 to 130 degrees. Little, if any relief was found during the evening hours into midnight with temperatures ranging from the mid and upper 90s at the start (6 to 7 pm) to hovering still in the mid 80s at midnight. For a few hours before dawn, overnight low temperatures "cooled" into the mid 70s. Desert-like conditions were exaggerated by the non-existence of rain. The thirst of the parched land was left un-quenched as not one drop of rain was officially recorded at the Detroit downtown office through the period.

Since this was 1936, the residents of Southeast Lower Michigan did not have the luxury of air conditioned homes, businesses or shopping malls to take refuge from the heat. Most people had to make do with the old standbys such as fans, blocks of ice from the Ice Man (the Ice Man cometh') or maybe by just taking a swim. While other heat waves in Southeast Lower Michigan have lasted longer, none had been longer accompanied by the fierce heat of this one. I was unable to find any documentation of heat related deaths (I'm not sure it was even done at this time), but with this intense of a heat wave, I'm sure there were cases.

The break in this torturous heat wave came without fanfare (storms). Not even a shower was noted in the log. Looking at the observations on the 14th...the wind shifted from the southwest to the northwest and then to the northeast. A lot of the characteristics of a "backdoor" cold front pushing south- southwest out of southern Canada. Occasionally these fronts will come through dry with an abrupt wind shift and falling temperatures. The temperatures fell from 104 at 200 pm...to 85 at 400 pm to a relatively chilly 69 by midnight. The heat wave started with a 104 degree reading on the 8th and ended with the same on the 14th. The first drop of rain was long in coming and not observed until a measly .08 fell on the 23rd.
 
Table-1 - Summary of the daily highs, lows and resultant means
-------   for July 8th - 14th, 1936 in Detroit, Michigan.
         
           Date          High      Low       Mean
                       
         July  8th       104 *      72        88
                  
         July  9th       102        75        89
                                    
         July 10th       102        77        90 **
                                    
         July 11th       101        77        89 
                                    
         July 12th       100        76        88 
                                    
         July 13th       102        73        88
                                    
         July 14th       104        69        87
                                                        
              *  Second highest all time temp 
              ** Second highest all time mean

Another, very notable heat wave that baked the area for a longer period of time but was not quite as hot, occurred in the late summer of 1953 from August 26th - September 3rd. An eleven day string 90 degrees or better, cooked the area. What's worse, nine of those days were 95 degrees or higher, with two of those hitting the century mark. Those two 100 degree days occurred near the end of the heat wave on September 2nd and 3rd, and with the exception of one other day, were the latest 100 degree days ever reported in Detroit (the latest 100 was also back in the "dust bowl" 1930s, on September 15th, 1939). Still another heat wave, in the Summer of '64, was one day longer (12) than the one in 1953 and has the "honor" of the longest heat wave on record when looking at just consecutive days of 90 degrees or greater. This heat wave extended from July 17th - 28th, 1964. There were no 100 degree days during this period, with the highest temperature being "only" 95.

On a more recent note and better in the memory of Southeast Lower Michiganders, is the hot summer of 1988, when a record amount of 90 degree or better days, 39 to be exact, produced one hot, sultry summer. The previous record was 36 days which again, occurred in "dust bowl 30s" (1934) when also, the hottest temperature of all time, (105 July 24th, 1934), occurred in Detroit. In addition to the record amount of 90 degree days in 1988, we topped the 100 mark 5 times, with the highest at 104 on June 25th. We missed the all time high by just a degree, but for those who remember, a hot, desert-like wind blew across the area that day as dew points dropped into the lower 60s, and humidities fell into the 20s.

That memorable summer of '88 became the seventh hottest summer (Jun-Aug) ever recorded in Detroit with a average of 74.2 (see updated listings below). The fourth hottest summer goes to 1955, with an average of 74.4 degrees. During that hot summer, the month of July set the record for days of 90 degrees or greater in a month with 17. This was the primary reason why July 1955 became second hottest month ever in Detroit, with a average temperature of 79.1. Last July (2012) superseded that temperatures with 79.3 for Detroit's hottest July. We now come to our hottest summers, at least in the last 142 years (1870). The "gold" medals goes to 1995 and again,  just last year in 2012! That's right, just last year during the 3 month summer period (Jun-Aug), Detroit averaged 74.5 degrees helped tremendously by the hottest July. Strangely enough though, back in July 1995 that July didn't even place in the top 10 hottest months. The hot month in the Summer of '95 was August, with an average temperature of 77.1, making it the hottest August on record. June 1995 placed in at the eleventh hottest.

Here is the updated top  20 Hottest/Coldest Summers on record at Detroit, Flint and Saginaw. Several of our recent summers have entered the record books for heat and changed previous rankings, especially at Detroit.

Top 20 Coldest/Warmest Summers in Southeast Lower Michigan /through 2019/

RankDetroit Area* Flint Bishop** Saginaw Area***
Coldest Warmest Coldest Warmest Coldest Warmest
Temp Year Temp Year Temp Year Temp Year Temp Year Temp Year
1 66.5 1915 74.9 2016 65.4 1992 74.2 1933 64.8 1915 73.0 1931
2 67.0 1992 74.8 2012 66.1 2009 74.0 1934 65.1 1992 72.9 1933
3 67.3 1927 74.8 2005 66.2 1958 73.8 2016 65.5 1982 72.5 1955
4 67.5 1875 74.5 1995 66.3 1960 72.7 1936 65.8 1945 72.3 1995
5 67.6 1903 74.5 1955 66.5 1969 72.6 1939 65.9 1950 72.1 1930
6 67.8 1985 74.4 2018 66.6 2004 72.6 1931 65.9 1924 72.1 1921
7 67.9 1912 74.4 2011 66.7 1985 72.6 1921 66.1 1985 72.0 2012
8 67.9 1907 74.4 2010 66.8 1972 72.3 2010 66.4 2009 72.0 2010
9 68.1 1982 74.2 1988 66.8 1967 72.3 1949 66.4 2004 72.0 1937
10 68.2 1972 74.0 1933 66.9 1962 72.2 1955 66.4 1979 71.9 1988
11 68.3 1979 73.8 1949 66.9 1927 72.0 1935 66.5 1977 71.9 1936
12 68.3 1902 73.7 1921 67.0 1982 71.9 2011 66.6 1951 71.8 2016
13 68.3 1891 73.6 1952 67.0 1950 71.9 1938 66.8 1946 71.7 1998
14 68.4 1889 73.5 1991 67.1 1965 71.8 1988 66.9 1965 71.5 1934
15 68.5 1883 73.5 1959 67.1 1945 71.7 2012 66.9 1962 71.5 2018
16 68.7 1917 73.5 2002 67.2 1997 71.7 1995 66.9 1917 71.5 1932
17 68.8 1924 73.5 1931 67.4 1951 71.7 2002 67.0 1958 71.4 2011
18 68.8 1904 73.2 1944 67.4 1957 71.7 1987 67.0 1926 71.4 1959
19 68.9 1967 73.0 1987 67.4 1924 71.6 2005 67.2 1972 71.2 1973
20 69.1 1897 73.0 1919 67.5 2000 71.6 1983 67.3 1981 71.2 1949


The Deadly Summer Heat

Written by: Jeff Boyne - National Weather Service La Crosse Wi
 
In a normal summer, about a 175 Americans die as a result of the taxing effect that excessive heat and humidity can have on the body. In a disastrous heat wave of 1980 more than 1,250 people died in St. Louis, Missouri. Just last summer, Chicago experienced its worst weather-related disaster with 465 heat related deaths recorded during the period from July 11-27.

How Heat and Humidity Affects the Body:

The human body gets rid of excessive heat (above 98.6 F) by increasing the rate of the blood circulation. This causes the blood vessels to expand to accommodate the increased flow. The tiny blood capillaries in the upper layers of the skin are also put into operation. By doing this, the blood is able to circulate closer to the skin's surface and the excess heat in the body is able to be dispensed into the cooler atmosphere surrounding the body.

At the same time, water diffuses through the skin from the sweat glands in the form of perspiration. Sweating, by itself, does nothing to cool the body. Evaporation of the perspiration must take place in order for the process of sweating to be of any use. When perspiration evaporates, it takes some of the excess heat away from the body; thus, the body is cooled.

If high humidity accompanies the hot temperatures, the body will have a very hard time cooling itself down, because the perspiration on the skin will not evaporate off of the skin. As a result, the body will continue to try to cool itself down by sweating. This will not only cause the body to lose water, but it will also lose salt. If the body cannot cool itself down or if it loses too much salt, one of the following three heat disorders will result in the table-2 below.

Table-2 3 Types of Heat Disorders
HEAT DISORDER SYMPTOMS FIRST AID
Heat Cramps Painful spasms usually in the muscles of the legs and abdomen. Heavy sweating. Get the person to a cooler place. If the victim has no other injuries and can tolerate water, give one- glassful every 15 minutes for an hour.
Heat Exhaustion Heavy sweating, weakness, skin cold, pale and clammy. Pulse thready. Normal temperature possible. Fainting and vomiting. Get the person out of the heat and and into a cooler place. Have them lie down on their back and elevate their feet with something. Either remove or loosen the victims clothing Cool them by fanning and applying cold packs (putting a cloth between the pack and the victim's skin) or wet towels or sheets. Care for shock. Give the victim one-half glassful of water to drink every 15 minutes, if they can tolerate it. These first aid steps should bring improvement within a half hour.
Heat Stroke High body temperature (106 F or higher). Hot, dry skin. Rapid and strong pulse. Possible unconsciousness Heat stroke is a life-threatening situation. Call 911. Get the person out of the heat and into a cooler place. Cool the victim fast. Immerse them in a cool bath, or wrap the wet sheets around their body and fan it. Care for shock by laying the victim on their back and elevate the feet with something Wait for medical help to arrive. Also do not give anything by the mouth.

The most susceptible people to the above heat disorders are the very young, very old, chronically ill, overweight, those who work in hot places, and athletes. Studies indicate that, other things being equal, the severity of heat disorders tends to increase with age. Heat cramps in a 17-year old may be heat exhaustion in someone 40, and heat stroke in a person over 60.

The Heat Index:

This index is used to alert the public how hot it really feels when the Relative Humidity is added to the actual air temperature. These values were devised for shady, light wind conditions.

Table-3 Heat Index (or Apparent Temperature) Chart


Heat Index


Relative Humidity (%)


40 45 50 55 60 65 70 75 80 85 90 95 100
A 110 136


i 108 130 137


r 106 124 130 137


104 119 124 131 137


T 102 114 119 124 130 137


e 100 109 114 118 124 129 136


m 98 105 109 113 117 123 128 134


p 96 101 104 108 112 116 121 126 132


e 94 97 100 103 106 110 114 119 124 129 136


r 92 94 96 99 101 105 108 112 116 121 126 131

a 90 91 93 95 97 100 103 103 109 113 117 122 127 132
t 88 88 89 91 93 95 98 100 103 106 110 113 117 121
u 86 85 87 88 89 91 93 95 97 100 102 105 108 112
r 84 83 84 85 86 88 89 90 92 94 96 98 100 103
e 82 81 82 83 84 84 85 86 88 89 90 91 93 95
(°F) 80 80 80 81 81 82 82 83 84 84 85 86 86 87

With Prolonged Exposure and/or Physical Activity
Extreme Danger Danger Extreme Caution Caution
Heat stroke or sunstroke highly likely Sunstroke, muscle cramps, and/or heat exhaustion likely Sunstroke, muscle cramps, and/or heat exhaustion possible Fatigue possible


*Editor's note: 7/11/13
I wrote the above article in the late 1990s. At the time, 1964 looked to be the longest streak BUT an 89 degree high occurred at DET City Arpt during the hot stretch (checked DET to DTW), In 1964, DET WAS the official site...so it can't be used...DTW Metro Arpt became the official site in April 1966. Funny what a problem a digit can cause (and it WAS 90 at DTW so it was hot anyway)!

The 1953 hot and miserable streak IS the longest heatwave with the Grand Daddy of all Heatwaves in Detroit in 1936 with the hottest and most miserable streak of days above 100 degrees. The all time hottest day at Detroit though was 105 back on July 24th, 1934. Back in the hot summer of 1988 we almost tied that with a 104 on June 25th 1988!

Before I retired, I went over all of Detroit's records and caught a few other mistakes... some back to the 1800s. Detroit's observation site moved several times in its history.

Making weather fun while we all learn,
Bill Deedler -SEMI_WeatherHistorian

Jun 18, 2020

Summer 2020 Outlook - Analogues and Upper Air Patterns Suggest a Changeable Summer

One thing that the trend has been since this spring has been warm-ups only to be squashed by impressive cool snaps, even into the summer. So is this the pattern for the entire summer?


Spring Upper Air Pattern


Basically the upper pattern supported both warm and cold trends leading to  normal spring temperatures. A strong upper Low and troughing routinely dug southward through central Canada and into the Great Lakes as mentioned in the previous spring write-up. This pattern shifted east with time allowing a trough to settle into the western half of the country and thus; warmer conditions progressed into the Lakes region as high pressure ridging took a hold of the area. The upper 500 MB pattern this spring continues albeit weaker with the advent of summer.


The latest view of the upper winds and the anomaly from mid March thru mid June continues to show the strength of the upper low and cool pocket over Canada.


Summer 2020 into September

Temperatures
Normal

Normal with notable swings at times for the summer period. Look for periods of above normal temperatures and below normal with sometimes exaggerated departures. One eye on the present upper air pattern and they other on the analogues do in fact suggest a continuation of our spring pattern. Yes, even with heatwaves (temps around 90 and above); still both prevailing patterns suggest there will be notable reprieves from the hot spells with refreshing cool air masses surging out of Canada.
 
In the end; I look for summer temperature departures to average -1.2 below to 1.8 degrees above across Southeast Lower Michigan in keeping with upper air patterns and analogues.The more dominant upper air pattern will dictate the summer departure in the end 

Precipitation 
Above Normal to Below Normal (a wide range)

This is a tricky one as even with summer's below normal -to normal- or even above normal already in place; there is a significant trends for drier patterns in place. Thus far; June has been drier than average (up to an inch or two) over southern areas of Southeast Lower Michigan, while normal or even above in the far northern suburbs into Flint and Port Huron to the Saginaw Valley and Thumb.

It seems that above normal to below normal rainfall again seems the most realistic as with many of our summers.

Analogues Data

Temperatures

When just looking at the analogues; right off the bat, it looks like cool weather relative to normal is precedent in the data. While cooler summers were slightly more dominant /8/, there still were six normal summers and even a warm summer...so basically 8 to 7 cool to normal/warm. A mixed result and with the pattern we've seen the the past few months; this clearly is understandable and almost a given when we review our upper pattern. The variable temperature forecast seems most suitable given guidance and pattern - ending within the normal range. Analogue departures on the whole, seem too cool for the summer.


Precipitation

What about rainfall? Projected summer patterns are just as important for precipitation as they are for temperatures; especially if a gardener or farmer.

Again while somewhat mixed; there is a definite lean toward a drier summer on the analogues especially southern areas while models are mixed. Still; there is enough variation that; like temperatures, precipitation trends also showed four wet summers; four normal rainfall summers against the seven drier summers.

Even more to the point is where and when the likelihood of a dry spell or two was to occur and while data suggests there was enough variability to be anytime, the precedence was during early to mid summer.

Maps


Upper Air Variations

The upper 500 MB pattern this spring continues albeit weaker with the advent of summer. Note; the 500 MB pattern trend variations in an example of recent guidance for the remainder of June fits well with what's intimated by analogues for the summer; a rather aggressive jet.


Severe Weather

Keeping in mind the contrasting patterns would also suggest bouts of severe weather - mainly depending on timing and available instability.


Model Views for summer temperatures and rainfall

 /CFSv2/


Other World-Wide models combined


Look for other notable weather write-ups and trends through the summer if conditions warrant.

Making weather fun while we all learn,
Bill Deedler -SEMI_WeatherHistorian


Jun 11, 2020

The Strange, Mixed-Up Autumn - Winter - Spring of 2019-20

What can you say about the Winter of 2019-20 and  Spring of 2019; wacky! It came on gangbusters in November with the earliest and most snow in a storm ( heavy snowstorm on Veteran's Day).  While there have been a few earlier, heavy snowstorms (closest; Nov 15-16th,1932 with 9.0"; Nov 2-3 in 1966 with 6.0" and in 1951 with 5.6") but none up to November 11-12th have been as high as the 9.2" last autumn. Also; Flint tied for the 3rd biggest November winter storm with 9.0 inches of snow.  The biggest November storm for Flint dumped 13.4 inches on November 6-7, 1951. Saginaw's snowfall was much less at 4.0" on 11th and not nearly a potential candidate with 11.3" falling back on Nov 2-3, 1966.

Maybe not surprising; exceptionally cold November weather also occurred with the 13th coldest /35.8/ November on record at Detroit, 9th coldest /34.6/ at Flint and 4th coldest /33.3/ at Saginaw.

From the NWS - DTX More on the storm of Nov 11-12th

During the early morning period of November 11th, a surface low pressure began to develop over the Ohio Valley tied to a stationary boundary over that region.  Snow started to move into SE MI from the west shortly after 3am with the bulk of the region seeing snow falling by 4am. The initial part of the storm had 3 distinct heavier snow bands develop across our region that would begin to collapse together to form one distinct very heavy band by the noon/early afternoon time-frame. This band had 1" per hour snowfall rates over the western and northern Metro areas leading to the high totals seen across Washtenaw, Oakland, and Macomb counties. It would slowly move and pivot east across Detroit and the southern Metro area later in the afternoon as the low began to move east into Pennsylvania. While all this occurred, northerly flow off of Lake Huron allowed for lake-enhanced snowfall rates over the Thumb, especially over areas on the northern and eastern shorelines with some locations seeing over a foot of snow.


In spite of November's aggressive cold and snow introduction to the cold season; the Winter of 2019-20 ended up high on the list as a warmer than normal winter (see top 20 coldest/warmest summers rankings below). Detroit attained 9th warmest winter status since 1874 with a 32.6 degree average. Flint ranked even higher with 5th warmest winter with a 31.5 average and Saginaw made the warmest list at 7th place with a 29.8 average.


Winter Temps and Precipitation Maps


Temps


Precip


Snow Season 2019-20


Top 20 Coldest/Warmest Winters in Southeast Lower Michigan
Rank Detroit Area* Flint Bishop** Saginaw Area***
Coldest Warmest Coldest Warmest Coldest Warmest
Temp Year Temp Year Temp Year Temp Year Temp Year Temp Year
1 18.8 1903-1904 36.9 1881-1882 16.7 1976-1977 33.4 1931-1932 15.7 1962-1963 33.3 1931-1932
2 19.3 1874-1875 35.7 1931-1932 17.0 1962-1963 33.0 2015-2016 16.5 1917-1918 31.7 2015-2016
3 19.7 1976-1977 35.2 1889-1890 17.8 1958-1959 32.2 1982-1983 16.6 1919-1920 30.9 1997-1998
4 19.7 1917-1918 33.8 2001-2002 18.6 1978-1979 31.7 2001-2002 17.5 1978-1979 30.6 2011-2012
5 20.4 1962-1963 33.8 1997-1998 19.0 2013-2014 31.5 2019-2020 18.0 1977-1978 30.5 2001-2002
6 20.6 1977-1978 33.5 2015-2016 19.3 1977-1978 31.3 1997-1998 18.2 1976-1977 30.0 1936-1937
7 20.8 1919-1920 33.0 2011-2012 19.8 1993-1994 31.2 2011-2012 18.2 2013-2014 29.8 2019-2020
8 20.9 2013-2014 32.9 2016-2017 19.9 1944-1945 30.3 1932-1933 18.2 1958-1959 29.6 1982-1983
9 21.0 1935-1936 32.6 2019-2020 20.9 1981-1982 30.2 2016-2017 18.7 1935-1936 29.5 1920-1921
10 21.1 1892-1893 32.5 1982-1983 21.2 1935-1936 29.1 1952-1953 19.0 1993-1994 29.4 2016-2017
11 21.4 1904-1905 32.5 1879-1880 21.3 1969-1970 28.8 1936-1937 19.2 1916-1917 29.0 1918-1919
12 21.5 1978-1979 32.3 1918-1919 21.4 1985-1986 28.6 1948-1949 20.0 1961-1962 28.8 1932-1933
13 21.7 1880-1881 32.2 1952-1953 21.5 1961-1962 28.5 2012-2013 20.1 1944-1945 28.5 2012-2013
14 21.8 1911-1912 31.6 1877-1878 21.6 2008-2009 28.3 1930-1931 20.2 1969-1970 28.3 1952-1953
15 21.8 1878-1879 31.3 1948-1949 21.6 1983-1984 28.2 1991-1992 20.3 1981-1982 28.0 1930-1931
16 21.9 1981-1982 31.2 1920-1921 21.6 1947-1948 28.2 1949-1950 20.7 1947-1948 27.8 1974-1975
17 22.4 1969-1970 31.1 1875-1876 22.0 2014-2015 28.1 1974-1975 21.2 2008-2009 27.6 1948-1949
18 23.0 1958-1959 31.0 1953-1954 22.2 2010-2011 28.0 1953-1954 21.3 2002-2003 27.2 1998-1999
19 23.2 1876-1877 30.8 1949-1950 22.4 1942-1943 27.8 1998-1999 21.4 1942-1943 27.1 1986-1987
20 23.3 2014-2015 30.7 2012-2013 22.5 2002-2003 27.7 1986-1987 21.6 1985-1986 27.1 1953-1954
* Detroit Area temperature records date back to November 1874.
** Flint Bishop temperature records date back to January 1921.
*** Saginaw Area temperature records date back to January 1912.


 Winter 2019-20 Monthly Data


December 2019 
Winter took a holiday in December (the actual first winter month) with very mild temperatures and below to well below normal snowfall. December exchanged the Snowiest list to the Snowless list with Detroit 18th warmest with 35.1 degrees and 2.7" snowfall ( just missing 20th snowless at 2.6"). Keep in mind this was less than a degree colder than November's average of  35.8. More notable average temperature placements occurred further north with Flint placing 7th warmest December with 34.2 (as compared to November's 34.6)  and 7.0" of snow. Saginaw placed 12th warmest with 32.5 (compared to November's 33.3) and received 5.8" of snow.


January 2020  

January brought a mix of both mild January conditions yet normal to slightly above normal snow. Average temperatures ranged in the lower 30s; several degrees above the normals in the lower to mid 20s across Southeast Lower Michigan. Detroit's 32.4 degree average made it the 12th warmest January since records began with close to normal snow falling at 11.0". Flint's 32.0 average temperature placed it significantly further up the scale at the 4th warmest January on record. In addition; Flint's snowfall total of 16.8" pushed it into the January Snowiest List at 20th. Finally; the 30.4 degree reading at Saginaw  placed it at 5th warmest with normal snow at 11.0".


Jan 17-18, 2020 storm

Snow quickly moved in during the late evening on Friday, January 17, 2020 as a strong low pressure system moved in from the Midwest and across the Great Lakes region.   This strong system brought numerous advisories and warnings to the Midwest and Great Lakes.  The majority of the snow fell overnight and into the morning hours on Saturday before tapering off and transitioning to rain showers and drizzle over some parts of Southeast Michigan.  Snow, rain and sleet were all seen over the course of the later morning into early Saturday morning.  With the amount of moisture that was available with this system,  the characteristic of this snow was heavy and wet, making shoveling rather difficult.  During the heaviest snow, snowfall rates were 1+ inches per hour leading to many locations seeing 5 to 7 inches of total snow.


February 2020

Late winter remained generally mild yet with above normal snow. Temperatures averaged  30.1 at Detroit still 2.0 degrees above normal along with slightly above normal snow with 14.1". Flint averaged better than three degrees above normal in February with 28.0/+3.2 but with a hefty 18.8" of snow to boot creating the 12th snowiest February at Flint. Saginaw averaged 26.4 degrees with about normal snow at 10.7"


Feb 26th storm

A low pressure system formed out over the Southern Plains and moved northeast over the Ohio River Valley bringing snow to Southeast Michigan on February 26th.  This longer duration snow allowed for a Winter Weather Advisory to be issued, with the main bulk of the snow falling during the afternoon hours on Wednesday.  Snow continued to linger around through the overnight hours into early Thursday as the deformation zone (the northeast portion of the low pressure system) slowly pushed off to the east.  Snowfall totals averaged around two to six inches across much of the area.  Lesser snowfall totals were seen up in the Saginaw/Tri-Cities area, with higher amounts to the south. 


November Through March Cold Season

An example of the cold season can be seen with Detroit's average temperatures and departures from November 2019 through March 2020. As you can see it basically wasn't too cold with November through March averaging 34.9 degrees or 2.4 above normal. The sharply colder month of November belied the remainder of the season with every month after; notably above normal.


Detroit Cold Season Nov - Mar   2019-20


NOV DEC JAN FEB MAR SEAS


Ave Temp 35.8 35.1 32.4 30.1 41.2 34.9
Depart -5.7 5.0 6.8 2.0 4.0 2.4


Winter Analogues fail on projected warmth but perform on erratic expectations along with cold periods in the spring.

"Temperatures - Normal to Below"

"As with the majority of winters especially ENSO Neutral; look for temperatures during the 2019-2020 winter to be quite changeable under a fluctuating jet stream. The ongoing pattern recently experienced this fall was also telegraphed for the Winter for 2018-19. In fact; the similar cold and snowy weather experienced last November has even more aggressively repeated this November.

In my research; I’ve found Neutral ENSO patterns in the Pacific generally have little effect on the weather patterns in the Great lakes and Southeast Lower Michigan. This winter's analogues are strongly suggesting normal to below normal temperatures this winter with the clear majority pointing in that direction". 

There were two main problems with the guidance which lead to the analogues and subsequent Outlook


First and I feel most important; the upper polar low remained pretty much anchored most of the time up over the Arctic circle. This resulted in a very intense, at times near to record intense Polar Vortex contracted over the Arctic circle. This resulted in a +NAO/+AO which typically results in milder winter conditions for the Lakes as prevailing westerlies keep the door on the refrigerator mainly closed. 

Second; the ENSO neutral prediction failed to materialize until just recently in late spring into early summer. Therefore; strongly aided with the contracted Polar Vortex; the atmosphere continued to behave as though an El Nino was on-going through the winter. 

The two complimenting factors supported an unusually mild winter placing all three cities in the top 10 record warmest list (noted above in the Top 20 list).


An excellent write-up regarding the Bottled-up Winter 2019-20 Polar Vortex can be found here. The following discussion by Mark Vogan explains well the

"A record strong stratospheric polar vortex has brought probably the coldest Arctic winter in over a decade and so it should be of no surprise that Arctic sea ice cover has reached a 10-year high with the greatest coverage since 2010".

The cold/strong vortex has been mirrored from stratosphere down through the troposphere supporting a strong and persistent +AO/+NAO setup which hosts low pressure within the polar region and a strong zonal jet stream running west to east underneath. A strong zonal jet protects the mid-latitudes from polar air".

Come later spring; the Polar vortex "let loose" so to speak bringing record cold in May to the region (more on May 2020, below).


Spring 2020 Temps and Precipitation Maps

Spring 2020 


Why did is get so cold toward the end of spring?


Though the calendar said March (and the climate season announced spring); the weather fell into a more, strong warm/cold pattern with snow right into May.  As stated; the unusually deep and record cold Upper Low pressure hovered over the Polar region most of the winter. During the mid-late spring, the Polar Vortex began to disintegrate, break apart and drift south into the Northern Hemisphere especially into North America and Eurasia. This brought the usually cold pockets of air further south into the Great Lakes into the East and occasionally the South mid and especially later spring.

Ironically; March (and spring) actually began on a good note, only to be set back several weeks occasionally in April and especially the first half of early May. March's weather averaged notably above normal in temperatures and notably below in the snowfall. With Detroit's average temperature at 41.2/+4.0 and just 1.8" of snow of the March normal 6.9" brought hopes of an early, sustainable spring.

Unfortunately; the remnants of the Arctic air mass began to surge south into the Great Lakes during April into first half of May.  While April leaned toward the cooler side (basically averaging a degree or two below normal) a cool trend is not that uncommon in the Lakes early spring.

May started out warm enough but that was short-lived as most of early-mid May was a completely another story! Remnants of the Arctic air wrapped up in the weakening Polar Vortex over Canada pushed south into the northern U.S. Record breaking cold slammed the Lakes Region and ultimately engulfed a large portion of the country east of the Rockies by the second weekend.


Records were established with record lows at both Detroit and Flint. Detroit's record low of 27 on the 9th was not only a record for the date but the 3rd coldest May temperature ever recorded. The 27 degree reading is shared with another low of  27 on May 7th, 1974. The second coldest temperature in May occurred on May 1st, 1978 with 26. The coldest May temperature ever recorded in Detroit; 25 degrees back on May 10th, 1966.

The staying power of the abnormal May cold in Southeast Lower Michigan was no better represented than at Flint. Flint chalked up THREE CONSECUTIVE record lows for this May. A low of  29 on the 11th, 27 on the 12th and 25 on the 13th. The 27 and 25 degree lows were the coldest so late in May and season. The coldest temperature ever recorded in Flint occurred on the same day as Detroit's - with a 22 degree winter-like reading also on May 10th, 1966.

May 2020 Snow

Snow records were established in a few categories at Detroit; one for amount and the other for stretch of days with snow observed! First off; Detroit recorded a half inch /0.5"/ of snow on the 10th. That  0.5" of snow was the fourth latest day measurable snow was observed. The third latest was on May 13th 1912 with 1.5" and the second and first actually occurred in one snowstorm over two days. These two outstanding records for amount and lateness were; 2.3" of snow fell late on May 21st, 1883 with another 2.7" falling after midnight into the morning of May 22nd, 1883. The snowstorm total of 5.0" was the latest and highest amount of snow in a snow season! The latest snow has ever been observed in Detroit occurred way back on May 31st, 1910 with a trace.


Arguably; a record even harder to break was having snow recorded on several days in a May. That only occurred once, back in 1954 when four days had snowfall that is; until this May when FIVE consecutive snow days were observed May 8th - 12th!

A "heat-wave" of sorts later in the month erased much of cold snap negative monthly departures of 5 to 6 below normal to just a couple of degrees below to even above normal. Detroit's May average temperatures of 57.7 came in 2 degrees below normal (and actually colder than Flint's average; a rare bird indeed). Flint's temperature came in  above normal with 58.5 or 1.4 degrees above normal. Saginaw averaged slightly below normal with 58.5 or -0.9.

It was a generally wet spring with most areas seeing an inch or two above normal. 

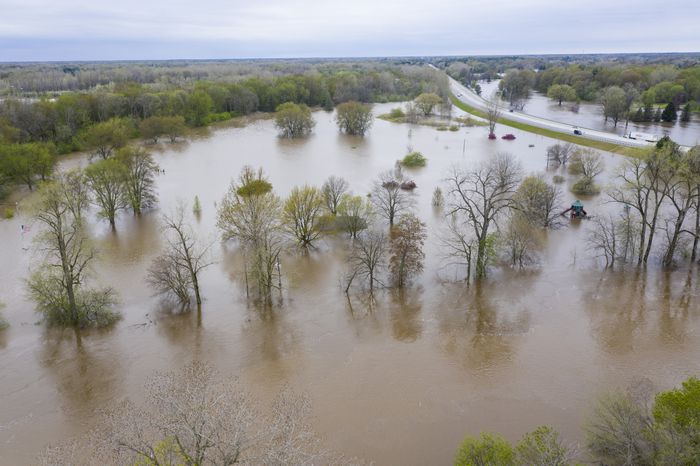
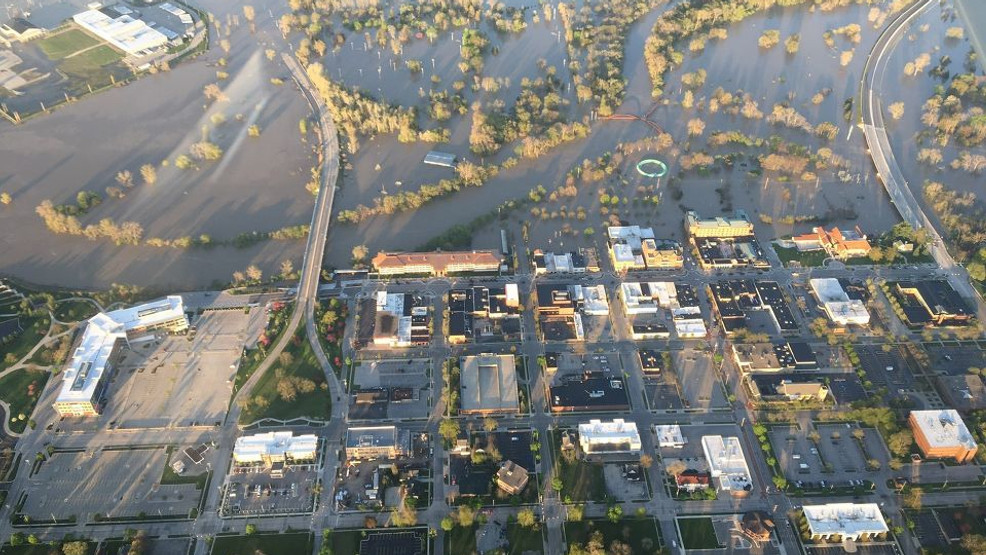
Heavy rains brought scattered flooding across Southeast Lower Michigan in May. The most horrendous damage occurred in a damn failure on May 17-20th in Midland County along the Tittabawassee river after a heavy rain event.
(pics)

Midland_KaytieBoomer_MLive2
Downtown Midland NBC 25 News  Midland Road Flooding


Brief Summer Outlook & Analogues will be out shortly.

Making weather fun while we all learn,
Bill Deedler -SEMI_WeatherHistorian