Jun 2, 2013

After Several Hot Summers; Finally a More Comfortable Summer in 2013?
Do Recent Atmospheric Conditions Foretell Our Summer?

The past three summer's across Southeast Lower Michigan have been bears at times for heat and misery. The Summer of 2012 was not only hot it was rather dry early in the season and thus, it was a tough growing season where water was not readily available. Beneficial rains came too late and too much, especially north of I-69 where heavy rains led to the wettest August on record at Saginaw with 9.3"

                                                         Summer of 2012      

Detroit's Hottest Summer's

Rank
Average Temp.
Year
1
74.8
2012
2
74.8
2005
3
74.5
1995
4
74.5
1955
5/6
74.4
2010/11


So dry was the southern two thirds of Southeast Michigan (especially after a hot and dry July) that the drought index crept up into our back yard. The map below showed the rainfall needed to alleviate the parched conditions by early August, 2012.


As mentioned above, to add  insult to injury the dry landscape in 2012 was parched with blazing sun and heat. Actually, this heat occurred in both July 2011 and July 2012!

Average Temperature Records for July
Detroit
Rank Average Temp. Year
1 79.3 2011
2 79.0 1955, 2012, 1921
5 77.9 1916
6 77.7 1931
Flint
Rank
Average Temp.
Year
1 78.0 1921
2 77.7 1935
3 76.8 2011
4 76.7 1934
5 76.5 1955
6 76.1 2012
Tri-Cities
Rank
Average Temp.
Year
1 77.5 1921
2 76.8 1916
3 76.4 2012
4 76.1 2011, 1935


                                                        Summer of 2011 / 2010        

While cooler (not making the top ten hottest summers) at Flint and Saginaw, the Summer of 2011's temperature average equaled that of 2010 at Detroit. Note the temperature placement for all three cities for the Summer of 2011 and 2010. Keep in mind, this chart was done before the Summer of 2012..so it is not included. The Summer of 2010 was an all inclusive hot summer for all three cities under the Hottest Summers list at the time.

Top 20 Coldest/Warmest Summers in Southeast Lower Michigan
 
RankDetroit Area*Flint Bishop**Saginaw Area***
ColdestWarmestColdestWarmestColdestWarmest
TempYearTempYearTempYearTempYearTempYearTempYear
166.5191574.8200565.4199274.2193364.8191573.01933
267.0199274.5199566.1200974.0193465.1199273.01931
367.3192774.5195566.2195872.7193665.5198272.51955
467.5187574.42010/1166.3196072.6193965.8194572.31995
567.6190374.2198866.5196972.6193165.9195072.11930
667.8198574.0193366.6200472.6192165.9192472.11921
767.9191273.8194966.7198572.3201066.1198572.02010
867.9190773.7192166.8197272.3194966.4200972.01988
968.1198273.6195266.8196772.2195566.4200472.01937
1068.2197273.5199166.9196272.0193566.4197971.91936
1168.3197973.5195966.9192771.9193866.5197771.71998
1268.3190273.5200267.0198271.81988/1166.6195171.51934


Heaviest rains and storms these two summers /2011-2010/ held over the southern tier of Southeast Lower Michigan...mainly from Ann Arbor to Detroit and south to the Ohio border. This led to the second wettest July on record at Detroit with 7.66" in 2011.  Curiously, this is not unlike the Summer of 2010 when much of the severe weather and heavy rains also fell south of I-94.

So all this is of the past; what about the future...this summer?

ENSO Conditions are Basically Worthless in Helping Project This Summer's Pattern

Below is the Pacific Sea Surface Temperatures /SST/ projected by the Euro Model for the summer. The concentration of the projections lie in the black rounded rectangle; or immediately south of the 0C line.


The latest ENSO projections have "basically" flat-lined into the summer. Flat-lined meaning they are and are expected to continue nearly dead-on neutral /La Nada/ for the summer. It is difficult enough during the winter season to investigate and project a dominant influence solely based on this sort of pattern; but for the summer, forget La Nada. At least during the winter, other patterns such as the NAO, AO, PDO and PNA are better relied on but in the summer, these too are generally weak and more transitory.

So then; what hints of a summer pattern and forecast is Mom Nature suggesting for this summer?

Temperatures

Recent hemispheric patterns and analogue summers (discussion below) suggest to me a more comfortable summer than the past several. In fact, temperatures should average closer to normal or average between 1.0 degrees below normal to 1.5 degree above. While quite variable, temperature patterns for the summer hint the primary (or  likely) temperature pattern for the summer is above normal temperatures early to mid summer with a close secondary (chance) during mid to late summer.

Rainfall

Dominant trends past (previous analogues) and recent (past few months) suggest variability in rainfall trends. April was wet while May was dry relative to normal or average rainfall. While the majority of analogue summers lean toward the dry side; a minority were especially wet! More discussion follows in the analogue section.

We've already seen this wider range variability recently and it looks like it will continue. When speaking of summer's total rainfall; I look for a range of below normal to above normal given the present and past trends. Areas these will occur at this early juncture is very much a crapshoot and only if we go by the recent trends of the spring and subtle analogue trends; heaviest rainfall is intimated to be from the I-96/696 corridor northward through Flint, Port Huron, Saginaw and the Thumb Region. 

Hemispheric Patterns

As the summer ridge builds into the center part of the country, I look for it to oscillate over the Great Lakes and the East, routinely bringing warm to hot weather to the region. However; it should be duly noted that the distinct upper air pattern that has been a key player since mid winter into spring, albeit naturally weakening with time and becoming less frequent, shows no signs of leaving during the summer. I'm speaking of the occasional blocking across the northern latitudes in which I expect to play a distinctive role this summer.  By occasionally phasing with weaker mid continental impulses, troughing will dive into the Great Lakes and points east and thus, intermittently deliver enough cooler spells of weather to balance out somewhat, the heat and humidity we do get for a more normal and comfortable summer than the past several.

The ECHAM model below, in my opinion, has picked up on the expected pattern I see evolving based on our recent and analogue pattern. Here I use its projected two meter /surface temperature/ for the country this summer with my estimated upper wind /500 MB/ pressures and flow.

                                  Projected  Summer 2013 Temperatures /C/ & Suggested Upper Wind Pattern


Summer Analogues

As one can see; the analogue summers below represent variable La Nina conditions that transitioned to Neutral.
 
                                        2013 Summer Neutral Analogues (following variable intensities of La Ninas)

Note: years where the la Nina to neutral pattern occurred for the second time in two year
or so are denoted with a “2” following the year. Normals used 1971-2000 for related years.


Analogue Trends Seen

Temperatures
The Neutral analogue summers are really quite mixed on the temperature front this time which is hardly surprising given the hemispheric and SST environment. Even though Detroit’s summer data favors normal to below normal temperatures, one must closely compare this data to Flint and Saginaw. The reason being, the normals at Detroit were increased in the past few data sets (1971-2000 & also 1981-2010) due to mainly the effect of the local heat island that now encompasses the Detroit Metro Airport; whereas Flint and Saginaw saw little change in their normals. This would logically then, skew Detroit’s departure temperature data down somewhat. In any event; analogues suggest normal temperatures will prevail.

Rainfall and Severe Weather
Rainfall averaged decidedly below normal in the analogue set with about 75% below normal...a strong trend. However; the remaining years were very wet and while a minority of years, it still is an important subset of wet years! This suggests to me that the pattern portrayed in my hemispheric discussion could lead to a stalling of the frontal conflict and storminess and thus, runs the risk of repeating in the same general region. While analogues state drier summers prevailed; we still run the distinct risk of a stormier summer including training echoes if the pattern happens to stall in our neck of the woods. In conjunction with this kind of scenario; there is more likelihood of a wider range of rainfall amounts from below normal to above over Southeast Lower Michigan.

Look for continuing updates and discussions on the summer pattern throughout the summer.

Summer commences on June 21st, 2013 @ 104 AM EDT. Enjoy the Summer!

Making weather fun while we all learn,
Bill Deedler -SEMI_WeatherHistorian


May 7, 2013

Update 5/13/13 - Alerted Cold Snap Lives Up to Forecast Days Ago!

5/13/13
Projected cold snap first warned about back on the 7th certainly lived up to its hype and then some with some areas actually dropping into the mid 20s. This air mass was even cold enough to match Detroit's record low /30/ first attained in 1971...long before any heat island became established around the airport...impressive! Also; that 30 tied for the coldest so late in the season at Detroit. Note, lows this morning across Southeast Lower Michigan after a very chilly and brisk Mother's day (highs).

 
MORNING TEMPERATURE AND PRECIPITATION SUMMARY
NATIONAL WEATHER SERVICE DETROIT/PONTIAC MI
929 AM EDT MON MAY 13 2013

VALUES REPRESENT YESTERDAY`S HIGHS....LOW OVER THE LAST 12 HOURS
AND PRECIPITATION OVER THE LAST 24 HOURS ENDING AT 8 AM EDT


.BR DTX  0513  ES DH00/TAIRZX/DH07/TAIRZP/TA/PPDRZZ/SFDRZZ/SDIRZZ


:SOUTHEAST MICHIGAN -- TEMPERATURE AND PRECIPITATION STATIONS
:....................................................................
:       STATION               MAX / MIN  / 8 AM / 24-HR / SNOW/ SNOW
:        NAME                 TEMP/ TEMP / TEMP / PRECIP/ FALL/ DEPTH
:....................................................................
WHKM4: NWS WHITE LAKE      :   47 /  26  /  33  /    T  /    T / 0
123M4: ANN ARBOR           :   49 /  28  /  30  /    T  /    T / 0
ADG  : ADRIAN AIRPORT      :   50 /  28  /  36  / 0.00
BAX  :*BAD AXE AIRPORT     :   43 /  33  /  38  /
CFS  :*CARO AIRPORT-TUSCOLA:   45 /  31  /  35  /
DET  : DETROIT CITY AIRPORT:   50 /  32  /  37  /    T
DTW  : DETROIT METRO ARPT  :   52 /  30  /  36  /    T  /  0.0 / 0
FNT  : FLINT BISHOP AIRPORT:   49 /  29  /  36  /    T  /  0.0 / 0
ONZ  :*GROSSE ILE AIRPORT  :   50 /  34  /  37  /
OZW  :*HOWELL AIRPORT      :   47 /  28  /  36  /
DUH  :*LAMBERTVILLE AIRPORT:   48 /  28  /  37  /
D95  :*LAPEER DUPONT AIRPRT:   46 /  30  /  35  /
IKW  :*MIDLAND AIRPORT     :   45 /  29  /  37  /
TTF  :*MONROE AIRPORT      :   52 /  28  /  37  /
RNP  :*OWOSSO AIRPORT      :   48 /  30  /  38  /
PTK  : PONTIAC AIRPORT     :   49 /  30  /  35  /    T
P58  : PORT HOPE           :   44 /  36  /  38  / 0.00
PHN  :*PORT HURON AIRPORT  :   48 /  30  /  36  /
MBS  : SAGINAW - TRI-CITIES:   48 /  30  /  36  /    T  /    T / 0
HYX  :*SAGINAW-HARRY BROWNE:   46 /  32  /  36  /
VLL  :*OAKLAND/TROY AIRPORT:   49 /  34  /  37  /
YIP  : YPSILANTI WILLOW RUN:   53 /  30  /  37  / 0.00
.END


*THE TEMPERATURE DATA FOR THESE SITES ABOVE REPRESENT THE HIGHEST AND
 LOWEST TEMPERATURES THAT WERE REPORTED ON THE METAR OBSERVATIONS
 THAT TRANSMIT THREE TIMES AN HOUR AND MAY NOT REPRESENT THE ACTUAL
 HIGH OR LOW FOR THAT SITE. THESE SITES DO NOT MEASURE
 PRECIPITATION.
.....................................................................


THE FOLLOWING COOPERATIVE OBSERVER SITES REPORT FROM MIDNIGHT TO
MIDNIGHT THE PREVIOUS DAY.


.BR DTX  0513  ES DH07/TAIRZX/TAIRZN/TA/PPDRZZ/SFDRZZ/SDIRZZ


:SOUTHEAST MICHIGAN -- TEMPERATURE AND PRECIPITATION STATIONS
:....................................................................
:       STATION               MAX / MIN  / 12 AM /24-HR / SNOW/ SNOW
:        NAME                 TEMP/ TEMP / TEMP  /PRECIP/ FALL/ DEPTH
:....................................................................
ARNM4: ADRIAN              :   49 /  31  /  32  / 0.00 /  0.0 / 0
MILM4: MILFORD - GM GROUNDS:   46 /  29  /  29  / 0.03 /  0.0 / 0
MDLM4: MIDLAND             :   45 /  33  /  33  / 0.01 /    M / M
MTCM4: MT CLEMENS SELFRIDGE:   51 /  35  /  35  /    T /  0.0 / 0
PRHM4: PORT HURON          :   48 /  37  /  38  / 0.06 /    M / M
SGNM4: SAGINAW 5W          :   45 /  33  /  34  /    T /    T / 0
.....................................................................


COOPERATIVE OBSERVATIONS VALUES ARE FOR APPROXIMATELY THE PREVIOUS 24
HOURS FROM YESTERDAYS OBSERVATION TIME TO TODAY`S OBSERVATION TIME.


.BR DTX  0513  ES DH07/TAIRZX/TAIRZN/TA/PPDRZZ/SFDRZZ/SDIRZZ


:SOUTHEAST MICHIGAN -- TEMPERATURE AND PRECIPITATION STATIONS
:..................................................................
...
:       STATION           OB   /MAX / MIN  /OB  /24-HR /SNOW/SNOW
:        NAME             TIME /TEMP/ TEMP /TEMP/PRECIP/FALL/DEPTH
:..................................................................
...
: ***MIDLAND COUNTY***


: ***BAY COUNTY***
AUBM4:  AUBURN            :0630/ 46 /  27 /  30 /    T/   M/   M


: ***HURON COUNTY***
BDAM4:  BAD AXE           :0705/ 44 /  33 /  35 / 0.04/   M/   M
FLNM4:  FILION 5NNW       :0645/ 44 /  33 /  35 / 0.00/   M/   M
POAM4:  PORT AUSTIN       :0738/ 43 /  35 /  36 / 0.00/   M/   M
PHPM4:  PORT HOPE         :0800/ 44 /  33 /  37 / 0.02/ 0.2/   0


: ***SAGINAW COUNTY***
MERM4:  MERRIL 2E         :0800/ 47 /  29 /  37 /    T/   T/   M
SAGM4:  SAGINAW           :0800/ 47 /  30 /  34 / 0.00/ 0.0/   0


: ***TUSCOLA COUNTY***
CARM4:  CARO              :0750/ 44 /  29 /  32 / 0.00/   M/   M


: ***SANILAC COUNTY***
LEXM4:  LEXINGTON         :0735/ 47 /  31 /  34 /    T/   M/   M
MRLM4:  MARLETTE          :0645/ 45 /  30 /  31 / 0.00/   M/   M
SANM4:  SANDUSKY          :0705/ 46 /  32 /  32 / 0.03/   M/   M


: ***SHIAWASSEE COUNTY***
CORM4:  CORUNNA 2NE       :0600/ 48 /  29 /  29 /    T/   T/   0
DRNM4:  DURAND            :0800/ 47 /  30 /  37 /    T/   T/   0
OWSM4:  OWOSSO            :0700/ 47 /  28 /  29 /    T/   M/   M


: ***GENESEE COUNTY***
BUNM4:  BURTON 4N         :M   /  M /  27 /  28 /    T/   M/   M
GODM4:  GOODRICH          :0730/ 47 /  29 /  31 / 0.01/   T/   0


: ***LAPEER COUNTY***
LPEM4:  LAPEER 2W         :0730/ 47 /  30 /  33 / 0.01/   T/   0
LPRM4:  LAPEER            :0730/ 47 /  30 /  32 / 0.00/   M/   M


: ***ST. CLAIR COUNTY***
YALM4:  YALE              :0655/ 45 /  30 /  31 /    T/   T/   0


: ***LIVINGSTON COUNTY***
HOWM4:  HOWELL            :0751/ 49 /  26 /  34 / 0.00/ 0.0/   0
WHLM4:WHITMORE LK 1N      :0700/ 48 /  26 /  27 / 0.00/ 0.0/   0


: ***OAKLAND COUNTY***
FARM4:  FARMINGTON        :0730/ 48 /  27 /  34 / 0.00/   M/   M
WSBM4:  WEST BLOOMFIELD   :0645/    /     /     /    T/   T/   0


: ***MACOMB COUNTY***
RICM4:  RICHMOND 4NNW     :0845/ 48 /  32 /  37 /    T/   T/   0


: ***WASHTENAW COUNTY***
AASM4: ANN ARBOR-SOUTHEAST:0730/ 50 /  27 /  33 /    T/   M/   M
AAWM4:  ANN ARBOR 1W      :0830/ 51 /  25 /  39 /    T/   T/   0
MCHM4:  MANCHESTER        :0705/ 48 /  28 /  28 / 0.00/   M/   M
SLNM4:  SALINE 4SW        :0800/ 50 /   M /  34 / 0.00/   M/   M
SALM4:  SALINE            :0800/ 50 /  27 /  33 / 0.04/   M/   M


: ***WAYNE COUNTY***
DBNM4:  DEARBORN          :0500/ 50 /  31 /  31 / 0.00/   M/   M
WYTM4:  WYANDOTTE         :0800/    /     /     /    T/   T/   0


: ***LENAWEE COUNTY***
MRIM4:  MORENCI           :0730/ 52 /  29 /  35 / 0.00/ 0.0/   0
TECM4:  TECUMSEH          :0630/ 51 /  30 /  30 / 0.00/   M/   M
TIPM4:  TIPTON 2WNW       :0800/ 48 /  29 /  36 / 0.00/   M/   M


: ***MONROE COUNTY***
DNDM4:  DUNDEE            :0650/ 49 /  30 /  31 / 0.00/   M/   M
MLIM4:  MILAN             :0738/ 49 /  29 /  34 / 0.00/   M/   M
MNRM4:  MONROE            :0900/ 50 /  27 /  39 / 0.00/   M/   M
NWPM4:  NEWPORT 4SSE      :0700/ 51 /  29 /  29 / 0.00/   M/   M
.END

5/12/13
The aggressive cold snap has come to fruition with just above low max's expected today with highs in the upper 40s to lower 50s.  As stated below, record low max's are in the lower to mid 40s and record lows overnight in the mid 20s to around 30 /Detroit - 44/1966, 30/1971; Flint 40/1966, 28/1946; Saginaw 42/1966, 26/1946 - note the record lows are for Monday morning/.   

Areas of frost and freezing temperatures are still expected overnight and if you have set out vulnerable vegetation, you may want to cover it. Seeds not germinated in the ground stand the best chance of surviving but are still vulnerable to a freeze.

A strong rebound in temperatures will come this week with readings rising through the 70s and into the lower to mid 80s by mid week.

________________________________________________________________________________  

5/8/13
Latest guidance continues the trend for the upcoming weekend into Monday. A rather potent cold front and subsequent air mass will dive across the Great Lakes and on into Southeast Lower on Saturday. Latest temperatures estimates are for lows in the 30s both Mother's Day morning and Monday; while highs drop sharply from the 60s Saturday to the upper 40s to lower 50s on Mother's Day. This is a somewhat impressive mini cold snap; rather sharp and quick hitting for just a couple of days. A brisk northerly wind will accompany the chill on Mother's Day.

For comparison; record low max's for Southeast Lower Michigan on Mother's Day, Sunday are in the lower to mid 40s while record lows on Sunday and Monday are in the upper 20s to lower 30s. Therefore; not too far away from record cold weather for the period.
_____________________________________________________________________
Original blog 5/7/13 1230am

It's interesting how we "backed-out" of winter this past month or so and on into spring.
Very much the same way we backed-out of autumn into winter; late and slowly. In the fall, even with each cooler wave of air it seemed warmer breezes returned and hung around much longer, refusing to give-way to winter. And again; the same thing could be said about spring as the colder, winter-like periods refused to give up the ship to spring.

So what now? Have to serious waves of colder air finally exhausted themselves? Are we free to assume spring air masses will rule the land? While the green-up is now in earnest as expected; is it safe to plant? I'd say yes for the most part BUT there seems to be one more hump to get by before there is more security in that statement. And that hump is the upcoming Mother's Day weekend or in which I'll refer to in meteorological terms and tongue-in-cheek as the "Mother's Day Curse"; or simply when Mother Nature gets to be "Mommy Dearest".

Mother's Day's is always the second Sunday of May which figures out to be anytime from May 8th to May 13th...Julian Day 128 - 133. I've noticed this "pattern" and I can't tell you how many times people complain to me about the "more than occasional" lousy weather on or around Mother's Day in Michigan. Is there any scientific data to back it up? The May 9th, 1923 snowstorm written about in my last blog would certainly fit the bill when Mom Nature certainly had a Mommy Dearest tantrum! How about the general temperatures in DTW data, any note of a pattern during that week or so?

A while back while I was at DTX, we ran DTW's (Detroit Metropolitan Arpt's) climatic data of the high temperatures only from 1958 to 2004, so not the entire Detroit climatic base. And, in this case (as with others) a graph or "picture" is worth a thousand words.

On the graph below we have; the highest category, termed "max" (record highs), "min" (record low maxs), means and standard deviations (%) of all those highs. In other words; the times the temperatures were at a certain standard deviation percentile or below. For example; looking at the graph below say at the 90th percentile at the highlighted interval, means 90 percent of the time the high temperatures either equaled or were less than the particular temperature in the left column. In this particular case, lower 80s are at the 90 percentile and thus, only 10% of the time the highs exceeded the lower 80s.


Again, during the time period mentioned above and highlighted on the graph; one can see the sideways to even down (especially the record low maxs which are shown on the graph as the min trace) of temperatures during the highlighted period, May 8th - 13th (Julian Day 128-133) or Mother's Day date possibilities.

The temperatures actually become a bit more erratic at that time. As mentioned, the most interesting and notable item that shows up is in the record low max's ("min"). See how the bottom blue min data line actually decreases from the first week of May; indicating a several degree slide in the record low maxs as slightly more potent cold air masses occurred during our point of interest - Mother's Day timing, 8th - 13th. Other data (traces) at the same highlighted time show a pause in rising temperatures even though we are proceeding toward the mid May time period. I know it's subtle "pause" but then compare it to the jump in all temperature fields (Max, 90th, 67th, Mean, 33rd, 10th and Min) the next six days from around day 134 to day 139. After; the same pattern roughly repeats all over again up then sideways, up then sideways. The period around Mother's Day happens to fall within that sideways (or even down a bit). Ultimately, the temperature pattern does becomes less variable as we "climb" into summer.

Mother's Day 2013

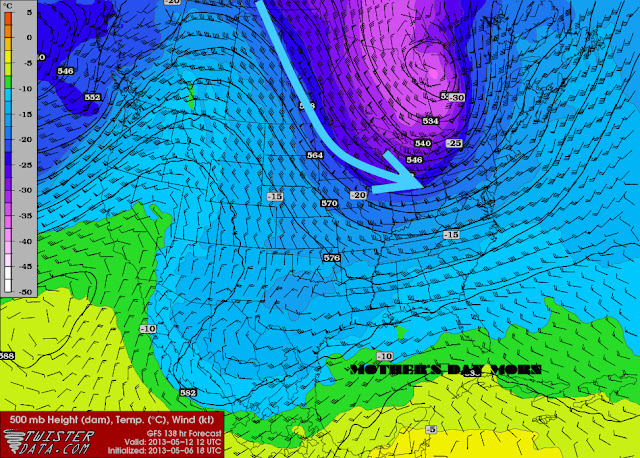
So, then how does this data relate to the upcoming Mother's Day? For that we have to look ahead at model guidance for our aforementioned period. General model consensus is for a sharpening colder trough to dig out of Canada for the upcoming weekend. The amplitude of this trough and cool surface high pressure to follow will bring colder, below average temperatures during the period roughly Saturday through Monday...or again, right around Mother's Day.


The bigger question at this time (and relating to our headline); will there be a risk of any frost/freeze with this air mass? At this early juncture; I'd say there will be just enough cold air at the surface, that we run the risk of some scattered frost and freezing temperatures but at this time, not a widespread heavy killing frost/freeze. Timing too is important and chilliest mornings are expected at this time to be Mother's Day morning and again, Monday morning.

Therefore make it simple; if you don't have to plant, especially tender vegetation, why risk it? Wait a few days because much warmer weather is projected to follow (sort of like our graph ;-)

Making weather fun while we all learn,
Bill Deedler - SEMI_WeatherHistorian


Apr 24, 2013

Record Breaking Late Season Snowstorm of April 23rd-25th 2005 and Incredible Snowstorm of May 9th 1923!


After 70 degree weather yesterday, yet again today it is snowing a various locations across Southeast Lower Michigan!  While our weather this spring has been much less than desirable, it has been worse; on this date in history and later. Take a look at my write-ups on just two of these memorable snows.

Record Breaking Late Season Snowstorm of April 23rd-25th 2005


With such an exceptionally variable and stormy winter it was actually fitting that the Winter of 2004-05 went out with a bang and not a whimper. If the persistent cold and snow during March wasn't enough to extend an already lengthy winter, Mother Nature really gave the inhabitants of Southeast Lower Michigan a sucker punch late in April.

A very nice stretch of sunny, dry (actually too dry) weather commenced late March into the first three weeks of April. This beautiful early spring weather reached a climax on the 19th when record highs were attained at all three climate stations (DTW/FNT/MBS). Ironically, not only did all three cities have record highs but it also was with the same temperature, 83 degrees. After the 19th, however, the weather was all downhill, accelerating big-time by the weekend. A series of cold fronts pushed south across the Michigan from the 20th to the 23rd, dropping temperatures some 40-50 degrees by the weekend /23-24th/!


An intense low pressure developed along an arctic cold front over the Upper Ohio Valley Saturday into Sunday and actually backed westward into the Eastern Lower Great Lakes (over Southwest Ontario - central pressure about 29.25" /986 MB/). This storm brought the worse late April weather seen in these parts in several decades. Snowfalls from the storm ranged wildly from a trace to as much as 16.5" with the heaviest falling across the highland areas from central Oakland County northeast into the Thumb Region (around Bad Axe). This very late snowstorm was the "icing on the cake" so to speak on what already had been a very snowy season. More information is available on April snows and total snowfall amounts from this storm. Incredibly, the May 9th, 1923 snowstorm which contained similar snow depths is over two weeks later!

The phasing of upper level jet steams, resulting in intensifying low pressure systems over Lower or Eastern Great Lakes have been responsible for some of our worst snowstorms; as evidenced by the above and following...

               ...Snowstorm of May 9th, 1923... 

Not since records have been kept in Southeast Lower Michigan      
(Detroit as far back as 1870), has the snowstorm of May 9th
in 1923 been equalled in season lateness and magnitude.

A strong cold front, of Arctic origin, pushed across Southeast
Michigan on the afternoon of the 8th, creating scattered thunder-
storms. The strength of the front was quite evident in Detroit.
The temperature plummeted from a near normal reading of 62
degrees at 100 pm to a winter like one of 34 degrees by 600 pm.
Behind the front, the stage was set for some startling weather    
developments for the month of May...even in Southeast Lower
Michigan. Rain mixed with snow fell across the area during the
evening of the 8th. Detroit received an estimated inch of snow
which melted on the ground before ending by midnight.

On the morning of the 9th, a low pressure area developed along
the front in northwest Ohio and moved over Lake Erie during the
afternoon. The developing low pulled warmer, moist air north from
the Ohio Valley and mixed with the unseasonably cold airmass
over Southeast Lower Michigan. As a result, a heavy, wet snow
began falling during the forenoon hours and continued through the
afternoon. Arguably, one of the most astonishing things (and
there were several) about the mid-spring snowstorm was that the
bulk of the snow fell during the time of day which is normally
considered "the heat of the day" or "afternoon heating" when
normal highs of the day are attained. The afternoon temperatures
never budged from the lower 30s (31-33) and was accompanied by
a stiff northwest wind, averaging 15 to 25 mph. Keep in mind,
the normal or average high for May 9th is 67...some 35 degrees
warmer! 

The snow ended by the evening in Detroit and at 800 pm, six
inches was reported on the ground. The story was even more
fantastic as one traveled west and north of Detroit across
Southeast Lower Michigan. Generally, six to nine inches fell 
west to the Ann Arbor area, northwest through Howell, north
across Pontiac and northeast up to Port Huron. Even more
incredible, snow depths of around a foot were reported at Flint
and Lansing north into the Saginaw Valley. Widespread damage was
reported to trees, power lines (many had a two inch circumference
of snow hanging on them) and telephone poles, especially in the
Saginaw Valley. Even so, economic damage was surprisingly small,
especially to spring vegetation. Evidently, the earlier spring
weather had been abnormally cold and this led to a late green up.
Substantial damage from the cold to vegetation and crops was
actually averted due to the insulation affect of the heavy, wet 
snow. Many May snow records (amounts and lateness in the season)
were shattered and stand firm to this day over Southeast Lower
Michigan.

By the next morning (10th), much of the snow had melted and by
the evening, it was just a memory. The official high in Detroit
on the 9th was 39, but that occurred just after midnight, before
the storm. The low was 31, which occurred in the afternoon during
the storm, giving a mean of 35 for the day and 21 degrees below
the normal of 56. Other May record snowfalls in Detroit pale in
comparison. In 1912, 1.5 inches fell on May 13th for the second
highest amount and the latest snow actually occurred the last day
of the month, May 31st, 1910 with a trace.

So, the next time you think it's too cold for this late in spring
or we can't possibly have a measurable snowfall in May across
Southeast Lower Michigan, you might want to THINK about it again
(or maybe not).
 
Making weather fun while we all learn, 
Bill Deedler -SEMI_WeatherHistorian


Apr 23, 2013

Finally an Extended Surge of Warm, Spring Weather To Encourge a Rapid Green Up!

One more cool down for the time being is all we'll have to endure before spring comes on more aggressively as we turn the calendar from April to May! Finally, Mom Nature will give us a surge of extended spring weather we have yet to see thus far. Latest indications are the colder, below normal temperatures plaguing much of the northern, central and Great Lakes region will hit the road for a longer time frame beginning by this weekend.

The warm, spring-like weather of today will once again go by the wayside as another aggressive cold front (the last in the series, for awhile anyway) moves through the region overnight and returns the region to below normal temperatures for a few days. But alas, have faith as latest extended model trends show the colder air to retract back to the northwest over Alaska, Western Canada and the Pacific Northwest during the coming weekend into next week (see 500 MB Jet maps below). After that however; extended guidance diverges on the first weekend of May; so get out and enjoy the much deserved warmer, spring weather as temperatures jump back into the 60s and 70s and possibly some 80s.


Making weather fun while we all learn,
Bill Deedler -SEMI_WeatherHistorian


Apr 16, 2013

Update 4/18/13; Severe Weather Reported

 Severe Weather April 18 2013 From the NWS


A strong cold front moved through Southeast Michigan on Thursday, April 18th. The front produced severe thunderstorms, heavy rain and
damaging winds.


_________________________________________________________________________
4/17/13 - 130 PM: Update
Little change to yesterday's blog as ingredients are progged to come together for the risk of strong to severe storms Thursday into early Friday. As we move closer to the time; a few important items have begun to become clearer.

12z 8am Thursday 4/18 -  Friday 12z 8am Fri 4/19
The highest severe threat for strong to damaging severe winds appears to be midday Thursday into Thursday evening. Refer to narrative and maps below for Thursday as confidence in modeling of the atmosphere is increasing with each successive run. Winds will average 20 to 30 mph with gusts possible in excess of 55 mph in the strongest of thunderstorms. Wind criteria for a severe thunderstorm is 58 mph along with 1" hail. At this time; the main threat from these storms would be wind damage. Because of the strong dynamics and shear in the atmosphere a risk of a few tornadoes can't be rule out.

In addition; also indicated below is concern for strong winds with the passage of the cold front around dawn Friday and moderate to strong gusty prevailing winds on Friday behind the front. Wind gusts of 40-50 mph are possible around frontal passage and after on Friday.

The Storm Prediction Center has now /130 PM Wed/ included all of Southeast Lower Michigan in it's severe threat for the above time period; 8AM EDT THU-8AM EDT FRI.


< Day 1 Outlook Day 3 Outlook >
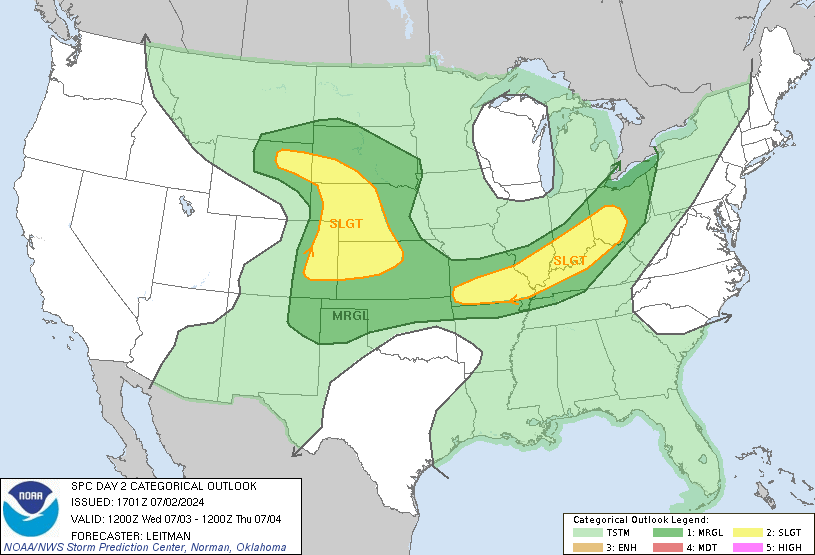
Apr 17, 2013 1730 UTC Day 2 Convective Outlook
Updated: Wed Apr 17 17:17:50 UTC 2013  (Print Version)
Probabilistic to Categorical Outlook Conversion Table
Categorical Probabilistic
 Population  Cities  CWAs  Interstates  Counties  ARTCC  FEMA Regions
 http://www.spc.noaa.gov/products/outlook/day2probotlk_1730_any.gif
  
Categorical Day2 1730Z Outlook
Risk Area (sq. mi.) Area Pop. Some Larger Population Centers in Risk Area
MODERATE 98,699 13,128,064 Chicago, IL...Memphis, TN...Joliet, IL...South Bend, IN...Decatur, IL...
SLIGHT 348,105 52,217,566 Houston, TX...Indianapolis, IN...Columbus, OH...Detroit, MI...Nashville, TN...
 Forecast Discussion
   SPC AC 171715
   
   DAY 2 CONVECTIVE OUTLOOK  
   NWS STORM PREDICTION CENTER NORMAN OK
   1215 PM CDT WED APR 17 2013
   
   VALID 181200Z - 191200Z
   
   ...THERE IS A MDT RISK OF SVR TSTMS FOR SWRN LOWER MI...ERN/SRN
   IL...WRN/NRN IND...SERN MO...FAR WRN KY/TN...ERN AR...NWRN MS...FAR
   NERN LA...
   
   ...THERE IS A SLGT RISK OF SVR TSTMS FROM THE GREAT LAKES TO THE
   WRN/CNTRL GULF COAST...
   
   ...SIGNIFICANT SEVERE WEATHER EPISODE CONSISTING OF POTENTIALLY
   WIDESPREAD DAMAGING WINDS AND SEVERAL TORNADOES APPEARS INCREASINGLY
   LIKELY ON THU...
   
   ...SYNOPSIS...
   AN AMPLIFIED UPPER-LEVEL TROUGH CENTERED FROM THE NRN PLAINS TO THE
   SOUTHWEST AT 12Z/THU WILL PROGRESS EWD ACROSS THE UPPER MS VALLEY TO
   THE SRN PLAINS THROUGH EARLY FRI. A VIGOROUS SHORTWAVE IMPULSE WILL
   EJECT FROM THE CNTRL PLAINS TO WI/IL WITH AN INTENSE AND
   STRENGTHENING MID-LEVEL SPEED MAX /AOA 100 KT/ OVERSPREADING THE
   MIDWEST. AT THE SURFACE...CYCLOGENESIS WILL CONTINUE FROM THE IA/IL
   BORDER NEWD TOWARDS NRN LK MI. AN ATTENDANT COLD FRONT WILL SWEEP
   EWD LIKELY REACHING LK MI TO THE LOWER MS VALLEY BY THU EVENING. A
   WARM FRONT WILL ATTEMPT TO ADVANCE NWD IN LOWER MI...WITH LOWER
   CONFIDENCE IN HOW FAR N IT WILL EXTEND WITH ABUNDANT CONVECTION
   EXPECTED N OF THE BOUNDARY.
   
   ...GREAT LAKES TO THE WRN/CNTRL GULF COAST...
   FAIRLY EXTENSIVE BANDS OF CONVECTION SHOULD BE ONGOING AT 12Z/THU
   ALONG BOTH FRONTAL ZONES. DIURNAL HEATING WITHIN A RICHLY MOIST AIR
   MASS FROM THE WRN GULF INTO THE MIDWEST CHARACTERIZED BY 60S TO
   LOWER 70S SURFACE DEW POINTS AMIDST A REMNANT EML PLUME EMANATING
   N/NEWD ACROSS THE S-CNTRL CONUS...SHOULD RESULT IN A MODERATELY
   UNSTABLE WARM SECTOR WITH MLCAPE REACHING 1000-2000 J/KG.
   LOWER-LEVEL SHEAR/HODOGRAPHS WILL BE IMPRESSIVELY LARGE WITH NRN
   EXTENT ACROSS THE BULK OF THE WARM SECTOR. THESE FACTORS COMBINED
   WITH STRONGLY FORCED ASCENT WILL LIKELY YIELD AN EXTENSIVE QLCS THAT
   WILL INTENSIFY AND INCREASE IN FORWARD SPEED DURING THE LATE MORNING
   THROUGH THE AFTERNOON. BOWING SEGMENTS AND EMBEDDED SUPERCELLS WILL
   BE FAVORED...ESPECIALLY WITH NRN EXTENT GIVEN THE DEGREE OF SHEAR.
   POTENTIAL WILL ALSO EXIST FOR DISCRETE SUPERCELLS DEVELOPING AHEAD
   OF THE QLCS AS MLCIN BECOMES MINIMAL. THIS WOULD SEEM TO BE MORE
   PREVALENT WITH SRN EXTENT WHERE LARGE-SCALE ASCENT WILL BE
   PROGRESSIVELY WEAKER. SWATHS OF WIDESPREAD DAMAGING WINDS APPEAR
   PROBABLE ALONG WITH A ROBUST TORNADO RISK /SOME OF WHICH COULD BE
   SIGNIFICANT/. THE OVERALL SEVERE THREAT WILL LIKELY DIMINISH BY LATE
   EVENING/OVERNIGHT AS THE SURFACE MOISTURE PLUME IS PINCHED OFF WITH
   NRN EXTENT GIVEN DOWNSLOPE DRYING OFF THE SRN APPALACHIANS INTO THE
   CNTRL/UPPER OH VALLEY.
   
   ..GRAMS.. 04/17/2013

__________________________________________________________________________
4/16/13 - 330 PM
As mentioned in my previous blog; I'd keep my eye peeled for any potentially rough weather in our near future and Thursday into midday Friday may fit the bill at this early stage. In addition and partly because of our recent flooding; some local lowland and river flooding may again be realized with heaviest rains.
 
Discussion
A powerful jet stream aloft, instability at the surface all wrapped around a deep low pressure system and sharp cold front spell trouble for much of the mid part of the country and into the Great lakes and Ohio/Tennessee Valley mid to late week. What really has me concerned in the strong jet aloft; we're talking 70 knots - 100 knots of wind just off the surface to around 18,000 FT /500 MB/. Even if the instability is marginal and the fronts push through at lesser favorable times; this system STILL looks potent, take a look..

First off; Thursday afternoon with out first system>>>

As modeled by the GFS as of 12z Tuesday; a strong upper wind max/80k-500 mb/ will help usher in the elevated thunderstorm complex expected to develop Wednesday night and push through Southeast Lower Michigan Wednesday night into Thursday afternoon. The right-rear quadrant of this max jet is projected to cross this region sometime Thursday afternoon. This will give storm development an added "kick" along with instability which is projected to rise with daytime heating with lifted index's ranging in neighborhood of -3 > -6. Caution; remember this is model projected and you know where that sometimes leaves us! Actual instability will largely depend on several factors; surface heating (i.e. sunshine), colder air present aloft at the time just to name a few. These periodic thunderstorms will primarily be elevated (not surface instability based) as they advance through the region Wednesday night into early Thursday. Severity will depend largely on available instability aloft and potential surface based instability thrown into the action along with projected wind max "kicking -in"!  Negatives include; time of day, little added surface instability along with the max leaving the region a bit earlier which would help negate severe potential.

                                                                                                Thursday Midday


Then on Friday early in the day (below maps); the main surface system along with wind max is slated to storm through the region. Again; the yellow highlighted discussion of model projected above applies here, also. Timing of the system and limited instability is unfavorable for "classic severe weather". However, with the powerful cold front being aided by a 70 knot - 100 knot jet core just aloft; this still would have the potential for a potent squall line of wind were the winds realized by any decent updrafts along the front, thunder or not! Strong gusty winds look favorable later also behind the system as it wraps up to the north.
                                                                                                      Friday Forenoon


Again this is two to three days out and this atmosphere and attending severe weather is yet to be better sampled. In any event; stay tuned for updated info on this potential first notable severe weather event of the season.

For the latest on severe weather potential for the US click here!
 

Making weather fun while we all learn,
Bill Deedler -SEMI_WeatherHistorian


Apr 10, 2013

The Battles Of Spring Are In The Air!

Finally some spring-like thunderstorms pulsed through Southeast Lower Michigan this second week of April. Along with the storms; very heavy rains soaked the mainly dormant landscape. Just a hint of green has been activated by the spring rains thus far, and mainly just grassy areas at that. Late you say? It's almost laughable when think back to last year at this time when our spring green-up was already over a month old. But last year of course was the truest of anomalies; the warmest March and early spring on record. Also while you're thinking back, you might remember, April settled down back closer to normal and averaged cooler than March! Extraordinary indeed! In addition, you might also remember the cold air masses in April that brought the killing frosts and freezes and heavily damaged the fruit crops. Well hopefully, we'll have none of that this year as we slowly warm and the growth appears, somewhat more gradual. After all, which is better; exhaust the cold air now or wait till the buds/flowers are on the fruit trees and spring growth is in full term?

But what of this spring? What spring you may ask? Oh it's there but you have to look closer for it. It's a whole different kind of spring...the inverse of last year...closer to our "normal spring" but thus far, it has indeed been colder and later. While March ended up 2 to 2 1/2 degrees below normal; April thus far has been worse! During the first third of the month /10 days/, temperatures have averaged as much as 3 to nearly 5 degrees below normal with the biggest departures up around the Saginaw Valley and Thumb District. Yes, when mother nature pays back; she can be a....   


The Great Lakes continue their icy chill as domes of cold, residual Siberian and Arctic air surge down, nearly unabated across the northern and even central states at times. This Arctic air continues to be funneled down across the Lakes; accentuating the typically early spring icy waters of the Great Lakes. And, as you can see by the widespread 30s to around 40 degree water temperatures as we approach mid April; the Great Lakes at this time of year do absolutely nothing in aiding our spring warm-up.

 
Arguably; no other weather map displays the spring air mass battle more appropriately than our present surface map for 8pm this evening; Wed Apr 10th. The battle line is clearly drawn, seen and heard by way of strong thunderstorms and very heavy rains along the quasi-stationary front draped west to east across the Lower Lakes/Upper Ohio Valley. Cold, residual Arctic air continues to be funneled down across the Great Lakes while at the same time, spring's warm southerly winds in response to an increasingly stronger spring sun, push northward up through the deep south and into the Ohio Valley! The resultant, strong baro-clinic zone also denoted by the sharp east/west temperature contrast across the region is exceptional; 30s and 40s to the north and 50s, 60s and 70s around and immediately to the south...all in a very tight area of landscape. 


The clash of the seasonal air masses; winter to the north and spring to the south indeed is in the air and will be for the next few weeks anyway as the cold, winter-like air masses slowly warm and moderate as they clash with springtime warmth. Our extended maps indicate this with a rather busy weather period for the next 10 to 14 days. I'll be on watch for more notable Mother Nature rou's or tantrums in the meantime.

Making weather fun while we all learn,
Bill Deedler -SEMI_WeatherHistorian
Apr 8, 2013

"January through March"; The Real Winter of 2012-13

Without a doubt, the Winter of 2012-13 was late in getting started and even statistically,  better suited the months of January through March rather than the standard climate months of December through February. In fact, March's average temperatures at all three climatological sites ended up colder than December's temperatures, something not seen often. Normals for Southeast Lower Michigan in December average in the upper 20s to around 30; while normals for March average in the mid 30s. Last December saw temperatures average in the mid 30s across the entire region (DTW - 35.9; FNT - 33.5; MBS - 34.1 for a Southeast Lower Michigan average of 34.5) which as you can see, match March's normals of mid 30s well.

In the reverse, this past March of 2013 saw temperatures average in the lower to mid 30s (DTW - 34.6; FNT - 32.2; MBS - 31.3 for an average of 32.7) nearly two degrees below December 2012's average temperature for Southeast Lower Michigan of 34.5! Not quite as cold as December's normal temperatures but still represented December better than December's 2012 actual temperatures did.

While normally March gradually warms up as the month unfolds, this really didn't happen until the last six days of the month when readings averaged normal to above. Two thirds of the month average below normal with the largest departures ironically coming when spring was to commence; the 20th and 21st with temperatures averaging 13.5 degrees below normal.  On the flip side to this cold, just two exceptionally mild days stole about a degree below monthly departure (in other words; the departure for the month would have been 3.0 - 3.5 degrees below normal, rather than 2.0 - 2.5 below). A storm center that pushed north of the region on the 10th/11th and pulled unseasonably mild air into the area with temperatures rising into the mid 50s to mid 60s...averaging 14 degrees above normal.

While snowfall around the region is still possible; chances diminish quite notably from early April to late April. And; despite the mild winter, snowfalls up through the first week of April actually performed admirably. Detroit has recorded 47.6" exactly +6.0" /norm- 41.6" thus far/ above normal and right on the normal-above normal threshold used in analogues. Normal snowfall for the entire season at Detroit; 42.7". Snowfall at Flint was a few inches below the normal thus far with 43.6" recorded, normal for the entire season stands at 47.4" and thus, -3.8" thus far.  Saginaw recorded 43.4" (just .2" different from Flint) and season normal stands at 46.1".

CLIMATOLOGICAL WINTER 2012-2013 (DEC, JAN, FEB) STATS/RANKINGS - NWS
 
---------------------------------------------------------------------

PRECIPITATION

              ACTUAL   NORMAL  DEPARTURE     RANKING
DETROIT AREA   8.92"    6.44"   +2.48"     11TH WETTEST
FLINT AREA     8.04"    5.03"   +3.01"      6TH WETTEST
SAGINAW        7.14"    5.24"   +1.90"     16TH WETTEST


AVERAGE TEMPERATURE

              ACTUAL   NORMAL  DEPARTURE     RANKING
DETROIT AREA   30.4     27.9     +2.5      17TH WARMEST
FLINT AREA     28.5     24.9     +3.6      10TH WARMEST
SAGINAW        28.5     24.7     +3.8      10TH WARMEST


AVERAGE HIGH TEMPERATURE! 
              ACTUAL   NORMAL  DEPARTURE     RANKING
DETROIT AREA   37.5     34.4     +3.1    T-16TH WARMEST
FLINT AREA     36.2     32.2     +4.0     T-8TH WARMEST
SAGINAW        35.2     31.4     +3.8          N/A*


AVERAGE LOW TEMPERATURE

              ACTUAL   NORMAL  DEPARTURE     RANKING
DETROIT AREA   24.0     21.4     +2.6      21ST WARMEST
FLINT AREA     20.9     17.7     +3.2      14TH WARMEST
SAGINAW        21.7     18.0     +3.7          N/A*


DETROIT AREA HAS A CLIMATE RECORD DATING TO NOVEMBER 1874
FLINT AREA HAS A CLIMATE RECORD DATING TO JANUARY 1921
SAGINAW HAS A CLIMATE RECORD DATING TO JANUARY 1912

*RANKINGS OUTSIDE THE TOP 20 FOR SAGINAW ARE CURRENTLY UNAVAILABLE
DUE TO ONGOING UPDATES FOR THE SAGINAW AREA DATABASE
_______________________________________________________________
 
 
Next up on the Winter of 2012-13; I'll take a look at the analogue 
performance and what analogue(s) performed the best in relevance to
this winter and associated spring projections.
 
Making weather fun while we all learn,
Bill Deedler -SEMI_WeatherHistorian