Jun 30, 2012

Strong Dominant Hot Ridge and Occasional Deep Upper Low in Eastern Canada Responsible for Very Warm and Dry Pattern Thus far This Summer /Updated 90 stretch - DTX/

The Summer of 2012 has started just like the past few summers with plenty of heat with above normal warmth across Southeast Lower Michigan. Now with the last day of June recorded in the record books; June of 2012 will go down as the 9th warmest June on record placing a smidgen ahead of 1994's 72.2 (originally 9th place) with an average of 72.3. This places it right smack dab between 1994 and 1991.

Interestingly; neither Flint nor Saginaw placed in the top ten warmest Junes. In fact, Flint did not even place in the top 20 warmest Junes; while Saginaw placed down at 17th. Flint's June average temperature was 69.2 degrees, while Saginaw's average was 69.8 replacing 1987.

Top 20 Coldest/Warmest Junes in Southeast Lower Michigan
 
Rank Detroit Area* Flint Bishop** Saginaw Area***
Coldest Warmest Coldest Warmest Coldest Warmest
Temp Year Temp Year Temp Year Temp Year Temp Year Temp Year
1 62.8 1985 74.6 1933 60.1 1969 75.0 1933 60.6 1982 73.9 1933
2 62.8 1903 74.1 2005 60.9 1958 74.9 1934 61.0 1926 73.5 1919
3 63.1 1915 74.0 1919 61.5 1980 72.1 1949 61.5 1915 72.3 1971
4 63.4 1928 73.3 1949 62.5 1985 71.7 1925 61.8 1958 72.3 1934
5 63.4 1926 73.2 1934 62.5 1972 71.5 1921 61.9 1917 71.7 2005
6 63.4 1916 72.8 1943 62.9 1982 71.3 1943 62.1 1980 70.6 1931
7 63.6 1927 72.7 1952 63.1 1977 71.2 2005 62.1 1916 70.5 1976
8 63.7 1980 72.4 1991 63.3 1960 70.3 1952 62.3 1945 70.4 1949
9 63.7 1889 72.2 1994 63.4 1928 70.3 1987 62.7 1977 70.3 1967
10 63.8 1878 71.6 1995 63.6 1945 70.3 1939 62.8 1985 70.2 1932
11 63.9 1958 71.6 1890 63.8 1927 69.8 1931 62.8 1928 70.0 1995
12 63.9 1902 71.5 1944 64.2 1992 69.8 1923 63.2 1947 69.9 2007
13 64.1 1917 71.4 1921 64.5 1947 69.7 1991 63.2 1902 69.9 1923
14 64.2 1982 71.3 2007 64.6 2003 69.6 1954 63.3 1903 69.9 1930
15 64.2 1972 71.3 1954 64.7 1961 69.6 1932 63.5 1969 69.9 1921
16 64.4 1881 71.3 1987 64.9 1986 69.5 1971 63.7 1972 69.9 1911
17 64.6 1935 71.3 1923 64.9 2009 69.5 1944 63.8 1927 69.8 1987
18 64.6 1897 71.2 1895 64.9 1974 69.4 1941 64.2 1978 69.7 1999
19 64.7 1969 70.9 1953 65.1 1978 69.4 1930 64.2 1940 69.7 1901
20 64.8 1907 70.8 2002 65.1 1948 69.3 1976 64.2 1924 69.6 1943
* Detroit Area temperature records date back to January 1874.
** Flint Bishop temperature records date back to January 1921.
*** Saginaw Area temperature records date back to January 1900.

 
Why the discrepancy between Detroit, Flint and Saginaw? Again, mainly because of the heat island effect at Detroit Metro Airport. And, not just the overnight lows on the hottest of days but also on the coolest of nights! The reason both Flint and Saginaw placed so much lower in the top 20 hottest Junes (or not at all) was the decidedly, refreshing cool blasts that occasionally occurred during the month. This was due to our friendly cool upper low pressure centered over eastern Canada that plopped its caboose far enough south over the Great Lakes and Northeast, to break the hot spells. Of course, these cooler infiltrations happened at Detroit too but on several occasions; that cooler air was introduced across the region on a north to northeast wind. This is not conducive to the coolest of nights at Metro with the wind flow across the urban and suburban areas into Metro Airport.

With all the heat lately, it is easy to forget the strong cool blasts Southeast Lower Michigan did see in June. As a comparison; Flint's temperatures fell into the 40s for overnight lows ten times during the month and two of those were 42 degrees, ten degrees from freezing! Saginaw saw overnight lows fall into the 40s five times with the lowest; a double 46. Detroit had a lone 49 degree low for the month but still, there were numerous 50s. Take away the heat island effect; and I doubt Detroit would have placed much above the mid teens in the top 20 warmest Junes, like Saginaw. Unfortunately, this micro-climate does affect temperatures (mainly overnight lows) at Detroit and several other major cities...polluting long term records (but don't get me started ;-)).

Last year's hot Summer of 2011; tied with 2010 in Detroit at 74.4 for fourth hottest summer! We also did end up with 23 days where the temperature rose to 90 degrees or better. Thus far we are moving right along on the 90 degree track again with already 11 days of 90 degrees or better at Detroit; average is about 12-14. Even though Flint did not place in the top 20 warmest Junes; there still were 7 days with 90 degrees or better in June and one 100 (8 for the season). This is the best example of the contrasting temperatures during the month! Here Flint has had 7 days of 90 degree or better, including the 100...yet failed to even place in the top 20 warmest Junes! Want more proof? Get a load of Flint's June temperature extremes...100 degrees and two 42 degrees!

Why so hot; yet "so cool" with average temperatures just  2 1/2 degrees above normal? DRY! That's right, the upper wind pattern thus far this summer has been conducive to bring the blistering heat out of the Great Plains and Midwest, east into the Great Lakes. While to a lesser extent, the upper flow over Canada has occasional been impressive enough to break through the hot ridge and back it off further west and  thus keeping the worst of the heat; west and southwest of us until really just this past several days. While this has helped in the temperature department somewhat; it had added to the dry conditions. When these cooler air masses have surged out of Canada, they flow across the relatively, cool and dry continental regions of Canada. This, combined with the prevalence of the strong hot ridge west and over us; has lead to a relatively scant moisture supply being the usual Gulf summer moisture has been cut back some. 

Since the hot ridge has been so dominant over the country; increasingly dry soil conditions are exacerbating the heat and thus, exacerbate the dry conditions. Simply put; they feed on one another!  That's why it's been so easy to pop into the 90s...just look at your yard...it's becoming semi-arid out there in many places! This comes, of course,  at the worse time possible in the growing season. Many areas are at least two to nearly four inches below normal in this years growing season! A season that still has at least two solid months left yet. I feel this dry weather phenomena is just as important as any heat (and there at least so far, we've had some relief).

Check out the latest Drought and Dry Index Map>>>


 This map below, shows the growing season (90 day) precipitation (or really lack of), percent of normal departure.

And this map below, shows the expansion for the below normal rainfall for June (30 day percent of normal).
Note the worsening dry conditions as relayed by the percent of normal rainfall (or really, lack of).


Next up...
With the dominance of the hot ridge of high pressure thus far, I will be updating my Summer Outlook for the region by boosting temperature departures a bit higher anyways than I originally indicated. On the precipitation side of things; drier conditions looked like they'd be most likely from I-69 south; across two-thirds of the region. Preliminary indications here are; I will likely encompass the whole region but want to look at some indicators.

So then; will strong hot upper ridge continue to be the dominant player in our weather or will it begin to be squashed more often by the Canadian Low? And what of severe weather? Thus far, most of the action has been around us, especially south...will this continue?

Look for my mid-summer update within a week or two!

Making weather fun while we all learn,
Bill Deedler -SEMI_WeatherHistorian


Jun 19, 2012

Competing Amplified Upper Air Pattern Coming To Fruition

Back in the Summer Outlook I displayed and discussed the two main weather patterns that seemed to me the most likely to "compete" during the summer months. Actually; I felt mother nature tipped her hand at the most likely weather pattern for the summer back in the spring and discussed that in the Outlook.

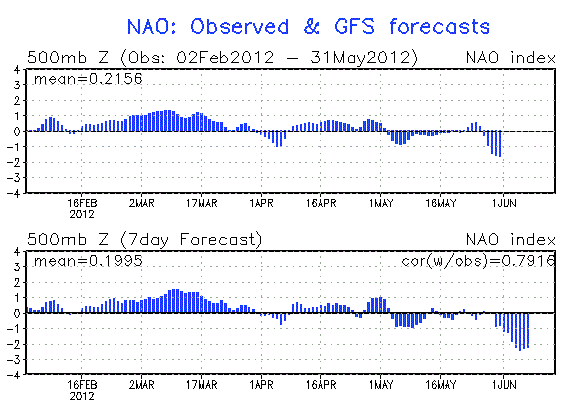
Overall; the strong ridge is expected to continue to be a dominant player and will oscillate from the center part of the country to the east; bringing the periods of heat. Normal to below trends will be brought about by the dubious North Atlantic Oscillation /NAO/ cycling lower into neutral to possible negative phases (more below) which would aid in emphasizing the upper low and troughing over central and eastern Canada.


This pattern has been well represented during the past several weeks with the cool and hot periods seen this June. Latest model trends continue to advertise this amplified competition... let's take a look at it on this hot day.


Present 500 MB: Tue 2PM 6/19


Present 850 MB: Tue 2PM 6/19
 

 Projected 500 MB Mon 10 AM 6/25


Note the complete flip-flop of the upper air jet pattern across North America! Not only the flip-flop change but the amplification is quite extraordinary one week from July!

Projected 850 MB Mon 10 AM 6/25

Likewise the cool surge of 850 MB temperatures (note the core of +3C over much of central and northern Michigan).


Another model for comparison to this anomalous pattern is the ECMWF and believe me it's no tamer. Just look the projected amplification of the 500 MB pattern, a strong ridge extends well into the Arctic circle while at the same time; the cold upper 500 MB vortex is displaced well south for late June over the eastern Great lakes. This is very reminiscent of some patterns seen earlier this spring!

 Projected 500 MB TUE 8 AM 6/26


What is even more fascinating is that the GFS strongly suggested this pattern way back on the 12th of June. Fascinating IF the actual upper air pattern resembles this anomalous projection that was about two weeks out!


Of course this is PROJECTED by both models and isn't actually observed data but with both models projecting such a strong amplified pattern...it bears watching.

Making weather fun while we all learn,
Bill Deedler -SEMI_WeatherHistorian


Jun 1, 2012

SUMMER 2012 OUTLOOK FOR SOUTHEAST LOWER MICHIGAN: Neutral Pattern Leaves Our Summer Weather At the Mercy of Two Key Players - And One Overall; Dubious One

Summer 2012 Outlook For Southeast Lower Michigan
By: Bill Deedler; Southeast Lower Michigan Weather Historian
                                                      May 31st, 2012

Temperatures:

Overall, I look for summer temperatures to average cooler than last summer with closer to normal temperatures to slightly above normal /-1.0 to +2.0 degrees/. Local analogue data for this summer generally shows a variable summer temperature pattern as would be expected with negligible Pacific effects. More importantly for this summer are recent upper wind developments and projections for these upper wind patterns. Several models (see below) suggest the ridging over the High Plains eastward into the Mississippi Valley; will periodically expand east across the Great Lakes and East bringing heat into the region. In spite of the strong upper ridge however; will be the occasional influence of the upper level low and trough that made itself known this spring over eastern Canada when it still was able to penetrate; albeit infrequently, well south into the Great Lakes and Ohio Valley eastward to the East Coast.

Overall; the strong ridge is expected to continue to be a dominant player and will oscillate from the center part of the country to the east; bringing the periods of heat. Normal to below trends will be brought about by the dubious North Atlantic Oscillation /NAO/ cycling lower into neutral to possible negative phases (more below) which would aid in emphasizing the upper low and troughing over central and eastern Canada. Look for the number of 90 degree days this summer to closer to the normal /8 -14/.

Rainfall:

Overall rainfall this summer is challenging due to this past spring’s variable pattern. Recent patterns have been drier than normal conditions across the Ann Arbor into metro Detroit area. Wetter than average weather from the center part of Southeast Lower Michigan (around Flint into Port Huron) with about normal rainfall across the Saginaw Valley and Thumb Region. As I look into the summer; I feel this basic pattern will continue with normal to above rainfall from the I-69 corridor north; but normal to below south. Storm trends and severe weather are discussed under summer analogues.


Broad Scale Discussion

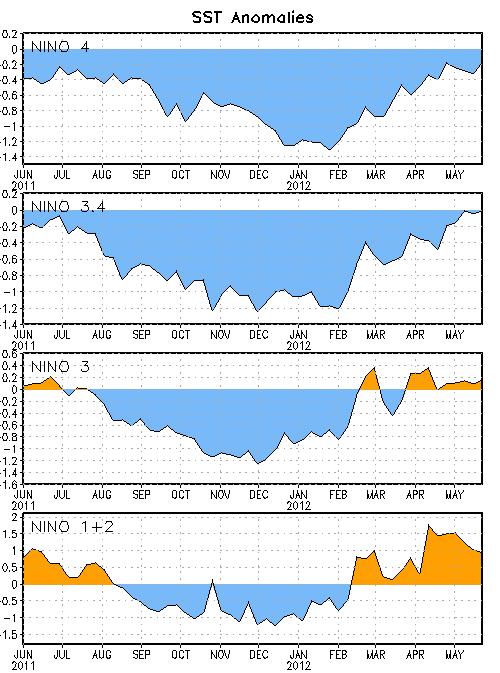
Last summer, generally Weak La Nina to Neutral conditions prevailed over the eastern Pacific through the summer. Then; another La Nina, albeit weaker than the Winter of 2010-11, formed again this past winter (2011-12). Recently, water temperatures  moderated this spring to again, near normal or neutral conditions  (Fig-1a).

                                                    Fig-1a

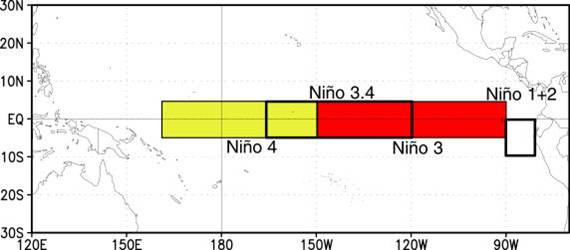
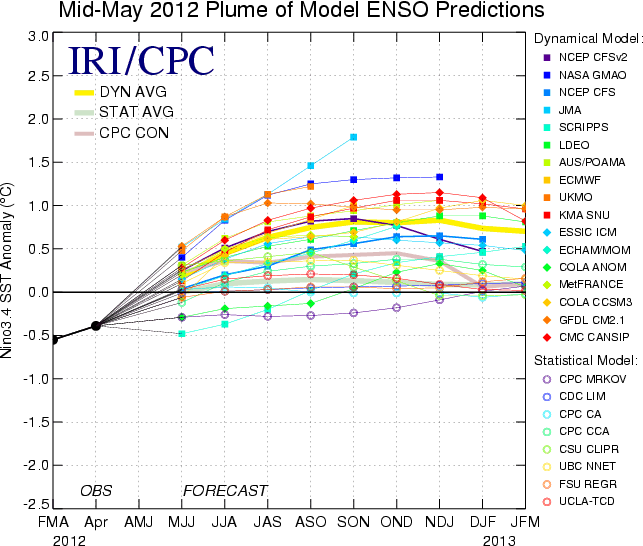
As one can see with Fig-1b/1c (location of Nino 3.4 and the projected sea surface temperatures /SST/ for the summer), the majority of model members are projecting a continuation of the recent warming (or moderation) of the sea surface temperatures /SSTs/ in area Nino 3.4. Latest mid-May guidance continues neutral conditions thru the summer with possibly a weak EL Nino commencing as early as late summer or early fall.
                                                                       

                                                     Fig 1b
           
                                       
                                           Fig 1c


Looking above at each specific dynamic model above shows they generally are in the same camp with the gradual warming expected to continue into summer and by late /JAS/, project just a hint of above normal readings. Under these conditions little, if any, significant downwind affects are slated for the Great Lakes. While there are some affects seen across the U.S. during stronger La Ninas (as with El Ninos), they are generally negligible when it comes to weak La Ninas, El Ninos or Neutral conditions, especially during the summer months.

Warm trend seen the past year or four seasons: Will that trend remain our friend?

Without a doubt; the most obvious and strongest trend seen by far in our (including much of the nation’s) weather has been the domination of warm, above normal temperatures relating much of the time directly to that dubious NAO/AO remaining in a positive phase (NAO+/AO+)!  The unprecedented string of nearly continuous positive NAO/AO; especially the last three seasons of Autumn 2011, Winter 2011-12 and Spring 2012 has been astounding!

While this persistence has been almost unreal; will it continue especially since it’s gotten “so long in the tooth”? It is difficult to go against such a strong trend but sooner or later all “good” things come to an end. The very recent pattern change seen first very weakly early April, then again in early May and now; much more pronouncedly in late May into early June may be an early sign of a change (or at least back to some sort of “normalcy trend’). Then again; a recent change does not a long term pattern make. At this time it would be prudent to watch for more repeated break-downs in the NAO/AO to more neutral to negative territory. Therefore; I have chose to incorporate this recent trend in my forecast, somewhat.
    

Selected  Projected Model Data for the Summer of 2012

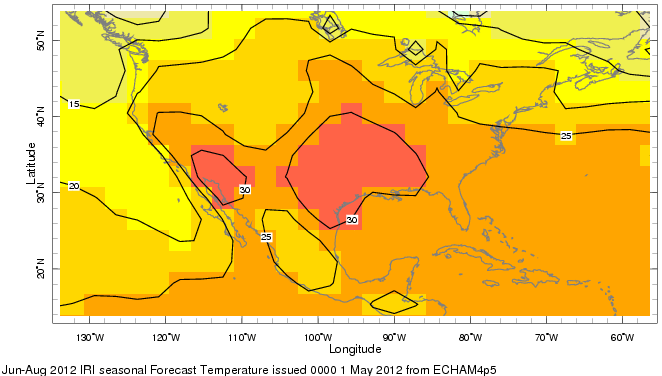
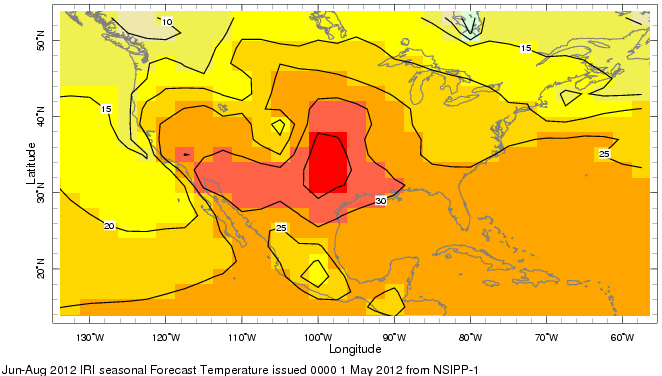
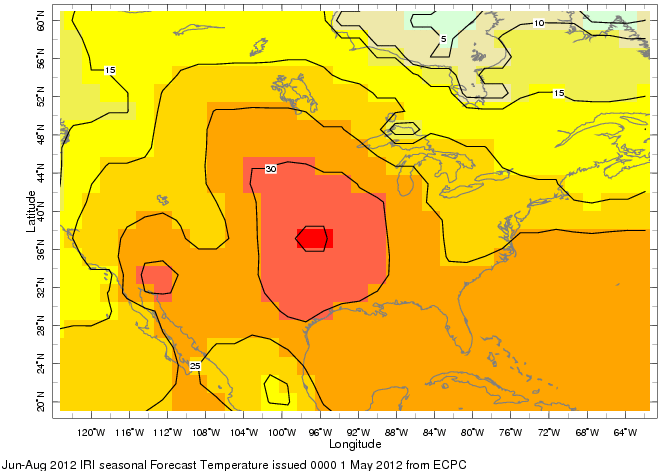
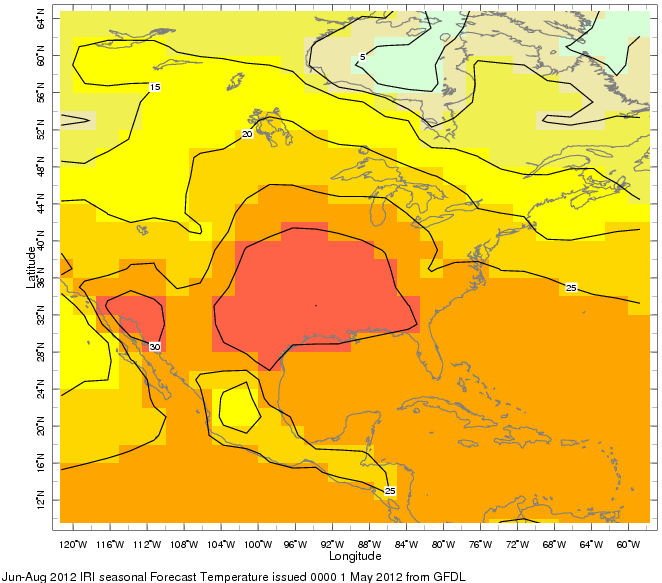
The following temperature /C/ projections are from various named models for the summer.


All models show the general build up of heat (ridge) from Texas northward with a few suggesting a bit more north-northwestward. This summer pattern is almost a given; the big question is where exactly will the ridge and the eastern Canadian trough place.  With some models hinting at the ridging placing in a “north by northwest” position this would be important since it would allow more periodic digging of the Canadian trough and subsequent cool downs for at least the Great Lakes. It also could imply some retrograding of the main eastern Canadian Low at times which could bring more extensive cool downs, depending on its strength. And; while on that upper wind wind scenario, check out below what I feel gives the best representations of the 500 MB pattern projected for this summer.

              
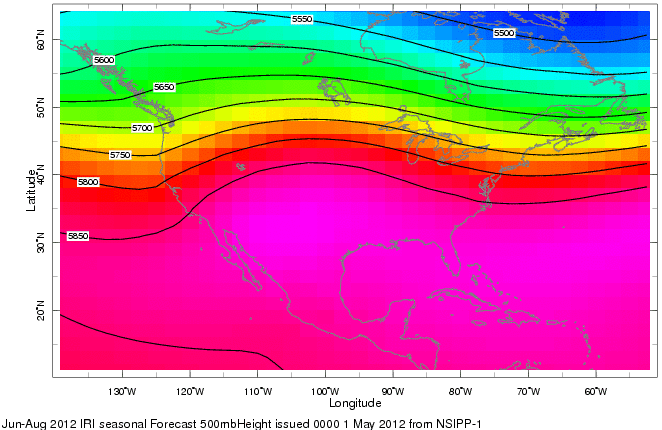
                                             500 MB  Projection A  - NSIPP____  _______
          

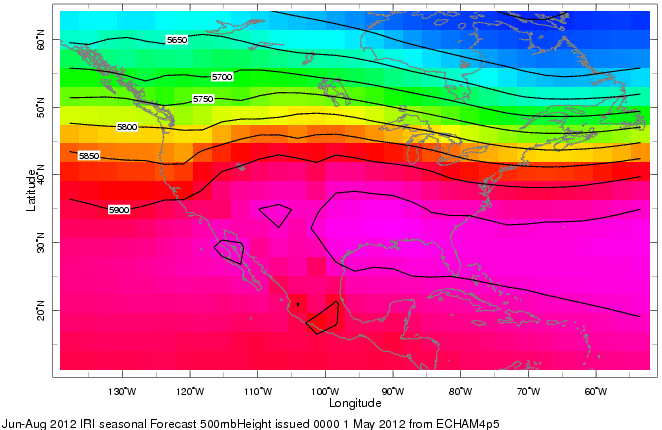
                                             500 MB  Projection B  - ECHAM____  _______


I like both of these projections upper wind projections because:

A) The NSIPP-1 model because of it’s general placement of the 500 MB long wave  summer ridge (from Texas northward into the Dakotas but with expected occasional eastward building) and long wave trough extending from the Eastern Lakes into New England.  Mom Nature, I feel has already shown her hand this late spring for our summer pattern. The notable ridge that has been in place and dominant and to a somewhat less extent; the Canadian upper low and trough - both key players.

B) The ECHAM4 model because of its somewhat flatter pattern with weak short waves (impulses) topping the ridge instigating storm action.

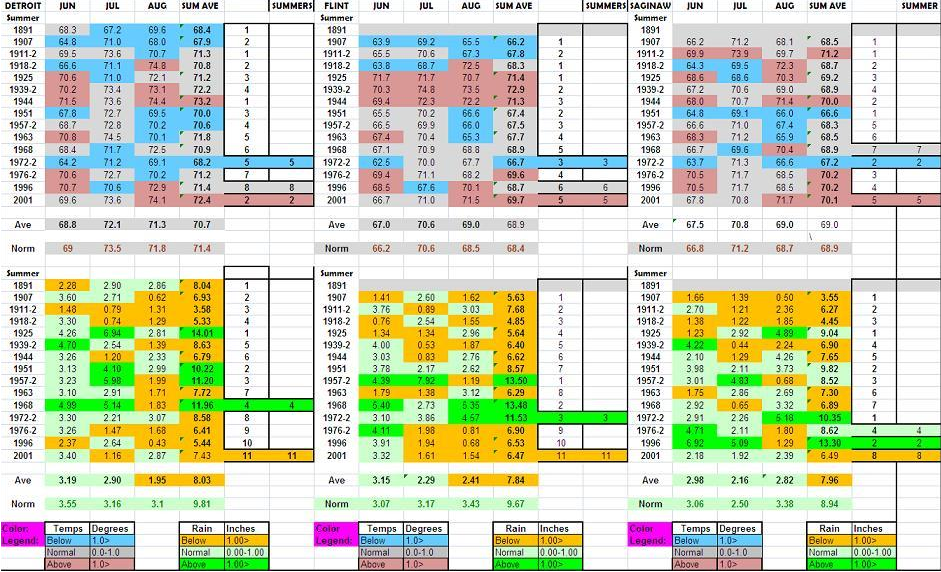
I researched both upper air patterns from past analogue summers (below) and they seem most realistic and in conjunction; will serve up our summer weather.

    2012 Analogue Summers  


                                     (Click on Analogue chart to enlarge)


Note: The number 2 on some years denotes the Neutral conditions came after a second La Nina. The general cycle was: La Nina-Neutral-La Nina-Neutral. Also; the 1971-2000 norms were used reflective of less contamination of the heat island affect (DTW). They are closer to the century average used in composite maps norms of 1895-2000 and recently used in previous La Nina to Neutral analogue patterns.

Analogue Summer Trends

Looking at the trends seen in the analogues suggest the summer temperatures will be mixed with the dominant trend more difficult to peg. While the upper warm ridge has been dominant this spring; the recent appearances of a negative NAO along with the evolution of the trough in Canada hints at this more mixed pattern seen in the analogues for the summer. 

While most years were drier than normal, when it was wet, it was wet! When looking at just the statistics (of which I’m really not a fan of since they generally don’t tell the whole story), the odds this summer’s rainfall will come in an inch or more below normal are about 70%. In the past, when chances were that high in the analogue years, it was usually the way to go. What is troubling this time is when the rainfall came in above normal, it was well above normal! This says to me there is a decent potential of some extended battling of air masses and thus, some stalling of fronts (not to mention a higher risk of a forecast bust). The upper air pattern seen late spring could easily evolve into one of these patterns as the summer heats up and the trough in Canada holds somewhat tough, somewhere a confluent zone will likely set up along with heighten severe weather risks. At the same time, a dry or drier spell this summer looks just as likely and there‐in‐lies the problem. In this type of dilemma; the existing pattern of the location of previous rainfall pattern seems suitable.

Analogue Composite Maps Discussion:

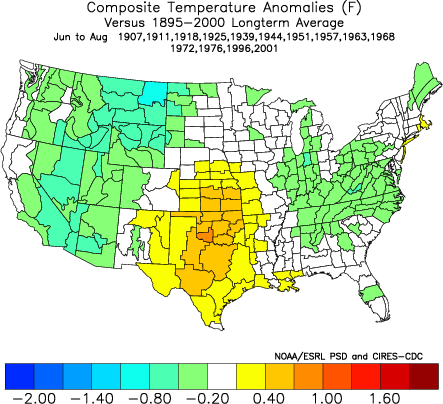
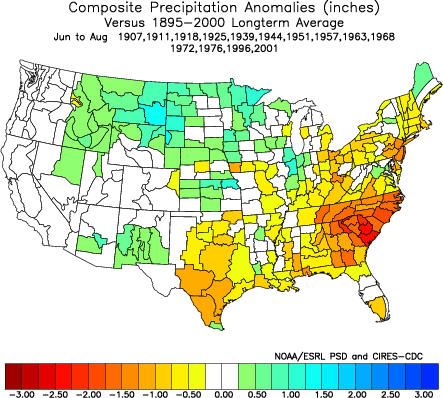
Analogue composite maps below reflect nicely the overall pattern suggested by the computer models for the summer. A Broad ridge extending from Texas northward (first NSIPP 500 MB map) but also hint at the flatter ridge with short waves rotating through the mean ridge (ECHAM). Of course; these maps reflect what happened and are only another piece of guidance. I feel they represent the overall pattern expected this summer. Take note; the average temperatures in the fine scale (ie: areas of green or light blue) are less than a degree below normal.

A few notes on the following composites:
1) Its best to look at the trend of the temperatures or precipitation for entire season. In other words, warm or cool periods don’t always come neatly wrapped up in one month, many times a trend is seen overlapping from one month into another The whole season may indeed start out above or below normal but toward the middle or end, temperature departures average the opposite. 

2) The actual numerical departure value above or below for an analogue season projection is not as important as the sign(+/-) ahead of it.
                          
                             
                                     ANALOGUE SUMMERS 2012 MAPS
                               (based on the 1895-2000 average)


Taking into account written above about analogue precipitation trends (very wet versus dry); they are less helpful since they represent the average of all the years.


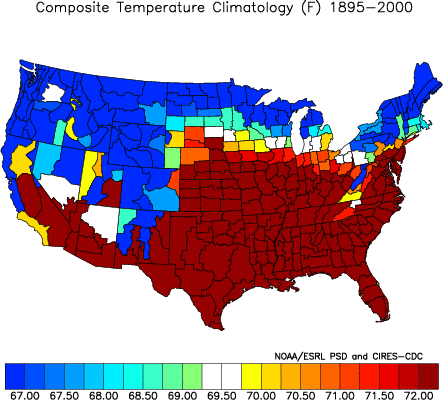
              Since this average temperature departure is derived from the 1895-2000
average temperature (as opposed to the 30 year norm), it would be nice
to know what the summer average (s) are in Southeast Lower Michigan
for that century plus period.


Actually two temperature averages are displayed for Southeast Lower Michigan.
Area-1 paints much of Southeast Lower Michigan (roughly from the Flint and
Port Huron areas south to the Ohio border), while Area-2 encompasses the
Saginaw Valley and Thumb Region. Note history tells us that the Saginaw Valley
and Thumb Region summers are a few degrees cooler on average than the
remainder of Southeast Lower Michigan.

Area-1 displays a summer average of about 70.5
Area-2 displays a summer average of about 68.5

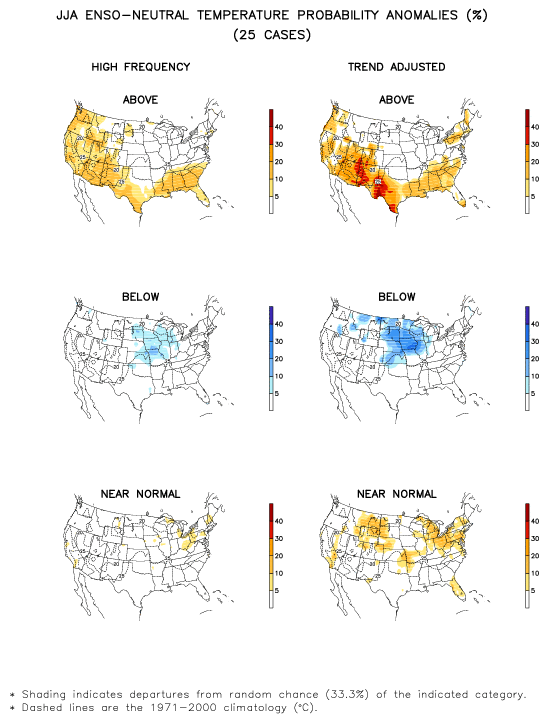
Since it is expected that Neutral conditions will prevail during the summer, it might be worthy of a look at past effects over the country when Neutral conditions existed. The top maps denote above normal, the middle below and the bottom, normal. This agrees with our local data of the dominance Note, the Climate Prediction Center /CPC/ explains these two categories (high frequency and trend adjustment) this way:

There have been significant trends in precipitation and surface air temperature
at many locations in recent decades, so it is worthwhile to examine the influence
of trends on ENSO composites.  For this purpose, two basic types of composites
are examined:

  • High-frequency (denoted HF) composites
  • Trend adjusted (denoted TA) composites


If conditions warrant, an updated Summer Outlook will be sent.

Have a good summer, enjoy any time off and may good weather be
your traveling companion.

SUMMER BEGINS: JUNE 20th at 709 PM EDT

Making weather fun while we all learn,
Bill Deedler -SEMI_WeatherHistorian

May 31, 2012

Cool Low Pressure System To Bring Needed Rain To Southeast Lower Michigan.

A low pressure system with good dynamics and moisture supply will bring a steady rain to much of Southeast Lower Michigan Overnight into Friday morning. As mentioned earlier this week; this low pressure system's makeup is more like that of a winter-type system rather than a first day of meteorological summer /June 1st/.

Looking at the system and track below does remind one of a good snowstorm in the making for Southeast Lower Michigan. While temperatures will be cool they will be no where near winter-like. As mentioned; the storm center and lower pressure are will bring a steady cool rain to the area; mainly totally .50" to locally as high as an inch.

Much of Southeast Lower Michigan has been on the dry side recently with the early growing season upon us; so this rain will be a welcome sight. This notable change to the upper and surface level pattern; resulting in cooler weather (when compared late May's warm pattern) looks like it will stick around for possibly the first week of June.

Making weather fun while we all learn,
Bill Deedler -SEMI_WeatherHistorian

May 28, 2012

An Impressive Cool Shot To End an Impressive Record Warm Spring (Mainly Due to March);

After a record or near record warm spring; a rather breezy and cool fresh air mass  for ironically; the season change to meteorological summer, will surge into the region the last few days of May and hold into the first few days of June. This much cooler air mass (with a upper level tag from the polar region) will change the record high air mass in place on Memorial Day to normal; then below normal temperatures to close out the month/season. While starting out the week in the 90s for Memorial Day; cooler weather will infiltrate the region in several waves. The first of these being tonight into Tuesday morning and this most important wave will be accompanied scattered showers and thunderstorms.

Another system is slated develop late in the week on the parameter of this "polar air mass" and shoot thru the Lower Great Lakes. Interesting and also ironic; as winter snow buffs were looking for some sort of semblance to this type of system back in the cold season. This low on the models has been showing many preliminary characteristics of a winter-type low pressure for development and track thru the region late in the week. While temperatures will be cool; no winter type precipitation is expected. I will update about this system as it plays out on guidance, also.


Much of the southern half of Southeast Lower Michigan could use the hopeful rain as it has been rather dry; NOT a good time in the growing season for fellow gardeners and farmers. Check out these precipitation stats for Detroit, Flint and Saginaw for the spring and May thru the 27th:

DETROIT:
MAY TO DATE   1.34      NORM 2.93   -1.59           LAST MAY 5.13 
SINCE MAR 1    6.44      NORM 8.11   -1.67    LAST SPRING 14.35

While it's been dry this spring the BIG news here is the comparison to last spring when it was SO WET. Basically; up to date we've had half the rainfall of last spring /14.35/. Of course, further north around Flint because of the flooding rains earlier in the month on the 3rd and the 4th; it's a different story. 

FLINT:
MAY TO DATE 6.87       NORM 2.68 +4.19             LAST MAY 6.90 
SINCE MAR 1 10.23      NORM 7.48 +2.75      LAST SPRING 16.29

Ironically; last May and this May are neck in neck for rainfall at Flint but even with the earlier flooding rains this May, it is nowhere close to last spring's total rainfall to date /16.29/!


The Saginaw Valley region was drier but heavy rains trekking southeast across the region Sunday put an end to that; and the area is now on par to be closer to normal for rainfall both May and spring.


SAGINAW
PRECIPITATION: MAY.... 3.62   SPRING.... 7.30

As mentioned; we are still expecting scattered showers and storms overnight into Tuesday morning, then a slight chance Wednesday. So these totals are likely to change.


Making weather fun while we all learn,
Bill Deedler -SEMI_WeatherHistorian

May 22, 2012

Frontal Boundary to Lurk in the Southern Great Lakes Memorial Weekend? /Update/

Update 5/24/12:
Really see no need to update previous blog thus far. I was asked (comment section); "What is the most likely time period for showers and thunderstorms on the weekend? I answered this would not be an all the time thing with most likely time period from mid Saturday to mid Sunday. Hopefully; any activity will be of the nocturnal variety and be over Saturday night. The risk of storms pops up again late Memorial Day itself; with a little luck much of that activity will again, hold of till night.  

----------------------------------------------------------------------------
Just a quick heads-up about the upcoming Memorial Day Weekend: 5/22/12

Model Projections to varying degrees are intimating a rather strong push of energy behind a cold front slated to be draped across the Upper Midwest, Thursday into Friday. This front is expected to be pushed southeast across the Lakes Region on Friday into Saturday. How far south the front is able to penetrate a strong upper ridge building with time over the Ohio Valley; will determine the fate of our Memorial  Day weekend weather.

As of early this week; I'm seeing the likelihood of the front drifting at least as far south as the Southern Lakes Region sometime Saturday before slowing; and then stalling in the Southern Lakes/Northern Ohio Valley Region. We are still early in this warm season and thus; the Great Lakes are not the warmest. Generally with the relatively cool Lake waters late in the spring; they aid in the progression south with these type of somewhat shallow cold fronts. This is; in spite of the building upper level heights and subsequent high pressure ridge development aloft. In this early time frame; current thinking is the best chance for showers and thunderstorms would be Saturday into early Sunday. The timing and location will be highly dependent on positioning of the front and possible storm development on decaying storm outflow boundaries.  Also; later on Memorial Day itself there may be a risk of storms as a cold front approaches but this too far out to even speculate at this time.

So in one sentence: This front is looking more like it will goof-up part of the Memorial Day weekend over Michigan before retreating back north.

As we get closer to Memorial Day weekend; I will update the most likely scenario. 

Making weather fun while we all learn,
Bill Deedler -SEMI_WeatherHistorian

May 14, 2012

What a Rude Awakening; The Derecho of May 31st 1998!

I remember it like it was just a few years ago; the Derecho of May 31st,1998. I'm sure all on shift will also remember that morning as many of my co-workers and the MI-CON DTX team, stayed overnight from the evening shift Saturday due to the violent weather that was taking shape upstream and expected locally. Ironically; my new and admired boss, Mr. Richard Calcaterra arrived on the scene from what I remember was his first day after relocating from Tennessee. He came in early that Sunday morning to assistance me and then later; to relieve this fatigued weatherman who had been on duty since at least 4 PM Saturday.

Meteorologists, severe weather weenies and all others; take a look at this radar loop! This derecho plowed through Lower Michigan with a forward speed at around 70 miles an hour; tearing up the countryside as she trekked mainly east across Southeast Lower Michigan. Just as captivating, is this longer term radar loop from the Storm Prediction Center /SPC/. Watch as the derecho surges from the Dakotas, through the Upper Midwest and into the Great Lakes from Saturday evening into Sunday morning. And, just as intriguing; note as the cooler intense outflows from the primary line as they plow into the warm and very unstable air mass; giving birth to new lines of severe storms as they join in the "attack"!

It was just after dawn, when that previously eerie tranquil silence of the Sunday morning was shattered by this ferocious evil side of mother nature! I prepared the weather balloon ahead of the squall, just after 6 AM EDT and released after 7 AM. Meanwhile; winds were gusting up to 100 mph out west along Lake Michigan at Muskegon and Holland; and then shortly after at Grand Rapids. Across Southeast Lower Michigan; wind gusts /mph/ that were clocked in the 60s, 70s and some 80s were all too common as this intense severe weather squall flattened or damaged a widespread hunk of Lower Michigan!

There were two deaths attributed to the storms; resulting from falling trees. One death occurred in Pinconning in Bay County as a tree fell onto a house; while the other death one was in Huron county when a tree fell onto a tent with two occupants in Port Crescent State Park. Ironically (or maybe not), two injuries that occurred in Holly (Oakland County) were also a result of a tree falling onto a tent. The damage across Southeast Lower Michigan was most concentrated from Detroit's northern suburbs north across the Flint, Saginaw Valley, and Thumb regions. An earlier write-up on the Derecho of 5/31/98 originating at DTX can be found here; while another from SPC is located here along with a great tutorial on derechos.

Look for my Summer 2012 Outlook due out the last week of May.

Making weather fun while we all learn,
Bill Deedler -SEMI_WeatherHistorian

May 3, 2012

Late Frost/Freezes Across Michigan Have Ruined More Fruit Tree Crops That Initially Thought

It was bad enough when we had the late March hard freeze but to get more frosts and freezes over portions of the state in mid-late April was just too much for many fruit tree crops this year.

Note: video explains a lot.