SUMMER 2025 OUTLOOK
TEMPERATURES:
All researched data including current trends indicate normal summer temperatures while the analogues alone (in entirety) lean toward a slightly cooler summer (or 0.0 > -1.0 below) normal. The main issue with the analogues are the notable cooler summers in the first half of the sample from the late 1800s into the mid 20th century /1894 - 1950/. Temperatures averaged cooler back at that time when compared to today's updated warmer normals due to climate change and urban sprawl/heat island.
Considering all mentioned:
I look for normal or average summer temperatures /June - Aug/ with temperatures in the final analysis averaging -1.2 to +1.2 degrees of current normals. Best chance of temperatures averaging normal to below should occur into mid June...then above/below from mid June to mid July...then normal to above mid summer into early autumn.
RAINFALL:
All
researched data suggests normal rainfall but also either below/above normal rainfall for summer must be considered and recommended. While there
were some moderately wet summers, they were still at a minimum but then again; occurred in the analogue later years. This proves even more problematic since the wet area summers were more split with drier areas north and wetter areas south. It is quite possible southern areas of Southeast Michigan end with normal to above normal rain or visa-a-versa. . The wettest
summer by far was the cool and wet summer of 2000 (No repeat, please)!
Most summers
indicated at least one notable dry spell, typical for summers in these parts
with the majority of analogue years showing one notable (an inch or
more) rain deficit month. We will visit this again during my mid summer update in July.
First a word or two about the two new additions on the Analogues...
1 - 90 Degree days; Just what it says, the annual amount of 90 degree days. If the Annual wasn't available, N/A. * Next to the lowest and highest amount of 90s.
2- Thunderstorm Days; the annual amount of thunderstorm days and highest month and total. If annual is N/A, then month(s) and * next amount(s) that were the highest/lowest.
HEMISPHERIC TRENDS
The
weak La Nina ENSO pattern of last winter is all but a memory as we
enter summer, we are entering a Neutral Pattern. The basic Neutral
pattern with near normal sea surface temperatures /SST/ should be with
us through much of the summer with an edge to a weak El Nino
surfacing by late summer but more likely, autumn. At this point; it should be noted various LA Nina weather patterns still show up in upper air patterns but are expected to "minor-out" through the summer into the fall.
Dynamic
and Statistical models have converged on the weak downward sloping trend
from a Neutral stance to possibly a very weak La Nina again into the autumn. CFSv2 ENSO pretty much flat-lined in the Neutral stance into the winter. Therefore; generally Neutral is projected into the fall, anyway.
Below is the American CFSv2 model which holds a bit tighter to a Neutral stance thru the summer and early Autumn.

What do the computer models paint for the summer?
Most
models are generally in remarkable agreement for the summer patterns
across the Great Lakes resulting temperatures and rainfall predictions.
TEMPERATURES
Looking
at the American CFSv2 model intimate chances are strongest for normal to
slightly above normal temperature summer.


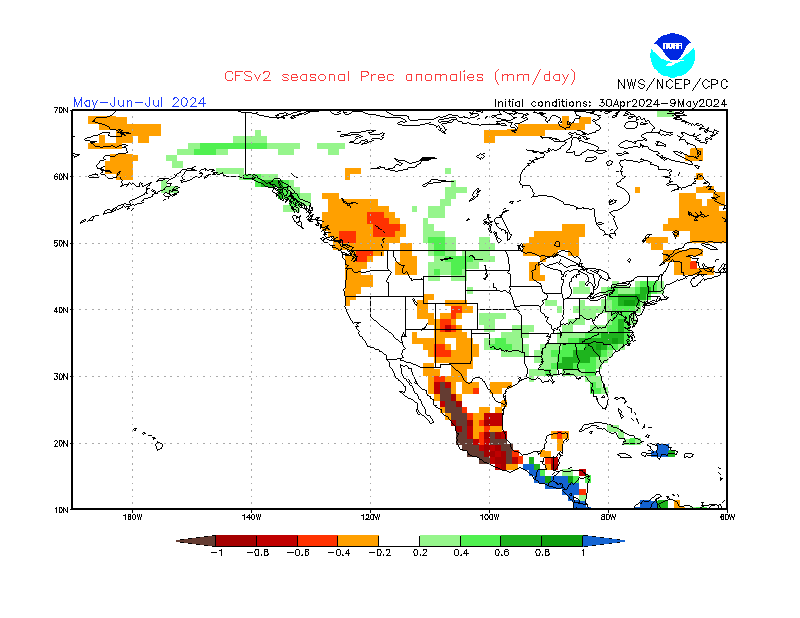
RAINFALL
Looking at the American CFSv2 model nicely displays the dilemma of the rainfall expected for the summer. Ironically like the long tern analogues below; it "fine-tunes" the below normal rainfall to the north-northeast of the region and above normal south-southwest of Southeast Michigan.
 |
The foreign models mainly leave the region in equal chances of above normal to below. Like the CFSv2 model it brings the heavier rainfall south (this time in the central Ohio/Tennessee Valley) while drier conditions are extensive over the Plains and west/south.

500 MB Upper Air Projected Pattern
Projected upper air patterns for the summer from the canSIPS model reflect a pattern I feel is the most representative for the country with ridging establishing with time over the Midwest west into the Plains and retrogressing somewhat toward the west with time.


Try to get out and enjoy your summer weather! My next Summer 2025 update will be mid summer.

Making weather fun while we ALL learn,
Bill Deedler - SEMI_WeatherHistorian