1/26/22

44 years ago Jan 26-27TH, 1978 ~ A GREAT STORM IS UPON MICHIGAN"

THE GREAT BLIZZARD OF 1978!

Written by: William R. Deedler, Weather Historian - Southeast Lower MI

While I worked countless snowstorms in my long career with the NWS; the two most impressive storms were in order: the January 26-27, 1978 Blizzard and the December 1st, 1974 snowstorm. The huge snowstorm of December 1974 was quite noteworthy in the amount of snow that fell continuously for hours over the Detroit Metro area and portions of Southeast Lower Michigan.

A more powerful (in terms of intensity/extent) storm and remains of strong interest to all meteorologists who have studied winter storms in the Great Lakes is the January 1978 Blizzard. This storm is also of interest and remembrance to many longtime residents of the Great Lakes, the Upper Ohio Valley and Ontario, Canada who had to deal with winter's full fury late in January of 1978. In addition, the storm certainly casts many memories for those of us (author included) who were on duty and worked during the storm while observing in tremendous awe the development and subsequent immense strength of this great monster. With the 44th anniversary of this Great Blizzard at hand, it is worth taking a step back in time to re-live this monumental example of nature's fury.

While there are several contenders for the worst blizzard ever to hit the Great Lakes in relatively modern times (since 1870 when records began in Detroit), the immense and intense Blizzard of January 26-27th 1978 must rank at or near the top along with the Great White Hurricane of 1913 with its similar track and powerfulness.

The incredible Blizzard of January 26-27th, 1978 evolved out of a winter that was infamous for cold and storms. The Winter of 1977-78 thus far had been one the coldest, since records began, in many areas from the Rockies eastward to the Appalachians. Mammoth blizzards occurred late in January and early February from the Midwest to the East Coast as strong Arctic plunges dove south into the country and met up with the warmer winds from the deep south. The winter of 1977-78 was similar to its predecessor (1976-77) in terms of cold. The main difference between the two winters, however, came in February. In 1977, temperatures moderated rapidly during February, while in 1978, the cold actually worsened - with several locations reporting their coldest recorded February to date. The Winter of 1977-78 is written down in the record books as Detroit's seventh coldest winter, Flint's fifth coldest and Saginaw's sixth. West of the Rockies, it was a different story as a dominant upper ridge of high pressure provided a relatively mild winter, with some stations even reporting one of their warmest winters on record.

The Great Storm


Since there were some forecasting variances of the intensity and track of the storm, and considering the primitive model of the day (LFM - Limited Fine Mesh), forecasters did an admirable job in forecasting one of the most severe winter storms ever to hit the Great Lakes Region.

A Winter Storm Watch was posted as early as Tuesday night, the 24th, for the southern half of the Lower Peninsula for Wednesday Night into Thursday. Gale Warnings for the Great Lakes were hoisted the following Wednesday morning, along with the Watch. A weaker system had moved through the region earlier during the day on Tuesday and already dropped some snow on the region (a Winter Storm Watch had been issued for this system as well, earlier on Monday, the 23rd). After Tuesday's snow, the headline on the Special Weather Statement that was issued by the NWS Tuesday evening read as follows: "Another Winter Storm Threatens Lower Michigan" and thus, a second Winter Storm Watch was officially posted.

Meanwhile, the ingredients of what would later prove to be a truly fascinating yet vicious winter storm were coming together from different parts of the country. As with the "White Hurricane of 1913," the massive storm actually began as two smaller but distinct storms. A strong low pressure with an attending arctic air mass was entering the Northern Plains by way of Northern Minnesota on Tuesday evening (24th). At the same time, another developing low pressure system was taking shape over the eastern Texas/Louisiana area.

The phasing of two distinct jet streams aloft proved to be the key as to the subsequent strength and massive extent of the storm. A very strong and energetic Arctic impulse surged almost due south and plowed the Arctic front through the Northern Plains late on the 24th. At the same time, another very strong upper wind impulse surged south through southern Arizona. These two jet streaks made up the larger North American jet stream as a huge upper ridge of high pressure along the West Coast of the U.S. diverted the powerful Pacific Jet north into Northern Canada. This northern jet (containing a wind max of 110 knots) then dove due south, like on a giant roller coaster, across the western U.S. as the second, subtropical jet (with an even stronger wind max of 
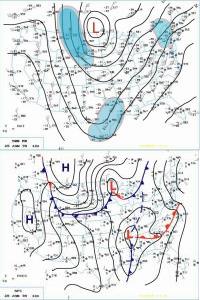
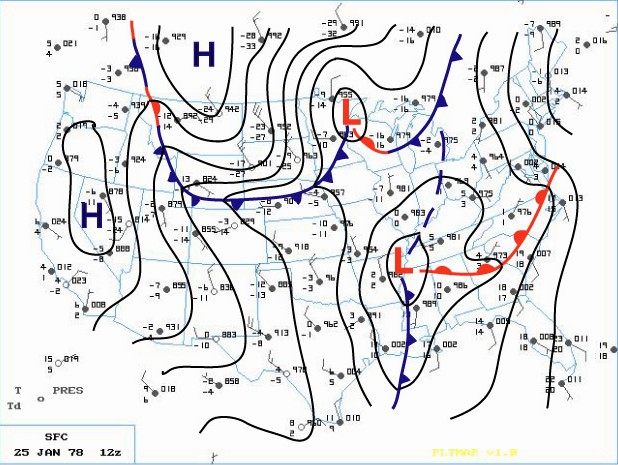
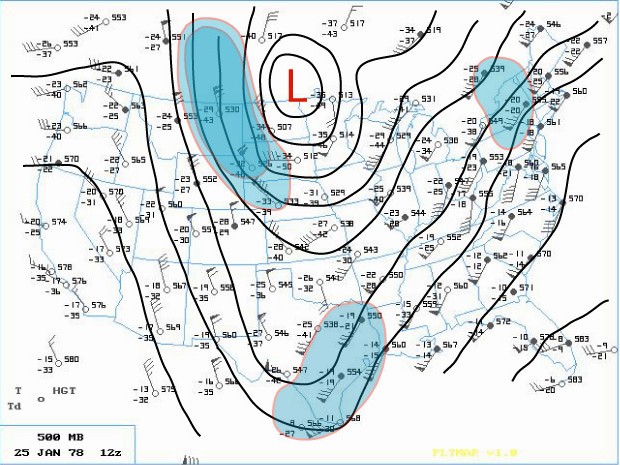
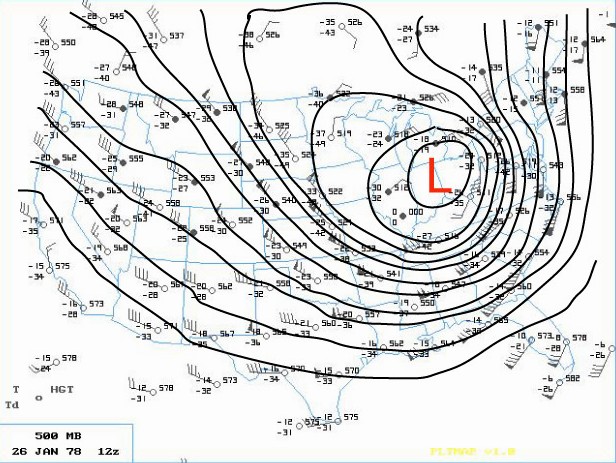
130 knots) surged across southwestern states. On Wednesday (25th), a deepening area of low pressure made its way east across the Gulf States into Georgia by evening (surface | 500mb). Meanwhile, across the north, the Arctic front barreled east across the Upper Midwest into the Western Lakes by Wednesday evening.

Earlier that Wednesday morning, the Winter Storm Watch for Southeast Lower Michigan was changed to a Heavy Snow Warning, while a Travelers Advisory was issued for Western and Northern Lower Peninsula. Later, at the issuance of the evening forecast, the entire Lower Peninsula was upgraded to a Heavy Snow Warning. Meanwhile, a rapid deepening of the surface low over the southeast portion of the country also commenced on Wednesday evening. As the low intensified over Alabama and Georgia, Atlanta registered its lowest barometric pressure ever late on the 25th. At the same time, further north in Michigan, snow was falling over much of the Lower Peninsula. In and around the Ann Arbor and Metro Detroit, the snow mixed with or changed to light rain Wednesday night as slightly warmer air surged northwest into that area ahead of the deepening storm.

While the storm was organizing in the lower levels of the atmosphere over Georgia, the Subtropical and Arctic jet aloft began to merge and phase over the Southeast part of the country. This merging of jet streaks contained a wind max of 150 knots which helped induce a rapid intensification of the Georgia Low as it surged northward into West Virginia early on the 26th. Record low barometric pressures were set all along its path as an ominous track (trough) began to materialize toward the Eastern Great Lakes.

Bands of heavier snow spread north into much of Southern Lower Michigan during the very early morning hours of the 26th. Rain continued to fall, however, over the extreme southeast corner of Lower Michigan. At 1 AM EST, rain was observed at Detroit Metro Airport with the temperature comfortably above freezing at 36 degrees. Further north at Flint, however, sleet and freezing rain were falling as the temperature hovered around freezing. Air pressure tendencies were noted as falling rapidly /PRESFR/ and continued that way for several hours (in fact, several stations in this storms path had to re-adjust their barographs for station pressures traces that were BELOW initial chart scale).

The aforementioned Arctic cold front that was across the Western Great Lakes advanced steadily east into Lower Michigan as the main southern low underwent explosive deepening (this low's central pressure fell 40 millibars in 24 hours)! The central pressure was recorded at 28.28 inches as it tracked north across eastern Ohio, just west of Cleveland, at 7AM EST. As the low moved out over Lake Erie, the Arctic cold front over Southeast Lower Michigan was pulled sharply east into it's mammoth cyclonic circulation. Any residual rain over Southeast Lower Michigan quickly changed to heavy snow and blowing snow during the pre-dawn hours of the 26th. As the Arctic front plowed through the Cleveland area, the wind gusted to an incredible 82 mph! As the Arctic air flooded the Cleveland area, the temperature dropped from a relatively balmy 44 degrees at 4AM EST to a bitterly cold 7 degrees by 1000 AM EST.

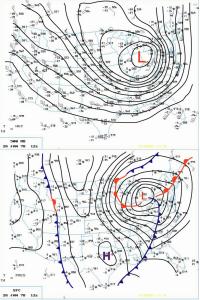
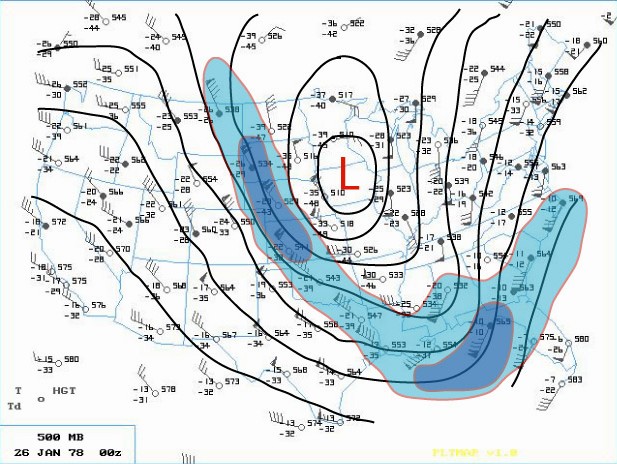
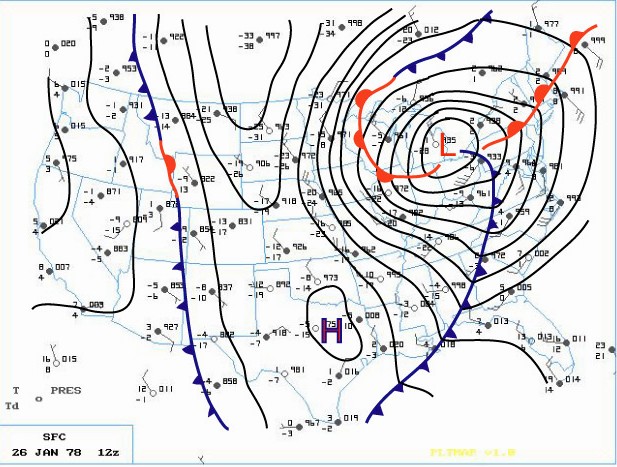
Blizzard Warnings were hoisted across much of the Great Lakes and Upper Ohio Valley Region by daybreak Thursday. The center of the huge storm (surface | 500mb) continued to trek north northwest across Southwest Ontario (roughly between Chatham and London) while Detroit measured its lowest pressure reading at 28.34 inches at 650 AM EST. The incredibly deep center made its way north along the St. Clair River with Sarnia ON reporting the lowest pressure on land at 28.21 inches. Not only was the depth of this mammoth storm's center very impressive, so too was the extent of low pressure from its center. Even locations that were far removed from the storm's center also reported record low pressures. Stations such as Cincinnati OH, Rochester NY and Toronto ON and even as far east as Wilmington N.C., all recorded record low pressure readings from this monster. In fact, at Toronto, where records go back as far back as 1840, the lowest pressure reading of 28.40 inches broke the old record of 28.57 inches by 0.17 inches. In addition, dozens of other cities, with records going back a century, also recorded their lowest pressure reading of all time or, for at least the month of January. This massively intense storm was responsible for strong wind gusts as far away from the center as Boston /72 MPH/ and Chesapeake Bay Bridge /90 MPH/ with even damaging winds reported as far south as Tallahassee FL.

As the Arctic air circulated throughout the storm while it made its way over Lake Huron, the lowest pressure was reached around 950 millibars or a hurricane-like 28.05 inches! "A Great Storm is Upon Michigan" read the headline of the 800 AM EST Special Weather Statement issued by the National Weather Service Forecast Office in Ann Arbor that Thursday /26th/ morning. Heavy snow and blizzard conditions were extensive as wind gusts in excess of 35 mph whipped the snow into huge drifts across much of Southeast Lower Michigan. Other areas of Eastern Michigan, Indiana and Ohio reported near hurricane-force winds, heavy snow and temperatures hovering between zero and 10 above, resulting in extreme blizzard conditions. These conditions later expanded further east into Pennsylvania and West Virginia and prevailed into the night (26-27th) across much of the Eastern Great Lakes, Southern Ontario and the Upper Ohio Valley. With the storm generating copious amounts of snow and very strong winds, whiteout conditions were widespread. All land and air traffic came to a stand still in the affected regions. Several major roads were closed for at least two to three days, if not longer, while clean up got underway. Numerous NWS employees were stranded at work, home, or on the road somewhere between the two. Several employees worked double shifts into at least Friday (some longer) because of the impassable roads with others simply unable to get to work.

The Blizzard Warnings were allowed to die across Michigan during the forenoon hours of Friday, the 27th. Record 24 hour snowfall totals from the storm included, 16.1 inches at Grand Rapids, 15.4 inches at Houghton Lake and 12.2 at Dayton, OH. Snowfalls for the entire storm (25-27th) included a whopping 30.0 inches at Muskegon (some of which was Lake Michigan enhanced), 19.3 inches at Lansing and 19.2 at Grand Rapids. Snowfalls were less over Southeast Lower Michigan (mainly because of the rain that fell for a period) and included 9.9 inches at Flint and 8.2 inches at Detroit.

The following is a quote from the summary written about the storm by Meteorologist in Charge, C.R. Snider on January 30th, 1978 at the National Weather Service Ann Arbor:
"The most extensive and very nearly the most severe blizzard in Michigan history raged throughout Thursday January 26, 1978 and into part of Friday January 27. About 20 people died as a direct or indirect result of the storm, most due to heart attacks or traffic accidents. At least one person died of exposure in a stranded automobile. Many were hospitalized for exposure, mostly from homes that lost power and heat. About 100,000 cars were abandoned on Michigan highways, most of them in the southeast part of the state."
The employees of the National Weather Service Forecast Office in Ann Arbor had just set up shop at the new quarters at the Ann Arbor Federal Building a WEEK before the storm hit. The forecast staff had transferred from the Detroit Metropolitan Airport Office while the observing and radar staff remained at the airport. The majority of employees still lived in and around the metro Detroit area and all major roads between Detroit and Ann Arbor were blocked for approximately 18 hours due to the storm. Several employees put forth efforts beyond the call of duty, stated Mr. Snider in his storm report.

Yet, as mentioned earlier, the Winter was not yet over by any means as the month of February (after the storm) was brutally cold across much of country. The below normal temperature departures of February 1978 were strikingly similar to that of January 1978 (and in some places, February was actually colder). The average temperature for Detroit that winter came in at just 20.5 degrees /normal 27.1/ which again, made it the seventh coldest winter on record. Snowfall totaled a hefty 61.7 inches which made the winter of 1977-78 the ninth snowiest winter on record in Detroit at that time. Flint's average temperature of 19.1 degrees made it the fifth coldest winter on record, but Flint received less snow than Detroit with 50.6 inches. Saginaw's winter average temperature of 17.9 degrees made it the sixth coldest winter on record and was accompanied by 55.6 inches of snow. The 1977-78 snow season at both Flint and Saginaw has since dropped off the top 20 snowiest winters list.

More on the storm in surrounding areas can be found here.

https://www.ncdc.noaa.gov/news/using-regional-snowfall-index-evaluate-great-blizzard-1978
http://www.mlive.com/news/grand-rapids/index.ssf/2017/01/surreal_snow_scenes_from_the_b.html

https://www.youtube.com/watch?v=YuAMWRtT4NY
http://nbc4i.com/2017/01/25/remembering-the-blizzard-of-1978/


Making weather fun while we all learn,
Bill Deedler -SEMI_WeatherHistorian


1/23/22

THE DR. JEKYLL / MR. HYDE WINTER OF 1899-1900

So even though the winter of 2021-22 thus far is nothing to crow about, they thought the same thing around Southeast Lower Michigan in the Winter of 1899-1900. Through January 1900 just 9.4" of snow fell that winter up till then. Thus far this winter through Sunday 1/23/22; we've done a little better with 16.4” falling through Sunday at Detroit including today's light snow.

I wrote this story about the millennium of 1899-1900 winter and what happened the remainder of that winter for the approaching millennium of 1999-2000.

___________________________________________________________________

 
 " PARTY LIKE ITS . . . 1899"
Written by: William R. Deedler, Weather Historian Southeast Michigan 12/99

With all the noise and fuss about the new millennium, curiosity about the weather in Southeast Lower Michigan during the last millennial change (999-1000) and the last turn of the century (1899-1900), lead me to dust off the old weather record books for Detroit. Unfortunately (and not surprisingly), weather records are not available from the start of the current millennium, but what about the last century? What was the winter of 1899-1900, including the holiday period of Christmas into New Years Day, like? Let's journey back in time and see how the 1900's began . . .

THE DR. JEKYLL / MR. HYDE WINTER OF 1899-1900
The winter of 1899-1900 started off on a pleasant, mild and dry note with little snow. Temperatures averaged only slightly above normal in December but more so in January, despite a cold snap at the beginning and end of the month. January, in fact, averaged about five degrees above normal in Detroit. Furthermore, snowfall was only about half the average through January. By the end of January, fewer than 10 inches /9.4/ of snow fell in Detroit, which normally sees a couple of feet by this time. The majority of the storm tracks held north of Southeast Lower Michigan through midwinter, and thus, cold outbreaks and snowstorms were kept to a minimum. Yet, if the inhabitants of Southeast Lower Michigan thought they were going to get off easily the winter of 1899-1900, they were in for one rude awakening, as the latter half of the winter bore no resemblance to the first half.

Sharply colder weather blasted into the region late in January, pushing low temperatures down into the single digits and even below zero /-2/ by the 31st.      All but the first few days of January did the temperatures averaged above or well above normal, that is, until the 26th through the 31st when they averaged better than 12 degrees below normal. Keep in mind, on the average, the second half of January is coldest period during the winter, with average temperatures in the lower 20s (highs around 30 and lows in the lower teens).


The snow-making machine shifted into high gear in February, when right off the bat a snowstorm dumped nearly a foot /10" in Detroit/ of snow across the region on the 4th. However, within a few days, the temperature soared to 62 degrees and was accompanied by nearly three quarters of an inch of rain. What had been 10 inches of snow on the ground the evening of the 4th, was a mere trace just four days later, the evening of the 8th. Colder weather returned the following day, freezing any standing water and creating numerous ice rinks. The colder weather, more or less, held for the balance of the month, along with periods of light snow. That is, until the last day (28th), when another major snowstorm hit the area. A fine, dry snow started early in the morning (2:20 AM) of the 28th and then fell heavily for most of the day. By 8 PM, thirteen inches of snow accumulated with temperatures ranging from the mid teens to mid 20s during the entire episode. At the close of February, twenty-eight inches of snow fell in Detroit for the month alone. This was nearly three times the amount measured in the winter through January and it was by no means over with yet!

The late February storm wound down on the morning of March 1st with a storm total of 14.6 inches. The busy storm track, however, held near Southeast Lower Michigan in March with still another snowstorm just three days later, on the 4th. This time, light snow moved back into the region around dawn and continued all day, again heavy at times, until ending at dusk. About six and a half /6.6/ inches fell during the day along with temperatures falling from 33 degrees at 2 PM, down to 12 degrees at midnight. By this time, a snow depth of nearly 17 inches was observed. And, while winter should have been ending, it was in reality, just beginning.

A little over 24 hours later (during the forenoon hours of the 5th), snow once again began in earnest and continued falling, moderate to heavy, all day. The temperature fell to a low of 7 degrees at 5 AM that morning just before the snow began, but never recovered during the day until the evening, when it rose through the teens. By 8 PM, another nine and a half inches of snow had inundated the area with 26 inches of snow measured on the ground. This 26-inch snow depth is the highest official snow depth ever recorded in Detroit. After the snow depth was measured (8 PM), the snow became mixed with, and then changed to sleet which continued falling until l2:30 AM on the 6th, when it changed to freezing rain. Still, another 3.5 inches of snow and sleet fell from 8 PM until the change over to freezing rain, giving a grand total of 19.6 inches for the three-day period. Also, with the additional 3.5 inches snow that fell, the snow depth probably ranged somewhere in the neighborhood of 28 inches (accounting for some settling and sleet), though no official maximum snow depth was mentioned. In fact, in that week period (Feb. 28th-Mar. 6th), more than 34 /34.2/ inches of snow fell on Downtown Detroit! This snowfall nearly equals the second most snow ever recorded for a MONTH in Detroit, which was during the snowy La Nina December of 1974 when 34.9 inches fell. Also, it is only about eight inches shy of the normal snowfall seen in an ENTIRE winter season /42 inches/.

Needless to say, travel by street car, railroad, horseback, river ferry or just plain walking was a monumental chore. In one note, it was mentioned that it took fours hours for a street car to travel from Downtown Detroit to Trenton (a nearby suburb of Detroit) and back, a trip that usually took an hour and a half with stops along the way. Several street cars burned out their motors trying to plow through incredible amounts of snow. The temperature continued to rise rapidly from the 18 degrees recorded at midnight on the 6th, to an almost springlike 42 degrees just six hours later at 6 AM. This 24 degree rise in temperature was a result of warmer air surging into the area from the south. With the temperatures holding in the lower to mid 40s into early afternoon, the heavy snow cover soon started to become an extremely slushy mess. By 8 PM on the 6th, the snow pack had melted down to 18 inches, dropping better than10 inches in less than 24 hours. Then, by midnight, the temperature fell below freezing to 23 degrees. This created more headaches for travelers with huge blocks of frozen slush and ice and thus, made navigation even more difficult and hazardous.

Temperatures continued to average well below normal into mid month and on St. Patrick's Day, the mercury plummeted to a record low of -2 ( Irish coffee was probably in high demand this St. Patrick's Day). If this weren't bad enough, the snow machine once again cranked daily from the 15th through the 18th, when nearly seven more inches of snow fell. The intra-month period of February 22nd-March 21st may very well have been Detroit's snowiest month /28-day/ time period. Exactly 44 inches of snow fell during that time, this handily beats out the CALENDAR month record for most snow, 38.4 inches, which occurred just eight years later in February 1908 and is also a few inches higher than the average snowfall /42 inches/ for an ENTIRE winter season.

A slow moderation in temperatures took hold during the latter half of the month. Even so, March of 1900 still ranks as the 3rd coldest March (tied with March 1885 and 1960) in Detroit since 1870. And not surprising, with the 30.2 inches of snow that fell during the month, March of 1900 is the snowiest March ever recorded (February of 1900 is the 4th snowiest February). Snow also made an appearance in April /1.5 inches/ and even in May with a trace on May 4th. So, despite the meager snowfall the first half of the winter, the snow that fell the second half more than made up for the deficiency. The total snowfall for the 1899-1900 season was 69.1 inches, which ranks as the fourth snowiest winter season in Detroit since 1880.

CHRISTMAS WEEK 1899 Christmas Eve 1899 began on a relatively benign weather note across Southeast Lower Michigan. A little light rain changed over to light snow during the evening with just three tenths /.3/ falling by midnight. Not quite enough to make it an official white Christmas (five tenths /.5/ or better of snow is needed on the ground) and only a trace fell on Christmas. By the looks of the temperatures, a cold front must have pushed through the area during the daytime hours of Christmas Eve. The temperature reached 34 degrees during the afternoon on Christmas Eve but then fell to 17 degrees by the midnight hour. In addition, that 17 degree reading at midnight was the HIGH temperature for Christmas Day with temperatures steady to slowly falling until bottoming out at 11 above. In spite of being chilly, Christmas Eve into Christmas Day in 1899 were, for the most part, cloudy non-eventful days, meteorologically speaking, with no big storms in sight.

The most obvious trend the last week of 1899 (see Chart-1) was the turn toward colder conditions, but with negligible precipitation (traces of snow). As the week drew to a close, lows were generally in the single digits with an actual "goose-egg" /0F/, reported on the morning of the 30th. Sky condition ranged from partly cloudy to cloudy, so there were periods of sunshine. 

CHRISTMAS WEEK 1899-1900 (DEC. 25TH - JAN. 1ST)
Date High Low Precip. Snowfall Sky Cover
12/25/1899 17 11 T T Cloudy
12/26/1899 18 9 T T Ptcldy
12/27/1899 20 12 T T Ptcldy
12/28/1899 20 10 0.01 0.1 Ptcldy
12/29/1899 14 6 T T Ptcldy
12/30/1899 8 0 0 0 Ptcldy
12/31/1899 12 4 T T Cloudy
01/01/1900 19 5 T T Ptcldy

NEW YEARS EVE - DAY 1899-1900
Snow flurries fell virtually all of New Years Eve until shortly after the stroke of midnight (12:15 AM) but with only a trace accumulation. The sky remained cloudy New Years Eve into very early morning hours of New Years Day, until around 3 AM, when the sky cleared, allowing for a clear sunrise New Years Day. The morning low of 5 above was accompanied by only a trace of snow on the ground.

 
The first day of 1900 was cold, but relatively nice across Southeast Lower Michigan. Under partly sunny skies with a few flurries, the temperature crept up to only 19 degrees and the mean temperature of 14 degrees, averaged out to 17 degrees below normal. 

Making weather fun while we all learn,
Bill Deedler - SEMI_WeatherHistorian


1/17/22

December Was Mild & January Is Cold Like Several Analoges Suggested But Where Is The Snow?? Winter 2021-22 Update

Winter 2021-22 teased us again in November with an early start to winter with above normal snow and below normal temperatures. Suggesting we better hunker down for a long cold and snowy winter but Mom Nature with her bag of atmospheric tricks had other ideas. Even with our snowy November; much of Southeast Lower Michigan is averaging up to around a 1/2 foot below average - and it would be worse if November hadn't had above normal snow. Since the official climatological beginning of winter /Dec/ some areas are approaching a foot below normal snow thus far because of both December and January scant snowfalls. True; just under half of January is yet to unfold but the outlook for any major system through the end of the month is questionable at best. 

Nearly all the potent snow systems have circumnavigated the southern Lakes/Northern Ohio Valley extending from Chicago /less snow than we've had at about 1/2 foot/ to Indianapolis /not even an inch/ to Dayton /a few inches to Detroit /just over a foot with 13.2"/. The only decent snowfall has been lake effect as the cold winds blow across the Great Lakes. The city of Cleveland area has been clipped a few times with East storms but still running a snow deficit near 10" even with today's /17th/ storm. Quite contrary to the normal La Nina precipitation pattern we started with in December.

The winter's analogue temperature pattern was primarily suggested to start off above normal but fall below normal mid to possibly late in the period. The following four analogues best represented many factors but primarily temperatures. Why keep the Winter of 2011-12? It scored high marks for December but never saw the change to cold like the other winters. It still is possible the winter still may average above normal with about 1/2 of it yet to come. It actually was the only winter that averaged above normal (and notably) using my method of just a degree of normal (see Legend below). Normal winter temperature for Detroit is 27.9 degrees. The rest of the 11 analogue winters saw an overwhelming amount of analogues averaging around normal /6/ while 4 averaged below normal (see last column). Thus far with everything considered; the Winters of 1984-85 and 1971-72 are up front in the race but the snow better start flying to put 1984-85 out in front. Snowfall for the Winter of 1984-85 totaled 55.1" whereas the Winter of 1971-72 has the edge as of now with just 29.0" total /snowfall thru 1/17/21 - just 13.2"/.


Looking at the latest GFS guidance into the end of January to Groundhog Day plots wave after wave of drier cold air surging from the Arctic Region or central and eastern Canada; spreading into the eastern half of the US. Keeping one eye on the map and the other on the departure scale at the bottom of the loop shows some hefty departures below normal at times. And; these last two weeks of January are normally Southeast Michigan's coldest period of the winter with the daily mean temperature at 25 degrees /normal high lower 30s & lows upper teens/. 

Fortunately; there are some quick moderation trends with surges of milder air ahead of each successive cold shot beginning this week. Undoubtedly this will vary with each run but it does suggest more of the same already seen this January. We are mainly concerned with the trend forecast through the two week period. A few systems should bring snow (possibly even a brief rain) with the best system late in the weekend into early next week. If something outstanding develops in the shorter range; I post on here and FB /Facebook/. The following maps run from Martin Luther King Day /17th/ into Groundhog morning /Feb 2nd/. Don't even ask if he will see his shadow. 😁


Making weather fun while we all learn,
Bill Deedler - SEMI_WeatherHistorian

11/20/21

As More Influential Hemispheric Players Come Together; Will It Lead To A Changeable & Active Winter?

Watching the display of autumn upper winds across North America; many a meteorologist and weather enthusiast will inevitably wonder how the winter patterns will evolve and play out. Even though the pattern has been overwhelmingly warm and wet until recently; when a shift away from the warm pattern was noted late October - a classic time. In La Nina's autumn upper air patterns; it's been my observance a more exaggerated southerly shift in the upper and surface patterns happens mid to late October.  As a result; frost and freezes blanket the landscape and many a plant goes into hibernation or dies off.

Occurring later than usual this fall; final frosts and freezes waited until the last week of October into the first week of November - about a week to 10 days behind the average times. This was precipitated by an unseasonably warm and wet autumn (especially October) leading to a very late autumn color change and subsequent, fall of leaves. 

OCTOBER AVERAGE TEMPERATURE 
Location         Ave      Norm     Depart          Ranking 
DETROIT       59.4       53.0       +6.4       6TH WARMEST
FLINT             58.6       50.2       +8.4       2ND WARMEST
SAGINAW      57.7       50.8       +6.9       4TH WARMEST
OCTOBER PRECIPITATION TOTAL 
Location         Ave        Norm     Depart          Ranking 
DETROIT    5.25"       2.53"      +2.72"     7TH WETTEST
FLINT          5.45"       2.77"      +2.68"     4TH WETTEST
SAGINAW   3.94"       2.91"      +1.03"    22ND WETTEST
___________________________________________________________________ 

WINTER - COLD SEASON OUTLOOK 2021-22

Local and Hemispheric Data Suggests 

Temperatures:

Overall, temperatures are expected to be colder than the last few winters but with averages still around normal to slightly below /+1.0F to -1.5F/. Indications are of an early winter by upper air patterns and analogues relating a colder than average beginning of the cold season (Nov - Mar) which would be mid November into early December, anyway). Particular trends are discussed in the Analogue Section.

As the storm track shifts around this winter, look for temperatures to be quite variable. Rather strong storm tracks will ride on an oscillating southwest to northwest jet stream from the Arctic, northern Pacific and Sub-tropical (see storm tracks) . Once again, how much effect the various air masses have on Southeast Lower Michigan will be guided by La Nina in conjunction with the North Atlantic/Arctic Oscillation /NAO, AO/ (Arctic and Polar jets), the PDO (Pacific jets) and QBO discussed below. These will play a large part on temperature patterns across the Great Lakes. This pattern seen is very true to our typical second consecutive La Nina winters especially when occurring in conjunction with the aforementioned hemispheric players - and I see no reason to deviate from it.

Precipitation:

Precipitation is expected to average above normal which is typical in La Nina's winters, especially the second consecutive winter. Many indicators show above normal precipitation; models, analogues and typical La Nina patterns and storm tracks. Many of the analogues were wetter than normal, a few significantly.

Snowfall:

Normal to Above. A two-tier outlook seems suitable with the expected storm tracks and mixed precipitation included. One of the tracks is expected to be right over/around Southeast Lower Michigan. This would bring the expected precipitation in various forms. Snowfalls ranged around normal to above any dampening would be attributed to mixed precipitation events.

Note categories of snowfall:

Below normal snowfall; more than /-5.0"/ below the winter average snowfall  
Normal snowfall; +/- 5.0" of the winter average snowfall and Above normal snowfall; better than /+5.0"/ of snow above the average. Actual analogue data and norms are listed on the Analogue Table below.

 Hemispheric Discussion 

In case you haven't surmised by now; the upcoming winter is expected to be, like last winter, a La Nina winter. In addition; this winter's La Nina is likely to be generally similar in strength to last year's; albeit possibly a bit stronger and may reach borderline moderate at -1.5 departure. I also look for this winter's La Nina to have more of an influence on our weather than last winter's; mainly due to the atmosphere's stronger resultant La Nina pattern reaction (not dominant last winter) along with the cool (negative) Pacific Decadal Oscillation and an easterly QBO in place. 

 ENSO REGIONS


                            Current ENSO SST anomalies as of early November

Last La Nina was in 2017-18 and previous La Ninas and El Ninos are noted below back to 1950-51.


Below are projected various model ENSO patterns into the Summer of 2022.  Mean La Nina SST anomalies fall to near -1.0C this winter. All models warm the SST's to at least Neutral ENSO by next summer.


North Atlantic/Arctic Oscillation - NAO/AO 

Most winters; the phase of the NAO/AO is one of the most important ingredients to the type of winter to be-had over the central and eastern part of the country; and even parts of the mountainous areas of the west at times. This is one of the most elusive oscillations to predict for more than a week or two out. When the NAO/AO is in a negative phase, generally colder Polar and Arctic air is allowed to dive south over North America. And when in a positive phase, the Polar or Arctic retreats northward and moderating Pacific westerly winds lock-in and prevail. Below are the NAO index and phases into 1860 and I also use the Southern Oscillation Index /SOI/ to determine analogues pre-1950.


 +AO(NAO) and -AO(NAO) explained:

The Arctic Oscillation is tracked by observing 1000-millibar geopotential height anomalies over the far upper latitudes of the Northern Hemisphere, above 20 degrees North to be specific. The AO has two phases: a positive phase, and a negative phase. When the AO is said to be positive (+AO), geopotential height anomalies over the upper latitudes are lower than normal. This means the tropospheric polar vortex is stronger than normal, and this stronger vortex “locks up” the colder air at the upper latitudes, keeping it from flowing south. As a result, a positive AO is associated with above-normal temperatures in the United States. When the AO is said to be negative (-AO), geopotential height anomalies over the upper latitudes are higher than normal. This means the tropospheric polar vortex is weaker, and enables colder air masses to flow down to lower latitudes. As a result, a negative AO is commonly associated with below-normal temperatures in the United States.


SNOW COVER 

One of the newer studies uses October snow-cover over Siberia/Eurasia compared to average to aid in projecting out the main phase and likely corresponding temperature pattern for the winter. In my analogues; I've included this past October's coverage (and looking at the rate of coverage) that has been researched since 1965. In the analogues; you will notice B/A/S for Below, Above and Same under SIB snow column. Simply put; this reflects this October's snow cover compared to the previous analogue La Ninas not average snow cover.  As an example; October 2017 had one of the snowiest coverages by the end of October relative to any year since 1998 with only a few non-analogue years that equaled it. Therefore, October 2017 had more snow cover than this October of 2021. And, snow cover was below /B/ that of 2017. This year's study suggests more snow cover than on average and thus; a -NAO/-AO likely to prevail this winter and thus; colder temperatures (see discussions and map below).

Impacts /Dr. Judah Cohen/ Winter 2021-22

"I have been promising a preliminary winter forecast for surface temperature anomalies for the Northern Hemisphere and today I deliver.  The forecast was generated the last week of October using my estimate of October Eurasian snow cover extent (SCE), the dominant sea level pressure anomaly across Northern Eurasia for October, the September Arctic sea ice extent anomaly and the predicted winter (December-February) Niño 3.4 index (a common indicator for El Niño/Southern Oscillation (ENSO)).  Also I included in this winter’s forecast my own very rough estimate for the winter Pacific Decadal Oscillation (PDO) index.  Typically, I don’t include the PDO index in my winter forecasts, but the strong negative PDO pattern has emerged, and it could very well be a factor.   in Figure i, I present a preliminary AER winter forecast that was shared with clients at the end of October.  I will share an update to the winter forecast on the blog at the end of the month. Please keep in mind since the forecast was generated the observed values for October SCE and SLP are now known and will be used in updated forecasts.  Also, I used as my climatology the values from 1991-2020".

 
Dr. Cohen has a nice update here every week on current and expected trends.
 
 Snow cover as of Nov 13th 2021

Pacific Decadal Oscillation /PDO/ and associated subset EPO

The previous warm phase Pacific Decadal Oscillation recently switched to a cool phase this year from 2020. A cool phase of the PDO is represented on the right of the following example and compare it to the current state.


                      Warm Phase of the PDO         Cool Phase of the PDO


 "When SSTs are anomalously cool in the interior North Pacific and warm along the Pacific Coast, and when sea level pressures are below average over the North Pacific, the PDO has a positive value. When the climate anomaly patterns are reversed, with warm SST anomalies in the interior and cool SST anomalies along the North American coast, or above average sea level pressures over the North Pacific, the PDO has a negative value" (Courtesy of Mantua, 1999).

"The Pacific Decadal Oscillation (PDO) is a pattern of Pacific climate variability similar to ENSO in character, but which varies over a much longer time scale. The PDO can remain in the same phase for up to 20 to 30 years, while ENSO cycles typically only last 6 to 18 months. The PDO, like ENSO, consists of a warm and cool phase which alters upper level atmospheric winds. Shifts in the PDO phase can have significant implications for global climate, affecting Pacific and Atlantic hurricane activity, droughts and flooding around the Pacific basin, the productivity of marine ecosystems, and global land temperature patterns. Experts also believe the PDO can intensify or diminish the impacts of ENSO according to its phase. If both ENSO and the PDO are in the same phase (as in this Winter of 2021-22), it is believed that El Niño/La Nina impacts may be magnified. Conversely, if ENSO and the PDO are out of phase, it has been proposed that they may offset one another, preventing "true" ENSO impacts from occurring". 

http://jisao.washington.edu/pdo
http://www.john-daly.com/theodor/pdotrend.htm

Last Winter of 2020-21, the ENSO (La Nina) and PDO (warm phase) were out of phase and the winter was indeed notably warmer than what is generally seen in a La Nina winter. This was mentioned in last Winter's Outlook and one of the reasons noted that may interfere with the normal LA Nina winter jet and temperature pattern.

The evolving cold phase of the PDO (see below and above cold phase) and weak La Nina are displayed well in this recent Global SST scan on November 13th, 2021. 


The evolving cold phase of the PDO (see below and above cold phase) and weak La Nina are displayed well in this recent Global SST scan on November 13th, 2021. 


SOLAR CYCLE /SC/

Solar cycle actual effects on short term weather and longer term climate variability remain a controversial subject. I've read several articles which support or are against their shorter term winter relevancy. Some theorize that both natural solar cycles and man's influence affect our climate. I am in favor of the solar cycle being somewhat relevant and sometimes giving the present winter cycle a "little kick" in regard to hemispheric wind flow patterns and resulting temperatures.  Numerous recent studies for example, do in fact make the connection to our climate and solar activity including wintertime effects. One of the studies stated the following:

 "The Euro–Atlantic sector seems to be a region with a par-
     ticularly strong solar influence on the troposphere. In fact,
significant positive correlations between solar activity and
   surface temperature in Europe have been reported in several
 papers (e.g. Tung and Camp, 2008; Lean and Rind, 2008;
 Lockwood et al., 2010; Woollings et al., 2010), although
  long records tend to give very weak signals (van Olden-
    borgh et al., 2013). We found a weak but significant change
      in the mean late winter circulation over Europe, which re-
   sults in detectable impacts on the near-surface climate. Fig-
    ure 9 suggests that during solar minima more cold air is ad-
   vected from the Arctic, thus resulting in a slightly increased
 probability of colder winters for large parts of the continent.
 Sirocko et al. (2012) recently reached the same con-
 clusion after analyzing 140 yr in 20CR, although their results
are strongly dependent on their selection criteria for
  the solar minimum composite (van Oldenborgh et al., 2013),
    which includes only one winter for each solar cycle".
 
This Winter solar cycle is similar to only four near the lull of the cycle; 1922-23, 1984-85, 2008-2009 & 2017-18 with 2008-09 the closest.

Solar Cycle 24 & 25


The forecast comes from the Solar Cycle Prediction Panel representing NOAA, NASA and the International Space Environmental Services (ISES).  This amounts to the ‘official’ forecast for the solar cycle.  The Prediction Panel forecasts the sunspot number expected for solar maximum and has predicted Cycle 25 to reach a maximum of 115 occurring in July, 2025.  The error bars on this prediction mean the panel expects the cycle maximum could be between 105-125 with the peak occurring between November 2024 and March 2026.

THE QBO INFLUENCE

The QBO, or Quasi-Biennial Oscillation, is an oscillation in the wind direction in the stratosphere within about 15 degrees of the equator. Over a roughly two-year period, winds tend to oscillate between westward and eastward, with the switch between west and east winds starting high in the stratosphere and then shifting lower in altitude with time. The QBO is the result of waves propagating vertically in the atmosphere that then interact with the mean flow to slowly change wind speeds and direction. These changes influence the overall global circulation patterns, which in turn influence winter weather patterns across North America. 

Downward motion of the easterlies is usually more irregular than that of the westerlies. The amplitude of the easterly phase is about twice as strong as that of the westerly phase. At the top of the vertical QBO domain, easterlies dominate, while at the bottom, westerlies are more likely to be found. At the 30mb level, with regards to monthly mean zonal winds, the strongest recorded easterly was 29.55 m/s in November 2005, while the strongest recorded westerly was only 15.62 m/s in June 1995.

Effects of the QBO include mixing of stratospheric ozone by the secondary circulation caused by the QBO, modification of monsoon precipitation, and an influence on stratospheric circulation in northern hemisphere winter (mediated partly by a change in the frequency of sudden stratospheric warmings). Eastward phases of the QBO often coincide with more sudden stratospheric warmings, a weaker Atlantic jet stream and cold winters in Northern Europe and eastern USA whereas westward phases of the QBO often coincide with mild winters in eastern USA and a strong Atlantic jet stream with mild, wet stormy winters in northern Europe. In addition, the QBO has been shown to affect hurricane frequency during hurricane seasons in the Atlantic and research has also been conducted investigating a possible relationship between ENSO (El Nino Southern Oscillation) and the QBO.

The following Map - 1 shows winters with weak La Nina (as in this upcoming winter) along with negative QBO values from November into March during the cold season (as expected this cold season). The Maps below Map - 1 (Maps - 2) show average winter temperatures with an easterly QBO and westerly QBO. We are presently in an easterly, negative QBO and trending more negative.

 Map - 1


Maps - 2

QBO and WinterTemperatures Trends 


500 MB HEIGHTS/JETS FROM COLD SEASON 2021-22 ANALOGUES


                                               ANALOGUE STORM TRACKS


WINTER 2021-22 ANALOGUES - SOUTHEAST LOWER MICHIGAN


          Click on chart to enlarge

Some additional category explanations in the analogue chart from left to right:

AO/SC

AO - The predominant phase of the Arctic Oscillation during that winter. AO- (negative), AOn   
         (neutral) or AO+ (positive).
SC -  position of the solar cycle during that winter. Breaking it down (see solar cycle chart):   
         SC-- (opposite high cycle compared to the present, least similar) SC+/- (sunspots 
         waning but not near minimum or 2017 low level. Finally, S++ where solar sunspot cycle is  
         at or very close to the low cycle of 2017 and/or is at the same decline with 2017...the   
         best comparison and likeness.
          

QBO - W=West wind prevailed that winter or E=East wind prevailed. Trends: -/- (weak and    
           weakening trend), -/+ (weak but strengthening), no sign (steady trend, no change) +       
           moderate and strengthening +/- strong but weakening. Note that the trend now in the fall  
           of 2017 is E/+, a moderate east wind and still strengthening. This fits with all the winter's
           that contained a easterly QBO. 1950-51 (weak easterly and weakening further), 1984-85 & 1996-97 (strong easterly but weakening),  2000-01  (moderate easterly and steady) then 2011-12 (weak easterly but increasing) and finally, 2017-18 (moderate easterly).

Sib snow - Siberian snow cover observed this October of 2021 and is compared to the Siberian snow cover of the given analogue October year.
 
Therefore;  A letter "B" denotes this October had less snow than the given October year. An "A" means this October 2021 had more snow than the given October year. A letter "S" indicates snow cover was about the same as the given October year.
  
                Southeast Lower Michigan Analogue Temperatures

Winter 2021-22  and Cold Season


ANALOGUE TEMPS/SNOW 

Analogue temperatures still have the biased of slightly below normal temperatures  with some impressive cold monthly readings. However; at the same time they are balanced to a large extent with a significant number of warmer months throughout the second La Nina sample. The strongest trend in the lot is the normal or average temperature winters. This will become more evident as to how and why when looking at the whole pattern coming together with the key players, mentioned at opening. I expect a quite a roller-coaster of air masses and temperatures with final tally of normal - to slightly below. Snowfall is a crap-shoot like always relating to where storm tracks sets up and how much moisture occurs with the cold air masses. All we can do is look at recent Autumn patterns, La Nina, NAO, PDO and QBO. All suggest normal to above snowfall. Snowiest regions initially lean to the center and northern half of Southeast Michigan - basically I-696/Walter Reuther northward into the Saginaw Valley and Thumb Region. One caveat however; has been the far northern regions have been drier than the mid and southern areas this year. We'll see how it plays out. Snowiest timing? Also scattered throughout the season but with a edge to early-mid winter. Early analogue(s) that bear watching 1984-85.

Nov - Dec period shows a fairly strong biased toward periods of below normal temperatures by way of some aggressive early season cold snaps. This was offset by late autumn/early winter moderating periods between as the Pacific jet/ridging moves inland between "blows" of cold. Overall, nearly all (but two) Novembers averaged below normal with a significant number of Decembers also below - some impressively! What's really interesting is that a fair number of Decembers were more than a degree above normal, also. Feast or Famine. Six below to four above with one normal at Detroit. This even occurred intra-month and many times it does with cold first half/mild second or visa-versa.

Jan - Shows almost the identical pattern as Decembers with 5 colder and 4 warmer and two normal - very erratic but again with a slight cold biased. Still; looks like a bet for a "January Thaw" which does happen most winters. A snowy month?

Feb -  Variety is again the name of the game but with a lean to more normal or moderate temperatures. If however, the winter begins cold in November-December, February's temperature pattern may also be colder than average.

Mar-Apr Let's hope for an early spring for a change. We'll deal with that later.


 US CFV2 MODEL AND EUROPEAN SEASON MODELS

USA

CFSV2  - SST

 700 MB WINDS/ANOMALIES


CFSV2 -TEMPS_DEC - FEB


CFSV2 -TEMPS_FEB - APR


EURO MODELS /A BLEND/ 500 MB/TEMPS/PCPN


Look for more write-ups through the winter involving notable weather events, major storms and comparing the Winter Outlook trends and actual weather trends!

Making weather fun while we all learn,
Bill Deedler - SEMI_WeatherHistorian